Qala Airbnb Market Analysis 2026: Short Term Rental Data & Vacation Rental Statistics in Gozo Region, Malta
Is Airbnb profitable in Qala in 2026? Explore comprehensive Airbnb analytics for Qala, Gozo Region, Malta to uncover income potential. This 2026 STR market report for Qala, based on AirROI data from February 2025 to January 2026, reveals key trends in the niche market of 101 active listings.
Whether you're considering an Airbnb investment in Qala, optimizing your existing vacation rental, or exploring rental arbitrage opportunities, understanding the Qala Airbnb data is crucial. Leveraging the low regulation environment is key to maximizing your short term rental income potential. Let's dive into the specifics.
Key Qala Airbnb Performance Metrics Overview
Monthly Airbnb Revenue Variations & Income Potential in Qala (2026)
Understanding the monthly revenue variations for Airbnb listings in Qala is key to maximizing your short term rental income potential. Seasonality significantly impacts earnings. Our analysis, based on data from the past 12 months, shows that the peak revenue month for STRs in Qala is typically August, while February often presents the lowest earnings, highlighting opportunities for strategic pricing adjustments during shoulder and low seasons. Explore the typical Airbnb income in Qala across different performance tiers:
- Best-in-class properties (Top 10%) achieve $4,179+ monthly, often utilizing dynamic pricing and superior guest experiences.
- Strong performing properties (Top 25%) earn $2,722 or more, indicating effective management and desirable locations/amenities.
- Typical properties (Median) generate around $1,465 per month, representing the average market performance.
- Entry-level properties (Bottom 25%) see earnings around $678, often with potential for optimization.
Average Monthly Airbnb Earnings Trend in Qala
Qala Airbnb Occupancy Rate Trends (2026)
Maximize your bookings by understanding the Qala STR occupancy trends. Seasonal demand shifts significantly influence how often properties are booked. Typically, Augustsees the highest demand (peak season occupancy), while January experiences the lowest (low season). Effective strategies, like adjusting minimum stays or offering promotions, can boost occupancy during slower periods. Here's how different property tiers perform in Qala:
- Best-in-class properties (Top 10%) achieve 75%+ occupancy, indicating high desirability and potentially optimized availability.
- Strong performing properties (Top 25%) maintain 61% or higher occupancy, suggesting good market fit and guest satisfaction.
- Typical properties (Median) have an occupancy rate around 43%.
- Entry-level properties (Bottom 25%) average 23% occupancy, potentially facing higher vacancy.
Average Monthly Occupancy Rate Trend in Qala
Average Daily Rate (ADR) Airbnb Trends in Qala (2026)
Effective short term rental pricing strategy in Qala involves understanding monthly ADR fluctuations. The Average Daily Rate (ADR) for Airbnb in Qala typically peaks in September and dips lowest during February. Leveraging Airbnb dynamic pricing tools or strategies based on this seasonality can significantly boost revenue. Here's a look at the typical nightly rates achieved:
- Best-in-class properties (Top 10%) command rates of $255+ per night, often due to premium features or locations.
- Strong performing properties (Top 25%) achieve nightly rates of $192 or more.
- Typical properties (Median) charge around $121 per night.
- Entry-level properties (Bottom 25%) earn around $75 per night.
Average Daily Rate (ADR) Trend by Month in Qala
Get Live Qala Market Intelligence 👇

Explore Real-time Analytics
Airbnb Seasonality Analysis & Trends in Qala (2026)
Peak Season (August, July, September)
- Revenue averages $3,453 per month
- Occupancy rates average 64.6%
- Daily rates average $160
Shoulder Season
- Revenue averages $1,728 per month
- Occupancy maintains around 40.5%
- Daily rates hold near $141
Low Season (January, February, March)
- Revenue drops to average $845 per month
- Occupancy decreases to average 26.3%
- Daily rates adjust to average $131
Seasonality Insights for Qala
- The Airbnb seasonality in Qala shows highly seasonal trends requiring careful strategy. While the sections above show seasonal averages, it's also insightful to look at the extremes:
- During the high season, the absolute peak month showcases Qala's highest earning potential, with monthly revenues capable of climbing to $3,999, occupancy reaching a high of 71.4%, and ADRs peaking at $164.
- Conversely, the slowest single month of the year, typically falling within the low season, marks the market's lowest point. In this month, revenue might dip to $694, occupancy could drop to 22.6%, and ADRs may adjust down to $127.
- Understanding both the seasonal averages and these monthly peaks and troughs in revenue, occupancy, and ADR is crucial for maximizing your Airbnb profit potential in Qala.
Seasonal Strategies for Maximizing Profit
- Peak Season: Maximize revenue through premium pricing and potentially longer minimum stays. Ensure high availability.
- Low Season: Offer competitive pricing, special promotions (e.g., extended stay discounts), and flexible cancellation policies. Target off-season travelers like remote workers or budget-conscious guests.
- Shoulder Seasons: Implement dynamic pricing that balances peak and low rates. Target weekend travelers or specific events. Offer slightly more flexible terms than peak season.
- Regularly analyze your own performance against these Qala seasonality benchmarks and adjust your pricing and availability strategy accordingly.
Best Areas for Airbnb Investment in Qala (2026)
Exploring the top neighborhoods for short-term rentals in Qala? This section highlights key areas, outlining why they are attractive for hosts and guests, along with notable local attractions. Consider these locations based on your target guest profile and investment strategy.
| Neighborhood / Area | Why Host Here? (Target Guests & Appeal) | Key Attractions & Landmarks |
|---|---|---|
| Qala Village | A charming and picturesque village in Gozo, known for its tranquil ambiance and stunning views. A great base for tourists wanting to explore the natural beauty of Gozo. | Qala Belvedere, Hondoq Bay, St. Joseph's Church, Mġarr ix-Xini, Qala Windmill |
| Mgarr Harbour | A bustling harbor area perfect for visitors looking to explore the islands. It’s popular for boat trips and offers beautiful sea views, along with local dining options. | Mgarr Harbour, Round Tower, The Church of St. Mary, Nearby beach spots |
| Ramla Bay | Famous for its unique red sandy beach, Ramla Bay is a top destination for both relaxation and water sports, attracting families and young couples. | Ramla Bay Beach, Calypso's Cave, Hiking trails around the area |
| Comino | A small island known for its stunning Blue Lagoon and crystal-clear waters, attracting tourists for day trips and unique stays. | Blue Lagoon, Comino Island hiking trails, St. Mary��’s Tower |
| Victoria (Rabat) | The capital of Gozo, rich in history and culture, with charming streets and historical sites, attracting history buffs and tourists alike. | Citadel, St. George's Basilica, Gozo Museum of Archaeology, Pjazza Indipendenza |
| Nadur | A picturesque village with beautiful countryside views and known for its traditional festas and vibrant local culture, attracting those looking for an authentic experience. | Nadur Parish Church, Batterija tat-Taż-żewwi, Nearby beaches |
| Xlendi | A small coastal village with a beautiful bay, popular with both tourists and locals, known for its stunning views and restaurants by the sea. | Xlendi Bay, Xlendi Tower, Blue Horizon Diving, Hiking trails |
| Marsalforn | A popular beach resort known for its vibrant summer atmosphere, with many amenities for tourists including bars, restaurants, and water sports. | Marsalforn Bay, Salt Pans, Scuba diving spots, Marsalforn promenade |
Understanding Airbnb License Requirements & STR Laws in Qala (2026)
While Qala, Gozo Region, Malta currently shows low STR regulations, specific Airbnb license requirements might still exist or change. Always verify the latest short term rental regulations and Airbnb license requirements directly with local government authorities for Qala to ensure full compliance before hosting.
(Source: AirROI data, 2026, finding no licensed listings among those analyzed)
Top Performing Airbnb Properties in Qala (2026)
Benchmark your potential! Explore examples of top-performing Airbnb properties in Qalabased on Trailing Twelve Month (TTM) revenue. Analyze their characteristics, revenue, occupancy rate, and ADR to understand what drives success in this market.

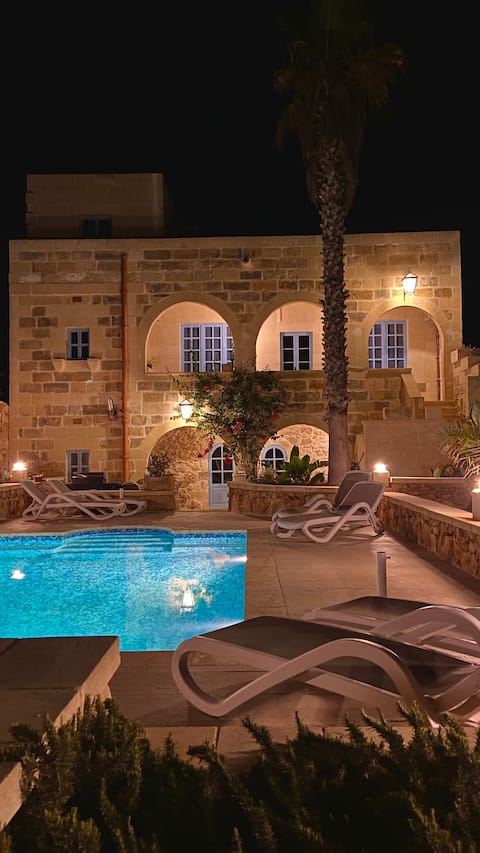
Gozo: Luxury house with indoor/outdoor pool
Entire Place • 4 bedrooms

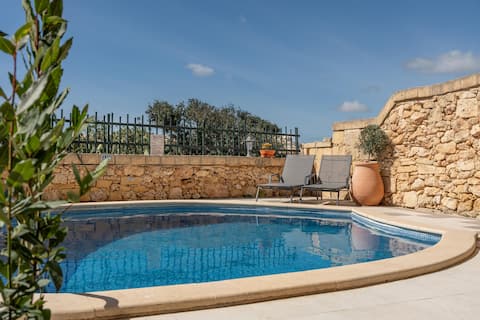
Unique Country house with indoor / outdoor pool
Entire Place • 4 bedrooms
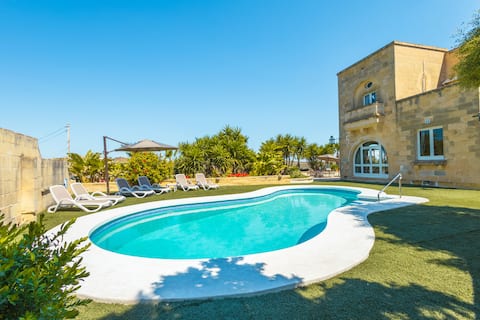
Farmhouse with private pool
Entire Place • 4 bedrooms
Blue Lagoon farmhouse
Entire Place • 5 bedrooms
Villa Nirvana
Entire Place • 4 bedrooms

Peppi Farmhouse
Entire Place • 3 bedrooms
Note: Performance varies based on location, size, amenities, seasonality, and management quality. Data reflects the past 12 months.
Top Performing Airbnb Hosts in Qala (2026)
Learn from the best! This table showcases top-performing Airbnb hosts in Qala based on the number of properties managed and estimated total revenue over the past year. Analyze their scale and performance metrics.
| Host Name | Properties | Grossing Revenue | Stay Reviews | Avg Rating |
|---|---|---|---|---|
| Jade | 5 | $131,816 | 248 | 4.82/5.0 |
| Andrew | 4 | $127,165 | 71 | 4.91/5.0 |
| Samudra Community | 3 | $118,156 | 76 | 4.81/5.0 |
| Rachel | 3 | $97,900 | 108 | 4.92/5.0 |
| Katarzyna | 11 | $80,771 | 478 | 4.83/5.0 |
| Kevin | 2 | $80,468 | 28 | 4.95/5.0 |
| Baron Holiday Homes | 2 | $79,949 | 33 | 4.71/5.0 |
| Consuela | 1 | $70,030 | 67 | 4.99/5.0 |
| Arnold | 1 | $64,749 | 104 | 4.83/5.0 |
| Chris | 1 | $50,847 | 37 | 4.95/5.0 |
Analyzing the strategies of top hosts, such as their property selection, pricing, and guest communication, can offer valuable lessons for optimizing your own Airbnb operations in Qala.
Dive Deeper: Advanced Qala STR Market Data (2026)
Ready to unlock more insights? AirROI provides access to advanced metrics and comprehensive Airbnb data for Qala. Explore detailed analytics beyond this report to refine your investment strategy, optimize pricing, and maximize your vacation rental profits.
Explore Advanced MetricsQala Short-Term Rental Market Composition (2026): Property & Room Types
Room Type Distribution
Property Type Distribution
Market Composition Insights for Qala
- The Qala Airbnb market composition is heavily skewed towards Entire Home/Apt listings, which make up 78.2% of the 101 active rentals. This indicates strong guest preference for privacy and space.
- Looking at the property type distribution in Qala, House properties are the most common (55.4%), reflecting the local real estate landscape.
- Houses represent a significant 55.4% portion, catering likely to families or larger groups.
- Smaller segments like hotel/boutique, outdoor/unique (combined 2.0%) offer potential for unique stay experiences.
Qala Airbnb Room Capacity Analysis (2026): Bedroom Distribution
Distribution of Listings by Number of Bedrooms
Room Capacity Insights for Qala
- The dominant room capacity in Qala is 3 bedrooms listings, making up 36.6% of the market. This suggests a strong demand for properties suitable for families or small groups.
- Together, 3 bedrooms and 1 bedroom properties represent 55.4% of the active Airbnb listings in Qala, indicating a high concentration in these sizes.
- A significant 48.5% of listings offer 3+ bedrooms, catering to larger groups and families seeking more space in Qala.
Qala Vacation Rental Guest Capacity Trends (2026)
Distribution of Listings by Guest Capacity
Guest Capacity Insights for Qala
- The most common guest capacity trend in Qala vacation rentals is listings accommodating 8+ guests (25.7%). This suggests the primary traveler segment is likely larger groups.
- Properties designed for 8+ guests and 6 guests dominate the Qala STR market, accounting for 46.5% of listings.
- 51.5% of properties accommodate 6+ guests, serving the market segment for larger families or group travel in Qala.
- On average, properties in Qala are equipped to host 4.7 guests.
Qala Airbnb Booking Patterns (2026): Available vs. Booked Days
Available Days Distribution
Booked Days Distribution
Booking Pattern Insights for Qala
- The most common availability pattern in Qala falls within the 181-270 days range, representing 47.5% of listings. This suggests many properties have significant open periods on their calendars.
- Approximately 79.2% of listings show high availability (181+ days open annually), indicating potential for increased bookings or specific owner usage patterns.
- For booked days, the 91-180 days range is most frequent in Qala (47.5%), reflecting common guest stay durations or potential owner blocking patterns.
- A notable 21.8% of properties secure long booking periods (181+ days booked per year), highlighting successful long-term rental strategies or significant owner usage.
Qala Airbnb Minimum Stay Requirements Analysis
Distribution of Listings by Minimum Night Requirement
1 Night
17 listings
16.8% of total
2 Nights
11 listings
10.9% of total
3 Nights
15 listings
14.9% of total
4-6 Nights
18 listings
17.8% of total
30+ Nights
40 listings
39.6% of total
Key Insights
- The most prevalent minimum stay requirement in Qala is 30+ Nights, adopted by 39.6% of listings. This highlights the market's preference for longer commitments.
- A significant segment (39.6%) caters to monthly stays (30+ nights) in Qala, pointing to opportunities in the extended-stay market.
Recommendations
- Align with the market by considering a 30+ Nights minimum stay, as 39.6% of Qala hosts use this setting.
- If feasible, allowing 1-night stays, especially midweek or during low season, could capture last-minute bookings, as only 16.8% currently do.
- Explore offering discounts for stays of 30+ nights to attract the 39.6% of the market seeking extended stays.
- Adjust minimum nights based on seasonality – potentially shorter during low season and longer during peak demand periods in Qala.
Qala Airbnb Cancellation Policy Trends Analysis (2026)
Super Strict 30 Days
3 listings
3% of total
Limited
2 listings
2% of total
Super Strict 60 Days
5 listings
5% of total
Flexible
9 listings
9% of total
Moderate
21 listings
21% of total
Firm
41 listings
41% of total
Strict
19 listings
19% of total
Cancellation Policy Insights for Qala
- The prevailing Airbnb cancellation policy trend in Qala is Firm, used by 41% of listings.
- A majority (60.0%) of hosts in Qala utilize Firm or Strict policies, indicating a market where hosts prioritize booking security.
Recommendations for Hosts
- Consider adopting a Firm policy to align with the 41% market standard in Qala.
- Regularly review your cancellation policy against competitors and market demand shifts in Qala.
Qala STR Booking Lead Time Analysis (2026)
Average Booking Lead Time by Month
Booking Lead Time Insights for Qala
- The overall average booking lead time for vacation rentals in Qala is 61 days.
- Guests book furthest in advance for stays during August (average 95 days), likely coinciding with peak travel demand or local events.
- The shortest booking windows occur for stays in January (average 23 days), indicating more last-minute travel plans during this time.
- Seasonally, Summer (79 days avg.) sees the longest lead times, while Winter (36 days avg.) has the shortest, reflecting typical travel planning cycles.
Recommendations for Hosts
- Use the overall average lead time (61 days) as a baseline for your pricing and availability strategy in Qala.
- For August stays, consider implementing length-of-stay discounts or slightly higher rates for bookings made less than 95 days out to capitalize on advance planning.
- Target marketing efforts for the Summer season well in advance (at least 79 days) to capture early planners.
- Monitor your own booking lead times against these Qala averages to identify opportunities for dynamic pricing adjustments.
Popular & Essential Airbnb Amenities in Qala (2026)
Amenity Prevalence
Amenity Insights for Qala
- Essential amenities in Qala that guests expect include: Wifi. Lacking these (this) could significantly impact bookings.
- Popular amenities like Air conditioning, First aid kit, TV are common but not universal. Offering these can provide a competitive edge.
Recommendations for Hosts
- Ensure your listing includes all essential amenities for Qala: Wifi.
- Prioritize adding missing essentials: Wifi.
- Consider adding popular differentiators like Air conditioning or First aid kit to increase appeal.
- Highlight unique or less common amenities you offer (e.g., hot tub, dedicated workspace, EV charger) in your listing description and photos.
- Regularly check competitor amenities in Qala to stay competitive.
Qala Airbnb Guest Demographics & Profile Analysis (2026)
Guest Profile Summary for Qala
- The typical guest profile for Airbnb in Qala consists of predominantly international visitors (92%), with top international origins including Germany, typically belonging to the Post-2000s (Gen Z/Alpha) group (50%), primarily speaking English or French.
- Domestic travelers account for 7.9% of guests.
- Key international markets include United Kingdom (28.7%) and Germany (11.8%).
- Top languages spoken are English (41.7%) followed by French (11.9%).
- A significant demographic segment is the Post-2000s (Gen Z/Alpha) group, representing 50% of guests.
Recommendations for Hosts
- Focus marketing internationally, particularly towards travelers from Germany.
- Tailor amenities and listing descriptions to appeal to the dominant Post-2000s (Gen Z/Alpha) demographic (e.g., highlight fast WiFi, smart home features, local guides).
- Highlight unique local experiences or amenities relevant to the primary guest profile.
- Consider seasonal promotions aligned with peak travel times for key origin markets.
Nearby Short-Term Rental Market Comparison
How does the Qala Airbnb market stack up against its neighbors? Compare key performance metrics like average monthly revenue, ADR, and occupancy rates in surrounding areas to understand the broader regional STR landscape.
| Market | Active Properties | Monthly Revenue | Daily Rate | Avg. Occupancy |
|---|---|---|---|---|
| Mdina | 16 | $3,124 | $218.25 | 57% |
| Taormina | 1,004 | $2,744 | $247.48 | 48% |
| Valletta | 604 | $2,598 | $187.70 | 53% |
| Mellieħa | 455 | $2,387 | $181.28 | 51% |
| Trecastagni | 57 | $2,356 | $307.87 | 34% |
| Senglea | 106 | $2,216 | $142.33 | 60% |
| Żejtun | 44 | $2,210 | $189.49 | 45% |
| Santa Venerina | 52 | $2,153 | $278.18 | 41% |
| Birgu | 108 | $2,141 | $156.24 | 57% |
| Graniti | 20 | $2,139 | $177.04 | 47% |