Munxar Airbnb Market Analysis 2026: Short Term Rental Data & Vacation Rental Statistics in Gozo Region, Malta
Is Airbnb profitable in Munxar in 2026? Explore comprehensive Airbnb analytics for Munxar, Gozo Region, Malta to uncover income potential. This 2026 STR market report for Munxar, based on AirROI data from February 2025 to January 2026, reveals key trends in the niche market of 111 active listings.
Whether you're considering an Airbnb investment in Munxar, optimizing your existing vacation rental, or exploring rental arbitrage opportunities, understanding the Munxar Airbnb data is crucial. Leveraging the low regulation environment is key to maximizing your short term rental income potential. Let's dive into the specifics.
Key Munxar Airbnb Performance Metrics Overview
Monthly Airbnb Revenue Variations & Income Potential in Munxar (2026)
Understanding the monthly revenue variations for Airbnb listings in Munxar is key to maximizing your short term rental income potential. Seasonality significantly impacts earnings. Our analysis, based on data from the past 12 months, shows that the peak revenue month for STRs in Munxar is typically August, while January often presents the lowest earnings, highlighting opportunities for strategic pricing adjustments during shoulder and low seasons. Explore the typical Airbnb income in Munxar across different performance tiers:
- Best-in-class properties (Top 10%) achieve $3,268+ monthly, often utilizing dynamic pricing and superior guest experiences.
- Strong performing properties (Top 25%) earn $2,323 or more, indicating effective management and desirable locations/amenities.
- Typical properties (Median) generate around $1,479 per month, representing the average market performance.
- Entry-level properties (Bottom 25%) see earnings around $839, often with potential for optimization.
Average Monthly Airbnb Earnings Trend in Munxar
Munxar Airbnb Occupancy Rate Trends (2026)
Maximize your bookings by understanding the Munxar STR occupancy trends. Seasonal demand shifts significantly influence how often properties are booked. Typically, Augustsees the highest demand (peak season occupancy), while January experiences the lowest (low season). Effective strategies, like adjusting minimum stays or offering promotions, can boost occupancy during slower periods. Here's how different property tiers perform in Munxar:
- Best-in-class properties (Top 10%) achieve 76%+ occupancy, indicating high desirability and potentially optimized availability.
- Strong performing properties (Top 25%) maintain 62% or higher occupancy, suggesting good market fit and guest satisfaction.
- Typical properties (Median) have an occupancy rate around 45%.
- Entry-level properties (Bottom 25%) average 24% occupancy, potentially facing higher vacancy.
Average Monthly Occupancy Rate Trend in Munxar
Average Daily Rate (ADR) Airbnb Trends in Munxar (2026)
Effective short term rental pricing strategy in Munxar involves understanding monthly ADR fluctuations. The Average Daily Rate (ADR) for Airbnb in Munxar typically peaks in August and dips lowest during February. Leveraging Airbnb dynamic pricing tools or strategies based on this seasonality can significantly boost revenue. Here's a look at the typical nightly rates achieved:
- Best-in-class properties (Top 10%) command rates of $222+ per night, often due to premium features or locations.
- Strong performing properties (Top 25%) achieve nightly rates of $148 or more.
- Typical properties (Median) charge around $107 per night.
- Entry-level properties (Bottom 25%) earn around $76 per night.
Average Daily Rate (ADR) Trend by Month in Munxar
Get Live Munxar Market Intelligence 👇

Explore Real-time Analytics
Airbnb Seasonality Analysis & Trends in Munxar (2026)
Peak Season (August, July, September)
- Revenue averages $3,034 per month
- Occupancy rates average 64.0%
- Daily rates average $146
Shoulder Season
- Revenue averages $1,635 per month
- Occupancy maintains around 43.8%
- Daily rates hold near $121
Low Season (January, February, December)
- Revenue drops to average $781 per month
- Occupancy decreases to average 23.5%
- Daily rates adjust to average $116
Seasonality Insights for Munxar
- The Airbnb seasonality in Munxar shows highly seasonal trends requiring careful strategy. While the sections above show seasonal averages, it's also insightful to look at the extremes:
- During the high season, the absolute peak month showcases Munxar's highest earning potential, with monthly revenues capable of climbing to $3,297, occupancy reaching a high of 67.6%, and ADRs peaking at $150.
- Conversely, the slowest single month of the year, typically falling within the low season, marks the market's lowest point. In this month, revenue might dip to $644, occupancy could drop to 21.0%, and ADRs may adjust down to $106.
- Understanding both the seasonal averages and these monthly peaks and troughs in revenue, occupancy, and ADR is crucial for maximizing your Airbnb profit potential in Munxar.
Seasonal Strategies for Maximizing Profit
- Peak Season: Maximize revenue through premium pricing and potentially longer minimum stays. Ensure high availability.
- Low Season: Offer competitive pricing, special promotions (e.g., extended stay discounts), and flexible cancellation policies. Target off-season travelers like remote workers or budget-conscious guests.
- Shoulder Seasons: Implement dynamic pricing that balances peak and low rates. Target weekend travelers or specific events. Offer slightly more flexible terms than peak season.
- Regularly analyze your own performance against these Munxar seasonality benchmarks and adjust your pricing and availability strategy accordingly.
Best Areas for Airbnb Investment in Munxar (2026)
Exploring the top neighborhoods for short-term rentals in Munxar? This section highlights key areas, outlining why they are attractive for hosts and guests, along with notable local attractions. Consider these locations based on your target guest profile and investment strategy.
| Neighborhood / Area | Why Host Here? (Target Guests & Appeal) | Key Attractions & Landmarks |
|---|---|---|
| Munxar Village | A charming village with traditional Maltese architecture. Ideal for travelers looking for a local experience with easy access to beautiful countryside and nearby attractions. | Xlendi Bay, Il-Kantra Club, The Azure Window, San Blas Bay, St. Thomas Bay |
| Xlendi Bay | A picturesque bay famous for its stunning cliffs and crystal-clear waters. A hotspot for swimming, diving, and waterfront dining, making it popular among tourists. | Xlendi Beach, Diving Schools, Xlendi Promenade, Restaurants with sea views, Cliff walks |
| Dwejra | Known for its scenic coastal landscape, including the Blue Hole and Fungus Rock. Attracts nature lovers and adventure seekers. | Dwejra Bay, Azure Window Ruins, Diving opportunities, Nature walks, Scenic viewpoints |
| Sannat | Offers a serene environment and is close to several natural and historical sites. Great for those who want to explore Gozo's cultural heritage. | Ta' Kola Windmill, Sannat Cliffs, Gharb Folklore Museum, Historical temples, Quiet countryside |
| Victoria | The capital city of Gozo, rich in history and culture. Popular with tourists visiting museums, shops, and festivals. | Citadel, Gozo Museum of Archaeology, Victoria Market, St. George's Basilica, Historical sites |
| Qala | A peaceful village with beautiful views and access to nearby beaches. Ideal for families and relaxation. | Ramla Bay, Qala Belvedere, Gozo Ferry Terminal, Local craft shops, Quiet beaches |
| Comino | A small island known for its unspoiled natural beauty and the Blue Lagoon. Attracts beach lovers and day-trippers. | Blue Lagoon, St. Mary’s Tower, Nature walks, Snorkeling spots, Scenic viewpoints |
| Marsalforn | A popular beach resort with a vibrant atmosphere and numerous dining options. Great for summer tourism. | Marsalforn Bay, Beaches, Water sports, Restaurants and bars, Coastal walks |
Understanding Airbnb License Requirements & STR Laws in Munxar (2026)
While Munxar, Gozo Region, Malta currently shows low STR regulations, specific Airbnb license requirements might still exist or change. Always verify the latest short term rental regulations and Airbnb license requirements directly with local government authorities for Munxar to ensure full compliance before hosting.
(Source: AirROI data, 2026, based on 1% licensed listings)
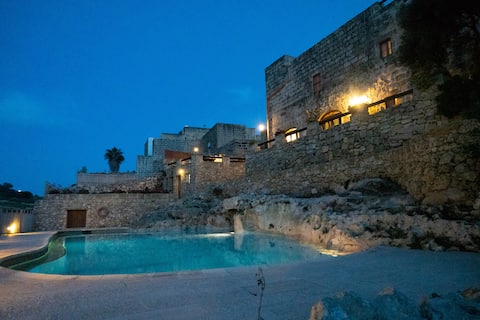
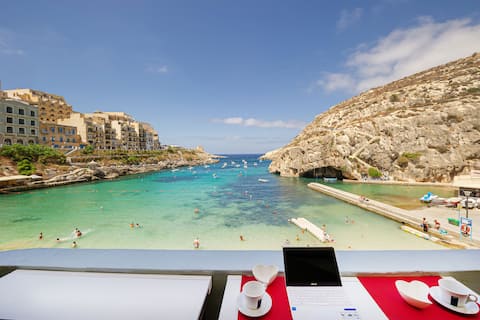
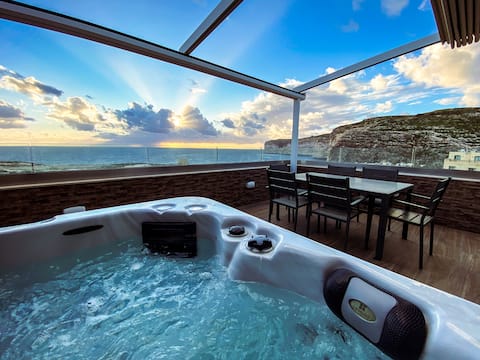
Top Performing Airbnb Properties in Munxar (2026)
Benchmark your potential! Explore examples of top-performing Airbnb properties in Munxarbased on Trailing Twelve Month (TTM) revenue. Analyze their characteristics, revenue, occupancy rate, and ADR to understand what drives success in this market.
Villeleynah Holiday Home
Entire Place • 5 bedrooms
3 Bedroom Traditional House, Pool & Valley Views
Entire Place • 3 bedrooms
Brilliant Beachfront Apt with Super Sunset Seaview
Entire Place • 1 bedroom

Traditional Farmhouse with Private Pool and Views
Entire Place • 3 bedrooms
Blue Sky Xlendi
Entire Place • 2 bedrooms

Waterfront apartment with sea and cliff viewing
Entire Place • 3 bedrooms
Note: Performance varies based on location, size, amenities, seasonality, and management quality. Data reflects the past 12 months.
Top Performing Airbnb Hosts in Munxar (2026)
Learn from the best! This table showcases top-performing Airbnb hosts in Munxar based on the number of properties managed and estimated total revenue over the past year. Analyze their scale and performance metrics.
| Host Name | Properties | Grossing Revenue | Stay Reviews | Avg Rating |
|---|---|---|---|---|
| Janina And Simon | 6 | $140,176 | 476 | 4.92/5.0 |
| Kevin | 1 | $107,457 | 65 | 4.89/5.0 |
| Melissa | 8 | $100,297 | 680 | 4.58/5.0 |
| Frank | 2 | $78,587 | 396 | 4.96/5.0 |
| Kris | 7 | $73,761 | 132 | 4.87/5.0 |
| Godwin | 3 | $61,643 | 74 | 5.00/5.0 |
| Kamila | 6 | $50,558 | 96 | 4.67/5.0 |
| Fabiano | 5 | $44,462 | 218 | 4.74/5.0 |
| Matthew Three Sixty Estates | 2 | $44,222 | 24 | 4.61/5.0 |
| Michael | 1 | $42,311 | 108 | 4.83/5.0 |
Analyzing the strategies of top hosts, such as their property selection, pricing, and guest communication, can offer valuable lessons for optimizing your own Airbnb operations in Munxar.
Dive Deeper: Advanced Munxar STR Market Data (2026)
Ready to unlock more insights? AirROI provides access to advanced metrics and comprehensive Airbnb data for Munxar. Explore detailed analytics beyond this report to refine your investment strategy, optimize pricing, and maximize your vacation rental profits.
Explore Advanced MetricsMunxar Short-Term Rental Market Composition (2026): Property & Room Types
Room Type Distribution
Property Type Distribution
Market Composition Insights for Munxar
- The Munxar Airbnb market composition is heavily skewed towards Entire Home/Apt listings, which make up 97.3% of the 111 active rentals. This indicates strong guest preference for privacy and space.
- Looking at the property type distribution in Munxar, Apartment/Condo properties are the most common (88.3%), reflecting the local real estate landscape.
- Smaller segments like hotel/boutique (combined 0.9%) offer potential for unique stay experiences.
Munxar Airbnb Room Capacity Analysis (2026): Bedroom Distribution
Distribution of Listings by Number of Bedrooms
Room Capacity Insights for Munxar
- The dominant room capacity in Munxar is 2 bedrooms listings, making up 54.1% of the market. This suggests a strong demand for properties suitable for couples or solo travelers.
- Together, 2 bedrooms and 1 bedroom properties represent 73.0% of the active Airbnb listings in Munxar, indicating a high concentration in these sizes.
- A significant 22.5% of listings offer 3+ bedrooms, catering to larger groups and families seeking more space in Munxar.
Munxar Vacation Rental Guest Capacity Trends (2026)
Distribution of Listings by Guest Capacity
Guest Capacity Insights for Munxar
- The most common guest capacity trend in Munxar vacation rentals is listings accommodating 4 guests (35.1%). This suggests the primary traveler segment is likely small families or groups.
- Properties designed for 4 guests and 6 guests dominate the Munxar STR market, accounting for 55.8% of listings.
- 32.4% of properties accommodate 6+ guests, serving the market segment for larger families or group travel in Munxar.
- On average, properties in Munxar are equipped to host 4.6 guests.
Munxar Airbnb Booking Patterns (2026): Available vs. Booked Days
Available Days Distribution
Booked Days Distribution
Booking Pattern Insights for Munxar
- The most common availability pattern in Munxar falls within the 181-270 days range, representing 41.4% of listings. This suggests many properties have significant open periods on their calendars.
- Approximately 77.4% of listings show high availability (181+ days open annually), indicating potential for increased bookings or specific owner usage patterns.
- For booked days, the 91-180 days range is most frequent in Munxar (39.6%), reflecting common guest stay durations or potential owner blocking patterns.
- A notable 24.3% of properties secure long booking periods (181+ days booked per year), highlighting successful long-term rental strategies or significant owner usage.
Munxar Airbnb Minimum Stay Requirements Analysis
Distribution of Listings by Minimum Night Requirement
1 Night
11 listings
9.9% of total
2 Nights
20 listings
18% of total
3 Nights
12 listings
10.8% of total
4-6 Nights
18 listings
16.2% of total
7-29 Nights
1 listings
0.9% of total
30+ Nights
49 listings
44.1% of total
Key Insights
- The most prevalent minimum stay requirement in Munxar is 30+ Nights, adopted by 44.1% of listings. This highlights the market's preference for longer commitments.
- A significant segment (44.1%) caters to monthly stays (30+ nights) in Munxar, pointing to opportunities in the extended-stay market.
Recommendations
- Align with the market by considering a 30+ Nights minimum stay, as 44.1% of Munxar hosts use this setting.
- If feasible, allowing 1-night stays, especially midweek or during low season, could capture last-minute bookings, as only 9.9% currently do.
- Explore offering discounts for stays of 30+ nights to attract the 44.1% of the market seeking extended stays.
- Adjust minimum nights based on seasonality – potentially shorter during low season and longer during peak demand periods in Munxar.
Munxar Airbnb Cancellation Policy Trends Analysis (2026)
Limited
4 listings
3.6% of total
Super Strict 30 Days
2 listings
1.8% of total
Flexible
12 listings
10.8% of total
Moderate
28 listings
25.2% of total
Firm
57 listings
51.4% of total
Strict
8 listings
7.2% of total
Cancellation Policy Insights for Munxar
- The prevailing Airbnb cancellation policy trend in Munxar is Firm, used by 51.4% of listings.
- A majority (58.6%) of hosts in Munxar utilize Firm or Strict policies, indicating a market where hosts prioritize booking security.
- Strict cancellation policies are quite rare (7.2%), potentially making listings with this policy less competitive unless justified by high demand or property type.
Recommendations for Hosts
- Consider adopting a Firm policy to align with the 51.4% market standard in Munxar.
- Using a Strict policy might deter some guests, as only 7.2% of listings use it. Evaluate if potential revenue protection outweighs possible lower booking rates.
- Regularly review your cancellation policy against competitors and market demand shifts in Munxar.
Munxar STR Booking Lead Time Analysis (2026)
Average Booking Lead Time by Month
Booking Lead Time Insights for Munxar
- The overall average booking lead time for vacation rentals in Munxar is 64 days.
- Guests book furthest in advance for stays during August (average 90 days), likely coinciding with peak travel demand or local events.
- The shortest booking windows occur for stays in January (average 33 days), indicating more last-minute travel plans during this time.
- Seasonally, Summer (81 days avg.) sees the longest lead times, while Winter (42 days avg.) has the shortest, reflecting typical travel planning cycles.
Recommendations for Hosts
- Use the overall average lead time (64 days) as a baseline for your pricing and availability strategy in Munxar.
- For August stays, consider implementing length-of-stay discounts or slightly higher rates for bookings made less than 90 days out to capitalize on advance planning.
- Target marketing efforts for the Summer season well in advance (at least 81 days) to capture early planners.
- Monitor your own booking lead times against these Munxar averages to identify opportunities for dynamic pricing adjustments.
Popular & Essential Airbnb Amenities in Munxar (2026)
Amenity Prevalence
Amenity Insights for Munxar
- Essential amenities in Munxar that guests expect include: Wifi, Kitchen. Lacking these (any) could significantly impact bookings.
- Popular amenities like Air conditioning, TV, Dishes and silverware are common but not universal. Offering these can provide a competitive edge.
Recommendations for Hosts
- Ensure your listing includes all essential amenities for Munxar: Wifi, Kitchen.
- Prioritize adding missing essentials: Wifi, Kitchen.
- Consider adding popular differentiators like Air conditioning or TV to increase appeal.
- Highlight unique or less common amenities you offer (e.g., hot tub, dedicated workspace, EV charger) in your listing description and photos.
- Regularly check competitor amenities in Munxar to stay competitive.
Munxar Airbnb Guest Demographics & Profile Analysis (2026)
Guest Profile Summary for Munxar
- The typical guest profile for Airbnb in Munxar consists of predominantly international visitors (94%), with top international origins including Germany, typically belonging to the Post-2000s (Gen Z/Alpha) group (50%), primarily speaking English or French.
- Domestic travelers account for 6.5% of guests.
- Key international markets include United Kingdom (27.1%) and Germany (10.3%).
- Top languages spoken are English (45.6%) followed by French (10.5%).
- A significant demographic segment is the Post-2000s (Gen Z/Alpha) group, representing 50% of guests.
Recommendations for Hosts
- Focus marketing internationally, particularly towards travelers from Germany.
- Tailor amenities and listing descriptions to appeal to the dominant Post-2000s (Gen Z/Alpha) demographic (e.g., highlight fast WiFi, smart home features, local guides).
- Highlight unique local experiences or amenities relevant to the primary guest profile.
- Consider seasonal promotions aligned with peak travel times for key origin markets.
Nearby Short-Term Rental Market Comparison
How does the Munxar Airbnb market stack up against its neighbors? Compare key performance metrics like average monthly revenue, ADR, and occupancy rates in surrounding areas to understand the broader regional STR landscape.
| Market | Active Properties | Monthly Revenue | Daily Rate | Avg. Occupancy |
|---|---|---|---|---|
| Mdina | 16 | $3,124 | $218.25 | 57% |
| Taormina | 1,004 | $2,744 | $247.48 | 48% |
| Valletta | 604 | $2,598 | $187.70 | 53% |
| Mellieħa | 455 | $2,387 | $181.28 | 51% |
| Trecastagni | 57 | $2,356 | $307.87 | 34% |
| Senglea | 106 | $2,216 | $142.33 | 60% |
| Żejtun | 44 | $2,210 | $189.49 | 45% |
| Santa Venerina | 52 | $2,153 | $278.18 | 41% |
| Birgu | 108 | $2,141 | $156.24 | 57% |
| Graniti | 20 | $2,139 | $177.04 | 47% |