Kuala Terengganu Airbnb Market Analysis 2026: Short Term Rental Data & Vacation Rental Statistics in Terengganu, Malaysia
Is Airbnb profitable in Kuala Terengganu in 2026? Explore comprehensive Airbnb analytics for Kuala Terengganu, Terengganu, Malaysia to uncover income potential. This 2026 STR market report for Kuala Terengganu, based on AirROI data from February 2025 to January 2026, reveals key trends in the market of 366 active listings.
Whether you're considering an Airbnb investment in Kuala Terengganu, optimizing your existing vacation rental, or exploring rental arbitrage opportunities, understanding the Kuala Terengganu Airbnb data is crucial. Leveraging the low regulation environment is key to maximizing your short term rental income potential. Let's dive into the specifics.
Key Kuala Terengganu Airbnb Performance Metrics Overview
Monthly Airbnb Revenue Variations & Income Potential in Kuala Terengganu (2026)
Understanding the monthly revenue variations for Airbnb listings in Kuala Terengganu is key to maximizing your short term rental income potential. Seasonality significantly impacts earnings. Our analysis, based on data from the past 12 months, shows that the peak revenue month for STRs in Kuala Terengganu is typically September, while March often presents the lowest earnings, highlighting opportunities for strategic pricing adjustments during shoulder and low seasons. Explore the typical Airbnb income in Kuala Terengganu across different performance tiers:
- Best-in-class properties (Top 10%) achieve $1,077+ monthly, often utilizing dynamic pricing and superior guest experiences.
- Strong performing properties (Top 25%) earn $641 or more, indicating effective management and desirable locations/amenities.
- Typical properties (Median) generate around $330 per month, representing the average market performance.
- Entry-level properties (Bottom 25%) see earnings around $160, often with potential for optimization.
Average Monthly Airbnb Earnings Trend in Kuala Terengganu
Kuala Terengganu Airbnb Occupancy Rate Trends (2026)
Maximize your bookings by understanding the Kuala Terengganu STR occupancy trends. Seasonal demand shifts significantly influence how often properties are booked. Typically, Septembersees the highest demand (peak season occupancy), while March experiences the lowest (low season). Effective strategies, like adjusting minimum stays or offering promotions, can boost occupancy during slower periods. Here's how different property tiers perform in Kuala Terengganu:
- Best-in-class properties (Top 10%) achieve 45%+ occupancy, indicating high desirability and potentially optimized availability.
- Strong performing properties (Top 25%) maintain 31% or higher occupancy, suggesting good market fit and guest satisfaction.
- Typical properties (Median) have an occupancy rate around 18%.
- Entry-level properties (Bottom 25%) average 9% occupancy, potentially facing higher vacancy.
Average Monthly Occupancy Rate Trend in Kuala Terengganu
Average Daily Rate (ADR) Airbnb Trends in Kuala Terengganu (2026)
Effective short term rental pricing strategy in Kuala Terengganu involves understanding monthly ADR fluctuations. The Average Daily Rate (ADR) for Airbnb in Kuala Terengganu typically peaks in December and dips lowest during March. Leveraging Airbnb dynamic pricing tools or strategies based on this seasonality can significantly boost revenue. Here's a look at the typical nightly rates achieved:
- Best-in-class properties (Top 10%) command rates of $107+ per night, often due to premium features or locations.
- Strong performing properties (Top 25%) achieve nightly rates of $80 or more.
- Typical properties (Median) charge around $58 per night.
- Entry-level properties (Bottom 25%) earn around $42 per night.
Average Daily Rate (ADR) Trend by Month in Kuala Terengganu
Get Live Kuala Terengganu Market Intelligence 👇

Explore Real-time Analytics
Airbnb Seasonality Analysis & Trends in Kuala Terengganu (2026)
Peak Season (September, October, August)
- Revenue averages $651 per month
- Occupancy rates average 27.9%
- Daily rates average $74
Shoulder Season
- Revenue averages $507 per month
- Occupancy maintains around 22.4%
- Daily rates hold near $70
Low Season (January, March, November)
- Revenue drops to average $370 per month
- Occupancy decreases to average 16.8%
- Daily rates adjust to average $73
Seasonality Insights for Kuala Terengganu
- The Airbnb seasonality in Kuala Terengganu shows highly seasonal trends requiring careful strategy. While the sections above show seasonal averages, it's also insightful to look at the extremes:
- During the high season, the absolute peak month showcases Kuala Terengganu's highest earning potential, with monthly revenues capable of climbing to $779, occupancy reaching a high of 34.8%, and ADRs peaking at $76.
- Conversely, the slowest single month of the year, typically falling within the low season, marks the market's lowest point. In this month, revenue might dip to $307, occupancy could drop to 14.1%, and ADRs may adjust down to $68.
- Understanding both the seasonal averages and these monthly peaks and troughs in revenue, occupancy, and ADR is crucial for maximizing your Airbnb profit potential in Kuala Terengganu.
Seasonal Strategies for Maximizing Profit
- Peak Season: Maximize revenue through premium pricing and potentially longer minimum stays. Ensure high availability.
- Low Season: Offer competitive pricing, special promotions (e.g., extended stay discounts), and flexible cancellation policies. Target off-season travelers like remote workers or budget-conscious guests.
- Shoulder Seasons: Implement dynamic pricing that balances peak and low rates. Target weekend travelers or specific events. Offer slightly more flexible terms than peak season.
- Regularly analyze your own performance against these Kuala Terengganu seasonality benchmarks and adjust your pricing and availability strategy accordingly.
Best Areas for Airbnb Investment in Kuala Terengganu (2026)
Exploring the top neighborhoods for short-term rentals in Kuala Terengganu? This section highlights key areas, outlining why they are attractive for hosts and guests, along with notable local attractions. Consider these locations based on your target guest profile and investment strategy.
| Neighborhood / Area | Why Host Here? (Target Guests & Appeal) | Key Attractions & Landmarks |
|---|---|---|
| Kuala Terengganu City Center | The bustling center of Kuala Terengganu with easy access to shopping, dining, and cultural attractions. Perfect for both business and leisure travelers. | Pasar Payang, Tengku Tengah Zaharah Mosque, Kuala Terengganu Waterfront, Bukit Puteri, Terengganu State Museum |
| Batu Buruk Beach | A popular local beach destination with stunning views and water sports. Ideal for tourists looking to relax by the sea and enjoy the sun. | Batu Buruk Beach, Kuala Terengganu Beach, Turtle Sanctuary, The Beachfront Cafes, Beach Sports |
| Pulau Redang | Famous for its beautiful beaches and coral reefs, it's a hotspot for snorkeling and diving. Great for attracting nature lovers and beachgoers. | Redang Island Beach, Marine Park, Snorkeling Tours, Crystal Clear Waters, Diving Spots |
| Pulau Lang Tengah | Another beautiful island destination with fewer crowds, attracting tourists seeking tranquility and unspoiled nature. Ideal for eco tourism. | Long Beach, Coral reefs, Turtle Watching, Island Hopping, Camping Sites |
| Chinatown | Rich in history and culture, this area appeals to travelers interested in heritage, great food, and local markets. Perfect for cultural immersion. | Heritage Architecture, Local Markets, Food Stalls, Street Art, Chinese Temples |
| Kampung Cina (Chinese Village) | A rich cultural area showcasing the heritage of the Chinese community in Terengganu. Interesting for tourists wanting a unique cultural experience. | Cultural Heritage, Clan Houses, Chinese New Year Festivities, Local Cuisine, Craft Items |
| Taman Negara | A natural attraction offering lush rainforests and wildlife experiences. Appeals to adventure seekers and eco-tourists looking for hiking and exploration. | Rainforest Trails, Wildlife Watching, Eco Tours, Canopy Walkway, River Cruises |
| Terengganu State Museum | The largest museum in Malaysia showcasing Terengganu's rich history and culture. A must-visit for history buffs and educational travelers. | Cultural Exhibitions, Historical Artefacts, Art Galleries, Science Centre, Heritage Center |
Understanding Airbnb License Requirements & STR Laws in Kuala Terengganu (2026)
While Kuala Terengganu, Terengganu, Malaysia currently shows low STR regulations, specific Airbnb license requirements might still exist or change. Always verify the latest short term rental regulations and Airbnb license requirements directly with local government authorities for Kuala Terengganu to ensure full compliance before hosting.
(Source: AirROI data, 2026, based on 0% licensed listings)
Top Performing Airbnb Properties in Kuala Terengganu (2026)
Benchmark your potential! Explore examples of top-performing Airbnb properties in Kuala Terengganubased on Trailing Twelve Month (TTM) revenue. Analyze their characteristics, revenue, occupancy rate, and ADR to understand what drives success in this market.

Stylish 4B Suite With Pool
Entire Place • 4 bedrooms
Villapadu Bayu- villa by the beach in city
Entire Place • 6 bedrooms
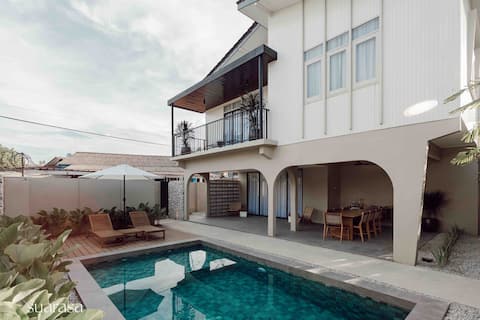
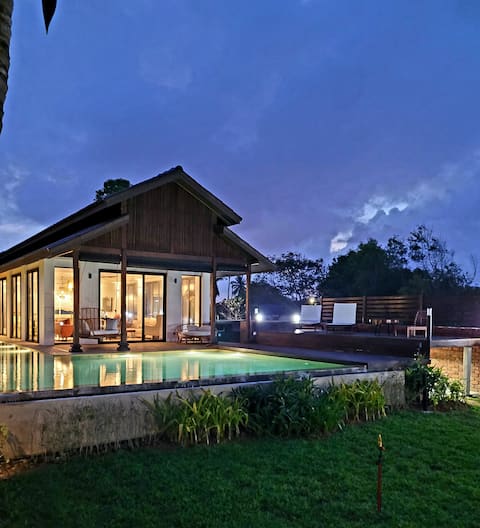
Suarasa Villa 1 - Private Pool
Entire Place • 6 bedrooms
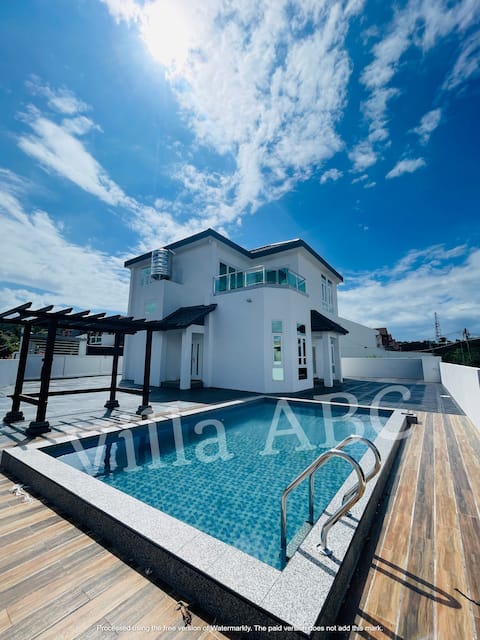
Villa ABC - Breathable OceanView
Entire Place • 4 bedrooms

Blumeen Villa 1 - Amazing Pool
Entire Place • 4 bedrooms

Edani's River Cottage
Entire Place • 6 bedrooms
Note: Performance varies based on location, size, amenities, seasonality, and management quality. Data reflects the past 12 months.
Top Performing Airbnb Hosts in Kuala Terengganu (2026)
Learn from the best! This table showcases top-performing Airbnb hosts in Kuala Terengganu based on the number of properties managed and estimated total revenue over the past year. Analyze their scale and performance metrics.
| Host Name | Properties | Grossing Revenue | Stay Reviews | Avg Rating |
|---|---|---|---|---|
| Nuzul Aiman | 7 | $75,240 | 276 | 4.80/5.0 |
| Shamsul | 7 | $74,824 | 570 | 4.74/5.0 |
| Zulhisham | 3 | $62,871 | 13 | 4.93/5.0 |
| Wan Muhammad Afiq | 1 | $44,225 | 29 | 5.00/5.0 |
| Afiq | 2 | $42,091 | 91 | 4.89/5.0 |
| ShuitHuei | 1 | $31,122 | 4 | 5.00/5.0 |
| Norul | 5 | $29,276 | 97 | 4.97/5.0 |
| Kak Chik | 5 | $29,247 | 50 | 4.94/5.0 |
| Mohd Noor | 2 | $28,142 | 53 | 4.79/5.0 |
| Aimi Amirah | 2 | $23,382 | 228 | 4.97/5.0 |
Analyzing the strategies of top hosts, such as their property selection, pricing, and guest communication, can offer valuable lessons for optimizing your own Airbnb operations in Kuala Terengganu.
Dive Deeper: Advanced Kuala Terengganu STR Market Data (2026)
Ready to unlock more insights? AirROI provides access to advanced metrics and comprehensive Airbnb data for Kuala Terengganu. Explore detailed analytics beyond this report to refine your investment strategy, optimize pricing, and maximize your vacation rental profits.
Explore Advanced MetricsKuala Terengganu Short-Term Rental Market Composition (2026): Property & Room Types
Room Type Distribution
Property Type Distribution
Market Composition Insights for Kuala Terengganu
- The Kuala Terengganu Airbnb market composition is heavily skewed towards Entire Home/Apt listings, which make up 80.9% of the 366 active rentals. This indicates strong guest preference for privacy and space.
- Looking at the property type distribution in Kuala Terengganu, House properties are the most common (45.6%), reflecting the local real estate landscape.
- Houses represent a significant 45.6% portion, catering likely to families or larger groups.
- The presence of 14.5% Hotel/Boutique listings indicates integration with traditional hospitality.
- Smaller segments like others, outdoor/unique, unique stays (combined 2.7%) offer potential for unique stay experiences.
Kuala Terengganu Airbnb Room Capacity Analysis (2026): Bedroom Distribution
Distribution of Listings by Number of Bedrooms
Room Capacity Insights for Kuala Terengganu
- The dominant room capacity in Kuala Terengganu is 3 bedrooms listings, making up 46.4% of the market. This suggests a strong demand for properties suitable for families or small groups.
- Together, 3 bedrooms and 1 bedroom properties represent 64.2% of the active Airbnb listings in Kuala Terengganu, indicating a high concentration in these sizes.
- A significant 69.3% of listings offer 3+ bedrooms, catering to larger groups and families seeking more space in Kuala Terengganu.
Kuala Terengganu Vacation Rental Guest Capacity Trends (2026)
Distribution of Listings by Guest Capacity
Guest Capacity Insights for Kuala Terengganu
- The most common guest capacity trend in Kuala Terengganu vacation rentals is listings accommodating 8+ guests (43.4%). This suggests the primary traveler segment is likely larger groups.
- Properties designed for 8+ guests and 6 guests dominate the Kuala Terengganu STR market, accounting for 62.0% of listings.
- 71.0% of properties accommodate 6+ guests, serving the market segment for larger families or group travel in Kuala Terengganu.
- On average, properties in Kuala Terengganu are equipped to host 6.1 guests.
Kuala Terengganu Airbnb Booking Patterns (2026): Available vs. Booked Days
Available Days Distribution
Booked Days Distribution
Booking Pattern Insights for Kuala Terengganu
- The most common availability pattern in Kuala Terengganu falls within the 271-366 days range, representing 81.7% of listings. This suggests many properties have significant open periods on their calendars.
- Approximately 98.1% of listings show high availability (181+ days open annually), indicating potential for increased bookings or specific owner usage patterns.
- For booked days, the 31-90 days range is most frequent in Kuala Terengganu (44.3%), reflecting common guest stay durations or potential owner blocking patterns.
- A notable 2.2% of properties secure long booking periods (181+ days booked per year), highlighting successful long-term rental strategies or significant owner usage.
Kuala Terengganu Airbnb Minimum Stay Requirements Analysis
Distribution of Listings by Minimum Night Requirement
1 Night
329 listings
89.9% of total
2 Nights
18 listings
4.9% of total
3 Nights
1 listings
0.3% of total
4-6 Nights
1 listings
0.3% of total
30+ Nights
17 listings
4.6% of total
Key Insights
- The most prevalent minimum stay requirement in Kuala Terengganu is 1 Night, adopted by 89.9% of listings. This highlights the market's preference for shorter, flexible bookings.
- A strong majority (94.8%) of the Kuala Terengganu Airbnb data shows acceptance of very short stays (1-2 nights), indicating a dynamic, high-turnover market.
Recommendations
- Align with the market by considering a 1 Night minimum stay, as 89.9% of Kuala Terengganu hosts use this setting.
- Adjust minimum nights based on seasonality – potentially shorter during low season and longer during peak demand periods in Kuala Terengganu.
Kuala Terengganu Airbnb Cancellation Policy Trends Analysis (2026)
Super Strict 30 Days
1 listings
0.3% of total
Limited
2 listings
0.5% of total
Flexible
187 listings
51.2% of total
Moderate
101 listings
27.7% of total
Firm
51 listings
14% of total
Strict
23 listings
6.3% of total
Cancellation Policy Insights for Kuala Terengganu
- The prevailing Airbnb cancellation policy trend in Kuala Terengganu is Flexible, used by 51.2% of listings.
- The market strongly favors guest-friendly terms, with 78.9% of listings offering Flexible or Moderate policies. This suggests guests in Kuala Terengganu may expect booking flexibility.
- Strict cancellation policies are quite rare (6.3%), potentially making listings with this policy less competitive unless justified by high demand or property type.
Recommendations for Hosts
- Consider adopting a Flexible policy to align with the 51.2% market standard in Kuala Terengganu.
- Given the high prevalence of Flexible policies (51.2%), offering this can enhance booking appeal, especially during shoulder seasons.
- Using a Strict policy might deter some guests, as only 6.3% of listings use it. Evaluate if potential revenue protection outweighs possible lower booking rates.
- Regularly review your cancellation policy against competitors and market demand shifts in Kuala Terengganu.
Kuala Terengganu STR Booking Lead Time Analysis (2026)
Average Booking Lead Time by Month
Booking Lead Time Insights for Kuala Terengganu
- The overall average booking lead time for vacation rentals in Kuala Terengganu is 33 days.
- Guests book furthest in advance for stays during August (average 70 days), likely coinciding with peak travel demand or local events.
- The shortest booking windows occur for stays in February (average 19 days), indicating more last-minute travel plans during this time.
- Seasonally, Summer (38 days avg.) sees the longest lead times, while Winter (21 days avg.) has the shortest, reflecting typical travel planning cycles.
Recommendations for Hosts
- Use the overall average lead time (33 days) as a baseline for your pricing and availability strategy in Kuala Terengganu.
- For August stays, consider implementing length-of-stay discounts or slightly higher rates for bookings made less than 70 days out to capitalize on advance planning.
- Target marketing efforts for the Summer season well in advance (at least 38 days) to capture early planners.
- Monitor your own booking lead times against these Kuala Terengganu averages to identify opportunities for dynamic pricing adjustments.
Popular & Essential Airbnb Amenities in Kuala Terengganu (2026)
Amenity Prevalence
Amenity Insights for Kuala Terengganu
- Essential amenities in Kuala Terengganu that guests expect include: Air conditioning. Lacking these (this) could significantly impact bookings.
- Popular amenities like Free parking on premises, TV, Iron are common but not universal. Offering these can provide a competitive edge.
- Warning: Wifi is not universally provided but is considered essential globally. Ensure reliable Wifi is offered.
Recommendations for Hosts
- Ensure your listing includes all essential amenities for Kuala Terengganu: Air conditioning.
- Prioritize adding missing essentials: Air conditioning.
- Consider adding popular differentiators like Free parking on premises or TV to increase appeal.
- Highlight unique or less common amenities you offer (e.g., hot tub, dedicated workspace, EV charger) in your listing description and photos.
- Regularly check competitor amenities in Kuala Terengganu to stay competitive.
Kuala Terengganu Airbnb Guest Demographics & Profile Analysis (2026)
Guest Profile Summary for Kuala Terengganu
- The typical guest profile for Airbnb in Kuala Terengganu consists of primarily domestic travelers (82%), often arriving from nearby Kuala Lumpur, typically belonging to the Post-2000s (Gen Z/Alpha) group (50%), primarily speaking English or Malay.
- Domestic travelers account for 82.2% of guests.
- Key international markets include Malaysia (82.2%) and France (4.6%).
- Top languages spoken are English (46.3%) followed by Malay (37.9%).
- A significant demographic segment is the Post-2000s (Gen Z/Alpha) group, representing 50% of guests.
Recommendations for Hosts
- Target domestic marketing efforts towards travelers from Kuala Lumpur and Selangor.
- Tailor amenities and listing descriptions to appeal to the dominant Post-2000s (Gen Z/Alpha) demographic (e.g., highlight fast WiFi, smart home features, local guides).
- Highlight unique local experiences or amenities relevant to the primary guest profile.
- Consider seasonal promotions aligned with peak travel times for key origin markets.
Nearby Short-Term Rental Market Comparison
How does the Kuala Terengganu Airbnb market stack up against its neighbors? Compare key performance metrics like average monthly revenue, ADR, and occupancy rates in surrounding areas to understand the broader regional STR landscape.
| Market | Active Properties | Monthly Revenue | Daily Rate | Avg. Occupancy |
|---|---|---|---|---|
| Pulau Perhentian Kecil | 10 | $1,354 | $101.42 | 60% |
| Kampung Rhu Muda | 10 | $719 | $75.08 | 32% |
| Besut | 10 | $615 | $100.83 | 45% |
| Kampung Seberang Takir Hulu | 12 | $521 | $65.59 | 25% |
| Gong Dato | 16 | $462 | $84.39 | 31% |
| Kampung Tanjung Angsa | 26 | $392 | $143.77 | 24% |
| Kampung Air Leleh | 19 | $350 | $69.30 | 21% |
| Kampung Seberang Takir | 17 | $307 | $65.80 | 22% |
| Chukai | 52 | $284 | $58.59 | 21% |
| Dungun | 82 | $273 | $61.79 | 19% |