Shah Alam Airbnb Market Analysis 2026: Short Term Rental Data & Vacation Rental Statistics in Selangor, Malaysia
Is Airbnb profitable in Shah Alam in 2026? Explore comprehensive Airbnb analytics for Shah Alam, Selangor, Malaysia to uncover income potential. This 2026 STR market report for Shah Alam, based on AirROI data from February 2025 to January 2026, reveals key trends in the bustling market of 1,578 active listings.
Whether you're considering an Airbnb investment in Shah Alam, optimizing your existing vacation rental, or exploring rental arbitrage opportunities, understanding the Shah Alam Airbnb data is crucial. Leveraging the low regulation environment is key to maximizing your short term rental income potential. Let's dive into the specifics.
Key Shah Alam Airbnb Performance Metrics Overview
Monthly Airbnb Revenue Variations & Income Potential in Shah Alam (2026)
Understanding the monthly revenue variations for Airbnb listings in Shah Alam is key to maximizing your short term rental income potential. Seasonality significantly impacts earnings. Our analysis, based on data from the past 12 months, shows that the peak revenue month for STRs in Shah Alam is typically December, while April often presents the lowest earnings, highlighting opportunities for strategic pricing adjustments during shoulder and low seasons. Explore the typical Airbnb income in Shah Alam across different performance tiers:
- Best-in-class properties (Top 10%) achieve $888+ monthly, often utilizing dynamic pricing and superior guest experiences.
- Strong performing properties (Top 25%) earn $542 or more, indicating effective management and desirable locations/amenities.
- Typical properties (Median) generate around $285 per month, representing the average market performance.
- Entry-level properties (Bottom 25%) see earnings around $132, often with potential for optimization.
Average Monthly Airbnb Earnings Trend in Shah Alam
Shah Alam Airbnb Occupancy Rate Trends (2026)
Maximize your bookings by understanding the Shah Alam STR occupancy trends. Seasonal demand shifts significantly influence how often properties are booked. Typically, Septembersees the highest demand (peak season occupancy), while January experiences the lowest (low season). Effective strategies, like adjusting minimum stays or offering promotions, can boost occupancy during slower periods. Here's how different property tiers perform in Shah Alam:
- Best-in-class properties (Top 10%) achieve 59%+ occupancy, indicating high desirability and potentially optimized availability.
- Strong performing properties (Top 25%) maintain 39% or higher occupancy, suggesting good market fit and guest satisfaction.
- Typical properties (Median) have an occupancy rate around 22%.
- Entry-level properties (Bottom 25%) average 11% occupancy, potentially facing higher vacancy.
Average Monthly Occupancy Rate Trend in Shah Alam
Average Daily Rate (ADR) Airbnb Trends in Shah Alam (2026)
Effective short term rental pricing strategy in Shah Alam involves understanding monthly ADR fluctuations. The Average Daily Rate (ADR) for Airbnb in Shah Alam typically peaks in December and dips lowest during April. Leveraging Airbnb dynamic pricing tools or strategies based on this seasonality can significantly boost revenue. Here's a look at the typical nightly rates achieved:
- Best-in-class properties (Top 10%) command rates of $82+ per night, often due to premium features or locations.
- Strong performing properties (Top 25%) achieve nightly rates of $56 or more.
- Typical properties (Median) charge around $40 per night.
- Entry-level properties (Bottom 25%) earn around $30 per night.
Average Daily Rate (ADR) Trend by Month in Shah Alam
Get Live Shah Alam Market Intelligence 👇

Explore Real-time Analytics
Airbnb Seasonality Analysis & Trends in Shah Alam (2026)
Peak Season (December, September, August)
- Revenue averages $513 per month
- Occupancy rates average 32.0%
- Daily rates average $54
Shoulder Season
- Revenue averages $416 per month
- Occupancy maintains around 27.2%
- Daily rates hold near $53
Low Season (January, March, April)
- Revenue drops to average $358 per month
- Occupancy decreases to average 23.8%
- Daily rates adjust to average $52
Seasonality Insights for Shah Alam
- The Airbnb seasonality in Shah Alam shows moderate seasonality with distinct peak and low periods. While the sections above show seasonal averages, it's also insightful to look at the extremes:
- During the high season, the absolute peak month showcases Shah Alam's highest earning potential, with monthly revenues capable of climbing to $569, occupancy reaching a high of 34.1%, and ADRs peaking at $56.
- Conversely, the slowest single month of the year, typically falling within the low season, marks the market's lowest point. In this month, revenue might dip to $346, occupancy could drop to 23.6%, and ADRs may adjust down to $51.
- Understanding both the seasonal averages and these monthly peaks and troughs in revenue, occupancy, and ADR is crucial for maximizing your Airbnb profit potential in Shah Alam.
Seasonal Strategies for Maximizing Profit
- Peak Season: Maximize revenue through premium pricing and potentially longer minimum stays. Ensure high availability.
- Low Season: Offer competitive pricing, special promotions (e.g., extended stay discounts), and flexible cancellation policies. Target off-season travelers like remote workers or budget-conscious guests.
- Shoulder Seasons: Implement dynamic pricing that balances peak and low rates. Target weekend travelers or specific events. Offer slightly more flexible terms than peak season.
- Regularly analyze your own performance against these Shah Alam seasonality benchmarks and adjust your pricing and availability strategy accordingly.
Best Areas for Airbnb Investment in Shah Alam (2026)
Exploring the top neighborhoods for short-term rentals in Shah Alam? This section highlights key areas, outlining why they are attractive for hosts and guests, along with notable local attractions. Consider these locations based on your target guest profile and investment strategy.
| Neighborhood / Area | Why Host Here? (Target Guests & Appeal) | Key Attractions & Landmarks |
|---|---|---|
| Seksyen 7 | A popular residential area with proximity to educational institutions, making it ideal for students and families. It is well-connected and offers a vibrant community feel. | Shah Alam Lake Gardens, SACC Mall, UiTM Shah Alam, Jalan Persiaran Akuatik, Shah Alam Convention Centre |
| Seksyen 9 | Home to the prestigious Shah Alam Stadium and various parks, this area attracts sports enthusiasts and families looking for recreational activities. | Shah Alam Stadium, Malawati Stadium, Taman Botani Negara Shah Alam, Shah Alam Golf Club, Pawana Park |
| Seksyen 13 | Strategically located near major highways and the city center, this area is ideal for business travelers and those seeking convenience. | Generali Malaysia, Plaza Shah Alam, MSU College, Shah Alam Specialist Medical Centre, Raja Tun Uda Library |
| Bukit Jelutong | A well-planned township with a mix of residential and commercial properties, favored by families and professionals for its ambiance and facilities. | Bukit Jelutong Equestrian Club, Sungai Buloh Forest Reserve, Guthrie Corridor Expressway, Shah Alam International Turf Club, Setia City Mall |
| Setia Alam | Known for its modern developments and community living, Setia Alam appeals to younger families and expats looking for a suburban lifestyle within reach of amenities. | Setia City Mall, Wet World Water Park Shah Alam, Setia Alam Community Park, Setia Eco Park, D'Pulze Shopping Centre |
| Seksyen 25 | An emerging area with new residential developments and proximity to the North-South Expressway, attracting more long-stay guests. | Taman Lembah Bukit Permai, Shah Alam Industrial Park, Kota Kemuning Lake, Jaya33, Citta Mall |
| Kota Kemuning | Offering a mix of residential and commercial spaces with good amenities, this area is popular with families and young professionals. | Kota Kemuning Golf and Country Resort, Kota Kemuning Wetlands, Summit USJ, MBO Kota Kemuning, Kota Kemuning's Night Market |
| Padang Jawa | A growing area with more affordable housing options, making it attractive for budget travelers and those new to Shah Alam. | Padang Jawa Lake, Temenggong Ibrahim Park, SP Plaza, Sunway Pyramid, Sungai Buloh Hospital |
Understanding Airbnb License Requirements & STR Laws in Shah Alam (2026)
While Shah Alam, Selangor, Malaysia currently shows low STR regulations, specific Airbnb license requirements might still exist or change. Always verify the latest short term rental regulations and Airbnb license requirements directly with local government authorities for Shah Alam to ensure full compliance before hosting.
(Source: AirROI data, 2026, based on 1% licensed listings)
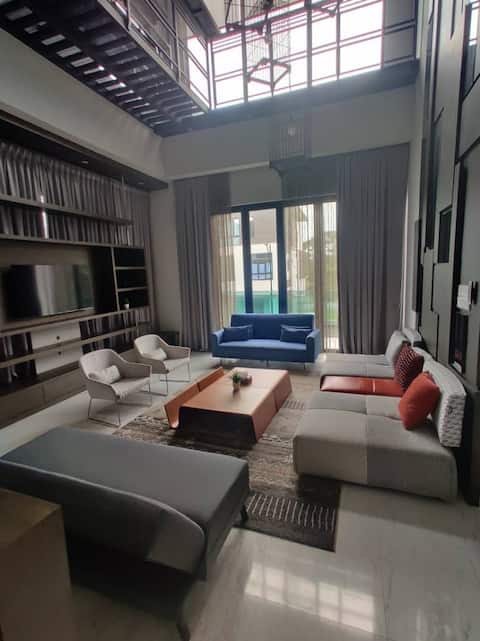
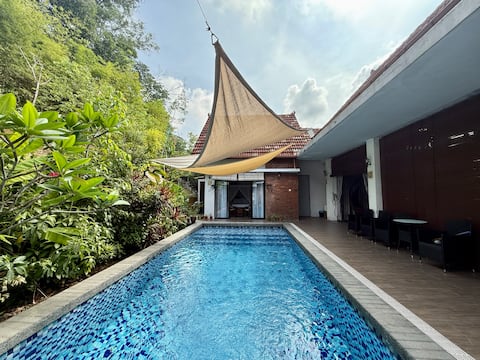
Top Performing Airbnb Properties in Shah Alam (2026)
Benchmark your potential! Explore examples of top-performing Airbnb properties in Shah Alambased on Trailing Twelve Month (TTM) revenue. Analyze their characteristics, revenue, occupancy rate, and ADR to understand what drives success in this market.

Luxury Villa Monterez Club Golf, Shah Alam
Entire Place • 8 bedrooms
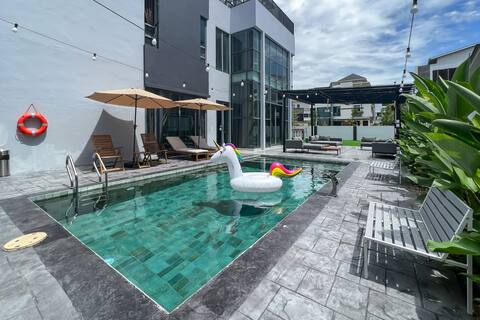
Villa 26 Pax. Pool | BBQ | Cinema
Entire Place • 7 bedrooms

Nordic685 @ Sg Buloh
Entire Place • 5 bedrooms
Bungalow/team building/Golf Club
Entire Place • 7 bedrooms
Villa Karangsari by Mana Suites.
Entire Place • 5 bedrooms
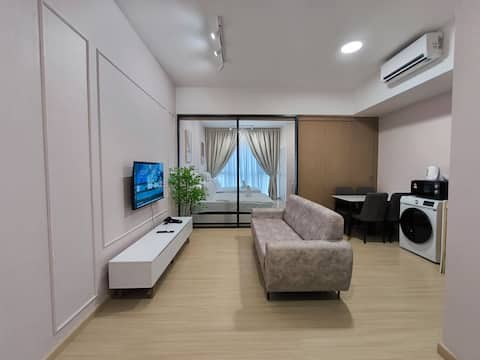
Dsara Studio 4 Pax | MRT | Selamat Village
Entire Place • N/A
Note: Performance varies based on location, size, amenities, seasonality, and management quality. Data reflects the past 12 months.
Top Performing Airbnb Hosts in Shah Alam (2026)
Learn from the best! This table showcases top-performing Airbnb hosts in Shah Alam based on the number of properties managed and estimated total revenue over the past year. Analyze their scale and performance metrics.
| Host Name | Properties | Grossing Revenue | Stay Reviews | Avg Rating |
|---|---|---|---|---|
| SmartHome | 123 | $512,696 | 14188 | 4.66/5.0 |
| INNfinity | 39 | $177,016 | 3416 | 4.77/5.0 |
| Yeap | 30 | $148,647 | 2215 | 4.89/5.0 |
| I-City Shah Alam By ASDEH Suit | 53 | $105,995 | 679 | 4.27/5.0 |
| Meta Suite | 23 | $90,813 | 832 | 4.59/5.0 |
| My Trip & My Stay 我行我宿 | 16 | $87,099 | 764 | 4.71/5.0 |
| Joey | 10 | $85,832 | 59 | 4.95/5.0 |
| Dylan | 4 | $82,838 | 125 | 4.89/5.0 |
| KellyLaw | 14 | $72,635 | 285 | 4.73/5.0 |
| Sam | 26 | $69,760 | 341 | 4.88/5.0 |
Analyzing the strategies of top hosts, such as their property selection, pricing, and guest communication, can offer valuable lessons for optimizing your own Airbnb operations in Shah Alam.
Dive Deeper: Advanced Shah Alam STR Market Data (2026)
Ready to unlock more insights? AirROI provides access to advanced metrics and comprehensive Airbnb data for Shah Alam. Explore detailed analytics beyond this report to refine your investment strategy, optimize pricing, and maximize your vacation rental profits.
Explore Advanced MetricsShah Alam Short-Term Rental Market Composition (2026): Property & Room Types
Room Type Distribution
Property Type Distribution
Market Composition Insights for Shah Alam
- The Shah Alam Airbnb market composition is heavily skewed towards Entire Home/Apt listings, which make up 97.5% of the 1,578 active rentals. This indicates strong guest preference for privacy and space.
- Looking at the property type distribution in Shah Alam, Apartment/Condo properties are the most common (88.8%), reflecting the local real estate landscape.
- Smaller segments like hotel/boutique, outdoor/unique, unique stays (combined 0.6%) offer potential for unique stay experiences.
Shah Alam Airbnb Room Capacity Analysis (2026): Bedroom Distribution
Distribution of Listings by Number of Bedrooms
Room Capacity Insights for Shah Alam
- The dominant room capacity in Shah Alam is 1 bedroom listings, making up 31.7% of the market. This suggests a strong demand for properties suitable for couples or solo travelers.
- Together, 1 bedroom and 2 bedrooms properties represent 62.2% of the active Airbnb listings in Shah Alam, indicating a high concentration in these sizes.
Shah Alam Vacation Rental Guest Capacity Trends (2026)
Distribution of Listings by Guest Capacity
Guest Capacity Insights for Shah Alam
- The most common guest capacity trend in Shah Alam vacation rentals is listings accommodating 2 guests (21.4%). This suggests the primary traveler segment is likely couples or solo travelers.
- Properties designed for 2 guests and 4 guests dominate the Shah Alam STR market, accounting for 40.7% of listings.
- 31.6% of properties accommodate 6+ guests, serving the market segment for larger families or group travel in Shah Alam.
- On average, properties in Shah Alam are equipped to host 4.4 guests.
Shah Alam Airbnb Booking Patterns (2026): Available vs. Booked Days
Available Days Distribution
Booked Days Distribution
Booking Pattern Insights for Shah Alam
- The most common availability pattern in Shah Alam falls within the 271-366 days range, representing 72.1% of listings. This suggests many properties have significant open periods on their calendars.
- Approximately 95.9% of listings show high availability (181+ days open annually), indicating potential for increased bookings or specific owner usage patterns.
- For booked days, the 31-90 days range is most frequent in Shah Alam (41.8%), reflecting common guest stay durations or potential owner blocking patterns.
- A notable 4.9% of properties secure long booking periods (181+ days booked per year), highlighting successful long-term rental strategies or significant owner usage.
Shah Alam Airbnb Minimum Stay Requirements Analysis
Distribution of Listings by Minimum Night Requirement
1 Night
1463 listings
92.8% of total
2 Nights
47 listings
3% of total
3 Nights
3 listings
0.2% of total
4-6 Nights
8 listings
0.5% of total
7-29 Nights
10 listings
0.6% of total
30+ Nights
46 listings
2.9% of total
Key Insights
- The most prevalent minimum stay requirement in Shah Alam is 1 Night, adopted by 92.8% of listings. This highlights the market's preference for shorter, flexible bookings.
- A strong majority (95.8%) of the Shah Alam Airbnb data shows acceptance of very short stays (1-2 nights), indicating a dynamic, high-turnover market.
- Dedicated monthly rentals (30+ nights) represent a small niche (2.9%), possibly an untapped area for hosts.
Recommendations
- Align with the market by considering a 1 Night minimum stay, as 92.8% of Shah Alam hosts use this setting.
- Adjust minimum nights based on seasonality – potentially shorter during low season and longer during peak demand periods in Shah Alam.
Shah Alam Airbnb Cancellation Policy Trends Analysis (2026)
Flexible
516 listings
32.8% of total
Moderate
547 listings
34.8% of total
Firm
317 listings
20.1% of total
Strict
194 listings
12.3% of total
Cancellation Policy Insights for Shah Alam
- The prevailing Airbnb cancellation policy trend in Shah Alam is Moderate, used by 34.8% of listings.
- There's a relatively balanced mix between guest-friendly (67.6%) and stricter (32.4%) policies, offering choices for different guest needs.
Recommendations for Hosts
- Consider adopting a Moderate policy to align with the 34.8% market standard in Shah Alam.
- Using a Strict policy might deter some guests, as only 12.3% of listings use it. Evaluate if potential revenue protection outweighs possible lower booking rates.
- Regularly review your cancellation policy against competitors and market demand shifts in Shah Alam.
Shah Alam STR Booking Lead Time Analysis (2026)
Average Booking Lead Time by Month
Booking Lead Time Insights for Shah Alam
- The overall average booking lead time for vacation rentals in Shah Alam is 22 days.
- Guests book furthest in advance for stays during September (average 36 days), likely coinciding with peak travel demand or local events.
- The shortest booking windows occur for stays in March (average 13 days), indicating more last-minute travel plans during this time.
- Seasonally, Fall (27 days avg.) sees the longest lead times, while Spring (18 days avg.) has the shortest, reflecting typical travel planning cycles.
Recommendations for Hosts
- Use the overall average lead time (22 days) as a baseline for your pricing and availability strategy in Shah Alam.
- For September stays, consider implementing length-of-stay discounts or slightly higher rates for bookings made less than 36 days out to capitalize on advance planning.
- During March, focus on last-minute booking availability and promotions, as guests book with very short notice (13 days avg.).
- Target marketing efforts for the Fall season well in advance (at least 27 days) to capture early planners.
- Monitor your own booking lead times against these Shah Alam averages to identify opportunities for dynamic pricing adjustments.
Popular & Essential Airbnb Amenities in Shah Alam (2026)
Amenity Prevalence
Amenity Insights for Shah Alam
- Essential amenities in Shah Alam that guests expect include: Air conditioning, TV. Lacking these (any) could significantly impact bookings.
- Popular amenities like Wifi, Kitchen, Iron are common but not universal. Offering these can provide a competitive edge.
- A pool is a highly desired but not standard amenity, making it a key feature for attracting guests seeking leisure in Shah Alam.
- Warning: Wifi is not universally provided but is considered essential globally. Ensure reliable Wifi is offered.
Recommendations for Hosts
- Ensure your listing includes all essential amenities for Shah Alam: Air conditioning, TV.
- Prioritize adding missing essentials: Air conditioning, TV.
- Consider adding popular differentiators like Wifi or Kitchen to increase appeal.
- Highlight unique or less common amenities you offer (e.g., hot tub, dedicated workspace, EV charger) in your listing description and photos.
- Regularly check competitor amenities in Shah Alam to stay competitive.
Shah Alam Airbnb Guest Demographics & Profile Analysis (2026)
Guest Profile Summary for Shah Alam
- The typical guest profile for Airbnb in Shah Alam consists of primarily domestic travelers (89%), often arriving from nearby Kuala Lumpur, typically belonging to the Post-2000s (Gen Z/Alpha) group (50%), primarily speaking English or Malay.
- Domestic travelers account for 89.0% of guests.
- Key international markets include Malaysia (89%) and Singapore (4%).
- Top languages spoken are English (45.2%) followed by Malay (40.8%).
- A significant demographic segment is the Post-2000s (Gen Z/Alpha) group, representing 50% of guests.
Recommendations for Hosts
- Target domestic marketing efforts towards travelers from Kuala Lumpur and Shah Alam.
- Tailor amenities and listing descriptions to appeal to the dominant Post-2000s (Gen Z/Alpha) demographic (e.g., highlight fast WiFi, smart home features, local guides).
- Highlight unique local experiences or amenities relevant to the primary guest profile.
- Consider seasonal promotions aligned with peak travel times for key origin markets.
Nearby Short-Term Rental Market Comparison
How does the Shah Alam Airbnb market stack up against its neighbors? Compare key performance metrics like average monthly revenue, ADR, and occupancy rates in surrounding areas to understand the broader regional STR landscape.
| Market | Active Properties | Monthly Revenue | Daily Rate | Avg. Occupancy |
|---|---|---|---|---|
| Genting Sempah | 16 | $5,194 | $590.69 | 32% |
| Kampung Janda Baik | 23 | $2,028 | $303.47 | 20% |
| Si Rusa | 11 | $1,834 | $247.46 | 23% |
| Jeram | 11 | $1,496 | $194.55 | 23% |
| Bukit Tinggi | 82 | $1,291 | $168.48 | 23% |
| Hulu Chemperuh Aboriginal Village | 17 | $1,250 | $182.99 | 26% |
| Kuala Sungai Baru | 13 | $1,093 | $156.49 | 22% |
| Pulau Sebang | 88 | $916 | $203.35 | 19% |
| Batang Kali | 13 | $912 | $146.11 | 17% |
| Kuala Kubu Bharu | 42 | $869 | $126.03 | 22% |