Sepang Airbnb Market Analysis 2026: Short Term Rental Data & Vacation Rental Statistics in Selangor, Malaysia
Is Airbnb profitable in Sepang in 2026? Explore comprehensive Airbnb analytics for Sepang, Selangor, Malaysia to uncover income potential. This 2026 STR market report for Sepang, based on AirROI data from February 2025 to January 2026, reveals key trends in the bustling market of 1,715 active listings.
Whether you're considering an Airbnb investment in Sepang, optimizing your existing vacation rental, or exploring rental arbitrage opportunities, understanding the Sepang Airbnb data is crucial. Leveraging the low regulation environment is key to maximizing your short term rental income potential. Let's dive into the specifics.
Key Sepang Airbnb Performance Metrics Overview
Monthly Airbnb Revenue Variations & Income Potential in Sepang (2026)
Understanding the monthly revenue variations for Airbnb listings in Sepang is key to maximizing your short term rental income potential. Seasonality significantly impacts earnings. Our analysis, based on data from the past 12 months, shows that the peak revenue month for STRs in Sepang is typically December, while March often presents the lowest earnings, highlighting opportunities for strategic pricing adjustments during shoulder and low seasons. Explore the typical Airbnb income in Sepang across different performance tiers:
- Best-in-class properties (Top 10%) achieve $793+ monthly, often utilizing dynamic pricing and superior guest experiences.
- Strong performing properties (Top 25%) earn $477 or more, indicating effective management and desirable locations/amenities.
- Typical properties (Median) generate around $242 per month, representing the average market performance.
- Entry-level properties (Bottom 25%) see earnings around $107, often with potential for optimization.
Average Monthly Airbnb Earnings Trend in Sepang
Sepang Airbnb Occupancy Rate Trends (2026)
Maximize your bookings by understanding the Sepang STR occupancy trends. Seasonal demand shifts significantly influence how often properties are booked. Typically, Februarysees the highest demand (peak season occupancy), while June experiences the lowest (low season). Effective strategies, like adjusting minimum stays or offering promotions, can boost occupancy during slower periods. Here's how different property tiers perform in Sepang:
- Best-in-class properties (Top 10%) achieve 60%+ occupancy, indicating high desirability and potentially optimized availability.
- Strong performing properties (Top 25%) maintain 39% or higher occupancy, suggesting good market fit and guest satisfaction.
- Typical properties (Median) have an occupancy rate around 21%.
- Entry-level properties (Bottom 25%) average 10% occupancy, potentially facing higher vacancy.
Average Monthly Occupancy Rate Trend in Sepang
Average Daily Rate (ADR) Airbnb Trends in Sepang (2026)
Effective short term rental pricing strategy in Sepang involves understanding monthly ADR fluctuations. The Average Daily Rate (ADR) for Airbnb in Sepang typically peaks in December and dips lowest during April. Leveraging Airbnb dynamic pricing tools or strategies based on this seasonality can significantly boost revenue. Here's a look at the typical nightly rates achieved:
- Best-in-class properties (Top 10%) command rates of $73+ per night, often due to premium features or locations.
- Strong performing properties (Top 25%) achieve nightly rates of $52 or more.
- Typical properties (Median) charge around $34 per night.
- Entry-level properties (Bottom 25%) earn around $26 per night.
Average Daily Rate (ADR) Trend by Month in Sepang
Get Live Sepang Market Intelligence 👇

Explore Real-time Analytics
Airbnb Seasonality Analysis & Trends in Sepang (2026)
Peak Season (December, October, September)
- Revenue averages $430 per month
- Occupancy rates average 29.2%
- Daily rates average $50
Shoulder Season
- Revenue averages $383 per month
- Occupancy maintains around 27.6%
- Daily rates hold near $48
Low Season (January, March, April)
- Revenue drops to average $334 per month
- Occupancy decreases to average 24.9%
- Daily rates adjust to average $47
Seasonality Insights for Sepang
- The Airbnb seasonality in Sepang shows moderate seasonality with distinct peak and low periods. While the sections above show seasonal averages, it's also insightful to look at the extremes:
- During the high season, the absolute peak month showcases Sepang's highest earning potential, with monthly revenues capable of climbing to $477, occupancy reaching a high of 32.5%, and ADRs peaking at $51.
- Conversely, the slowest single month of the year, typically falling within the low season, marks the market's lowest point. In this month, revenue might dip to $329, occupancy could drop to 23.8%, and ADRs may adjust down to $45.
- Understanding both the seasonal averages and these monthly peaks and troughs in revenue, occupancy, and ADR is crucial for maximizing your Airbnb profit potential in Sepang.
Seasonal Strategies for Maximizing Profit
- Peak Season: Maximize revenue through premium pricing and potentially longer minimum stays. Ensure high availability.
- Low Season: Offer competitive pricing, special promotions (e.g., extended stay discounts), and flexible cancellation policies. Target off-season travelers like remote workers or budget-conscious guests.
- Shoulder Seasons: Implement dynamic pricing that balances peak and low rates. Target weekend travelers or specific events. Offer slightly more flexible terms than peak season.
- Regularly analyze your own performance against these Sepang seasonality benchmarks and adjust your pricing and availability strategy accordingly.
Best Areas for Airbnb Investment in Sepang (2026)
Exploring the top neighborhoods for short-term rentals in Sepang? This section highlights key areas, outlining why they are attractive for hosts and guests, along with notable local attractions. Consider these locations based on your target guest profile and investment strategy.
| Neighborhood / Area | Why Host Here? (Target Guests & Appeal) | Key Attractions & Landmarks |
|---|---|---|
| Sepang Gold Coast | A stunning beachfront area known for its beautiful coast and luxury resorts. Ideal for tourists seeking relaxation and water activities. | Gold Coast Beach, Sepang International Circuit, Batu Layar Beach, Avani Sepang Goldcoast Resort, Mitsui Outlet Park |
| Putrajaya | The administrative capital of Malaysia featuring modern architecture and green spaces, appealing to business travelers and tourists interested in culture and nature. | Putra Mosque, Perdana Putra, Putrajaya Lake, Botanic Garden, Millennium Monument |
| Cyberjaya | An evolving tech hub with numerous tech parks, attracting business travelers and expatriates. Offers modern accommodations and conveniences. | Cyberjaya Lake Gardens, Dpulze Shopping Centre, Cyberview Resort & Spa, Tech City, Tech Dome |
| KLIA (Kuala Lumpur International Airport) | A prime location for travelers due to its proximity to the airport, making it perfect for short stays and transit travelers. | KLIA Ekspres, Mitsui Outlet Park KLIA, Kuala Lumpur International Airport Observation Deck, Sama-Sama Hotel |
| Titiwangsa | A more residential area yet close to attractions, ideal for families and larger groups looking for a quieter stay. | Titiwangsa Lake Gardens, Pusat Sains Negara, National Art Gallery, Petronas Twin Towers (nearby) |
| Seri Kembangan | Known for its close proximity to attractions like The Mines, attracting families and shoppers alike. | The Mines Shopping Mall, Mines Resort City, Mines Wellness Hotel, Sunway Lagoon (nearby) |
| Bangi | A suburban area with popular educational institutions, drawing students and families to spacious accommodations. | UKM (Universiti Kebangsaan Malaysia), Bangi Wonderland Theme Park, Econsave Bangi, The Mines (nearby) |
| Puchong | A vibrant urban center with a mix of industrial and residential areas, favorable for both business travelers and tourists. | IOI Mall Puchong, Setia Walk, Sunway Pyramid (nearby), Puchong Jaya |
Understanding Airbnb License Requirements & STR Laws in Sepang (2026)
While Sepang, Selangor, Malaysia currently shows low STR regulations, specific Airbnb license requirements might still exist or change. Always verify the latest short term rental regulations and Airbnb license requirements directly with local government authorities for Sepang to ensure full compliance before hosting.
(Source: AirROI data, 2026, based on 0% licensed listings)
Top Performing Airbnb Properties in Sepang (2026)
Benchmark your potential! Explore examples of top-performing Airbnb properties in Sepangbased on Trailing Twelve Month (TTM) revenue. Analyze their characteristics, revenue, occupancy rate, and ADR to understand what drives success in this market.

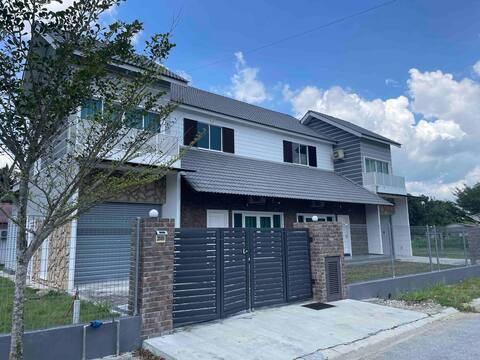
New Luxury Private Pool Villa Puchong up to 30 pax
Entire Place • 4 bedrooms

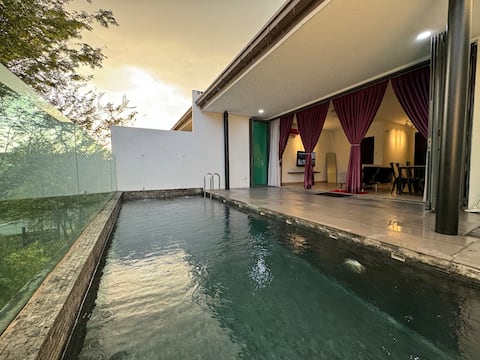
Puchong New Private Pool & Jacuzzi up to 30 Pax
Entire Place • 4 bedrooms

Scenic Villa for 30 | Courtyard, Pool, Rooftop
Entire Place • 11 bedrooms
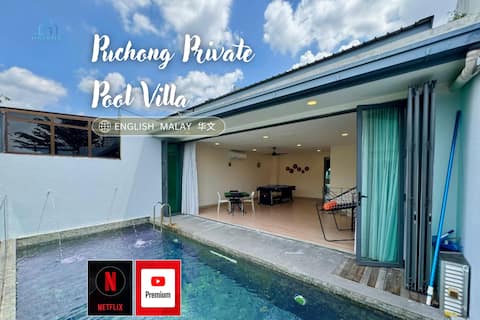
Puchong Private Pool Villa & Jacuzzi | Up to 30Pax
Entire Place • 4 bedrooms
Ontok - Ontok Residence | Entire House | Sleeps 16
Entire Place • 8 bedrooms
Private Pool Villa Puchong, Cyberjaya, Putrajaya
Entire Place • 4 bedrooms
Note: Performance varies based on location, size, amenities, seasonality, and management quality. Data reflects the past 12 months.
Top Performing Airbnb Hosts in Sepang (2026)
Learn from the best! This table showcases top-performing Airbnb hosts in Sepang based on the number of properties managed and estimated total revenue over the past year. Analyze their scale and performance metrics.
| Host Name | Properties | Grossing Revenue | Stay Reviews | Avg Rating |
|---|---|---|---|---|
| Tas’s | 52 | $158,428 | 1148 | 4.52/5.0 |
| Flexihome Malaysia | 66 | $156,253 | 7905 | 4.67/5.0 |
| Nida | 24 | $150,670 | 2950 | 4.89/5.0 |
| Colin | 2 | $117,849 | 244 | 4.91/5.0 |
| Jenderam Hill | 4 | $115,134 | 20 | 5.00/5.0 |
| IdamanKU | 118 | $113,416 | 4311 | 4.57/5.0 |
| Sweet Home | 51 | $103,556 | 3045 | 4.59/5.0 |
| Arron | 52 | $90,677 | 6670 | 4.56/5.0 |
| Wong | 11 | $73,383 | 286 | 4.91/5.0 |
| Nor Aini | 3 | $71,674 | 60 | 4.94/5.0 |
Analyzing the strategies of top hosts, such as their property selection, pricing, and guest communication, can offer valuable lessons for optimizing your own Airbnb operations in Sepang.
Dive Deeper: Advanced Sepang STR Market Data (2026)
Ready to unlock more insights? AirROI provides access to advanced metrics and comprehensive Airbnb data for Sepang. Explore detailed analytics beyond this report to refine your investment strategy, optimize pricing, and maximize your vacation rental profits.
Explore Advanced MetricsSepang Short-Term Rental Market Composition (2026): Property & Room Types
Room Type Distribution
Property Type Distribution
Market Composition Insights for Sepang
- The Sepang Airbnb market composition is heavily skewed towards Entire Home/Apt listings, which make up 96% of the 1,715 active rentals. This indicates strong guest preference for privacy and space.
- Looking at the property type distribution in Sepang, Apartment/Condo properties are the most common (86.4%), reflecting the local real estate landscape.
- Smaller segments like hotel/boutique, unique stays, others, outdoor/unique (combined 1.7%) offer potential for unique stay experiences.
Sepang Airbnb Room Capacity Analysis (2026): Bedroom Distribution
Distribution of Listings by Number of Bedrooms
Room Capacity Insights for Sepang
- The dominant room capacity in Sepang is 1 bedroom listings, making up 39.9% of the market. This suggests a strong demand for properties suitable for couples or solo travelers.
- Together, 1 bedroom and 3 bedrooms properties represent 59.1% of the active Airbnb listings in Sepang, indicating a high concentration in these sizes.
- A significant 26.4% of listings offer 3+ bedrooms, catering to larger groups and families seeking more space in Sepang.
Sepang Vacation Rental Guest Capacity Trends (2026)
Distribution of Listings by Guest Capacity
Guest Capacity Insights for Sepang
- The most common guest capacity trend in Sepang vacation rentals is listings accommodating 2 guests (39.1%). This suggests the primary traveler segment is likely couples or solo travelers.
- Properties designed for 2 guests and 4 guests dominate the Sepang STR market, accounting for 56.5% of listings.
- 25.6% of properties accommodate 6+ guests, serving the market segment for larger families or group travel in Sepang.
- On average, properties in Sepang are equipped to host 3.9 guests.
Sepang Airbnb Booking Patterns (2026): Available vs. Booked Days
Available Days Distribution
Booked Days Distribution
Booking Pattern Insights for Sepang
- The most common availability pattern in Sepang falls within the 271-366 days range, representing 73.9% of listings. This suggests many properties have significant open periods on their calendars.
- Approximately 94.0% of listings show high availability (181+ days open annually), indicating potential for increased bookings or specific owner usage patterns.
- For booked days, the 31-90 days range is most frequent in Sepang (42.3%), reflecting common guest stay durations or potential owner blocking patterns.
- A notable 6.3% of properties secure long booking periods (181+ days booked per year), highlighting successful long-term rental strategies or significant owner usage.
Sepang Airbnb Minimum Stay Requirements Analysis
Distribution of Listings by Minimum Night Requirement
1 Night
1611 listings
93.9% of total
2 Nights
38 listings
2.2% of total
3 Nights
5 listings
0.3% of total
4-6 Nights
6 listings
0.3% of total
7-29 Nights
14 listings
0.8% of total
30+ Nights
41 listings
2.4% of total
Key Insights
- The most prevalent minimum stay requirement in Sepang is 1 Night, adopted by 93.9% of listings. This highlights the market's preference for shorter, flexible bookings.
- A strong majority (96.1%) of the Sepang Airbnb data shows acceptance of very short stays (1-2 nights), indicating a dynamic, high-turnover market.
- Dedicated monthly rentals (30+ nights) represent a small niche (2.4%), possibly an untapped area for hosts.
Recommendations
- Align with the market by considering a 1 Night minimum stay, as 93.9% of Sepang hosts use this setting.
- Adjust minimum nights based on seasonality – potentially shorter during low season and longer during peak demand periods in Sepang.
Sepang Airbnb Cancellation Policy Trends Analysis (2026)
Super Strict 60 Days
2 listings
0.1% of total
Super Strict 30 Days
1 listings
0.1% of total
Limited
9 listings
0.5% of total
Flexible
914 listings
53.4% of total
Moderate
374 listings
21.8% of total
Firm
317 listings
18.5% of total
Strict
95 listings
5.5% of total
Cancellation Policy Insights for Sepang
- The prevailing Airbnb cancellation policy trend in Sepang is Flexible, used by 53.4% of listings.
- The market strongly favors guest-friendly terms, with 75.2% of listings offering Flexible or Moderate policies. This suggests guests in Sepang may expect booking flexibility.
- Strict cancellation policies are quite rare (5.5%), potentially making listings with this policy less competitive unless justified by high demand or property type.
Recommendations for Hosts
- Consider adopting a Flexible policy to align with the 53.4% market standard in Sepang.
- Given the high prevalence of Flexible policies (53.4%), offering this can enhance booking appeal, especially during shoulder seasons.
- Using a Strict policy might deter some guests, as only 5.5% of listings use it. Evaluate if potential revenue protection outweighs possible lower booking rates.
- Regularly review your cancellation policy against competitors and market demand shifts in Sepang.
Sepang STR Booking Lead Time Analysis (2026)
Average Booking Lead Time by Month
Booking Lead Time Insights for Sepang
- The overall average booking lead time for vacation rentals in Sepang is 17 days.
- Guests book furthest in advance for stays during October (average 29 days), likely coinciding with peak travel demand or local events.
- The shortest booking windows occur for stays in February (average 12 days), indicating more last-minute travel plans during this time.
- Seasonally, Fall (22 days avg.) sees the longest lead times, while Spring (14 days avg.) has the shortest, reflecting typical travel planning cycles.
Recommendations for Hosts
- Use the overall average lead time (17 days) as a baseline for your pricing and availability strategy in Sepang.
- For October stays, consider implementing length-of-stay discounts or slightly higher rates for bookings made less than 29 days out to capitalize on advance planning.
- Target marketing efforts for the Fall season well in advance (at least 22 days) to capture early planners.
- Monitor your own booking lead times against these Sepang averages to identify opportunities for dynamic pricing adjustments.
Popular & Essential Airbnb Amenities in Sepang (2026)
Amenity Prevalence
Amenity Insights for Sepang
- Essential amenities in Sepang that guests expect include: Air conditioning, TV, Wifi, Free parking on premises. Lacking these (any) could significantly impact bookings.
- Popular amenities like Kitchen, Pool, Iron are common but not universal. Offering these can provide a competitive edge.
- A pool is a highly desired but not standard amenity, making it a key feature for attracting guests seeking leisure in Sepang.
Recommendations for Hosts
- Ensure your listing includes all essential amenities for Sepang: Air conditioning, TV, Wifi, Free parking on premises.
- Prioritize adding missing essentials: Air conditioning, TV, Wifi, Free parking on premises.
- Consider adding popular differentiators like Kitchen or Pool to increase appeal.
- Highlight unique or less common amenities you offer (e.g., hot tub, dedicated workspace, EV charger) in your listing description and photos.
- Regularly check competitor amenities in Sepang to stay competitive.
Sepang Airbnb Guest Demographics & Profile Analysis (2026)
Guest Profile Summary for Sepang
- The typical guest profile for Airbnb in Sepang consists of primarily domestic travelers (76%), often arriving from nearby Kuala Lumpur, typically belonging to the Post-2000s (Gen Z/Alpha) group (50%), primarily speaking English or Malay.
- Domestic travelers account for 75.7% of guests.
- Key international markets include Malaysia (75.7%) and Singapore (3.1%).
- Top languages spoken are English (46.1%) followed by Malay (34.1%).
- A significant demographic segment is the Post-2000s (Gen Z/Alpha) group, representing 50% of guests.
Recommendations for Hosts
- Target domestic marketing efforts towards travelers from Kuala Lumpur and Selangor.
- Tailor amenities and listing descriptions to appeal to the dominant Post-2000s (Gen Z/Alpha) demographic (e.g., highlight fast WiFi, smart home features, local guides).
- Highlight unique local experiences or amenities relevant to the primary guest profile.
- Consider seasonal promotions aligned with peak travel times for key origin markets.
Nearby Short-Term Rental Market Comparison
How does the Sepang Airbnb market stack up against its neighbors? Compare key performance metrics like average monthly revenue, ADR, and occupancy rates in surrounding areas to understand the broader regional STR landscape.
| Market | Active Properties | Monthly Revenue | Daily Rate | Avg. Occupancy |
|---|---|---|---|---|
| Genting Sempah | 16 | $5,194 | $590.69 | 32% |
| Kampung Janda Baik | 23 | $2,028 | $303.47 | 20% |
| Si Rusa | 11 | $1,834 | $247.46 | 23% |
| Jeram | 11 | $1,496 | $194.55 | 23% |
| Bukit Tinggi | 82 | $1,291 | $168.48 | 23% |
| Hulu Chemperuh Aboriginal Village | 17 | $1,250 | $182.99 | 26% |
| Kuala Sungai Baru | 13 | $1,093 | $156.49 | 22% |
| Pulau Sebang | 88 | $916 | $203.35 | 19% |
| Batang Kali | 13 | $912 | $146.11 | 17% |
| Kuala Kubu Bharu | 42 | $869 | $126.03 | 22% |