Tawau Airbnb Market Analysis 2026: Short Term Rental Data & Vacation Rental Statistics in Sabah, Malaysia
Is Airbnb profitable in Tawau in 2026? Explore comprehensive Airbnb analytics for Tawau, Sabah, Malaysia to uncover income potential. This 2026 STR market report for Tawau, based on AirROI data from February 2025 to January 2026, reveals key trends in the niche market of 73 active listings.
Whether you're considering an Airbnb investment in Tawau, optimizing your existing vacation rental, or exploring rental arbitrage opportunities, understanding the Tawau Airbnb data is crucial. Leveraging the low regulation environment is key to maximizing your short term rental income potential. Let's dive into the specifics.
Key Tawau Airbnb Performance Metrics Overview
Monthly Airbnb Revenue Variations & Income Potential in Tawau (2026)
Understanding the monthly revenue variations for Airbnb listings in Tawau is key to maximizing your short term rental income potential. Seasonality significantly impacts earnings. Our analysis, based on data from the past 12 months, shows that the peak revenue month for STRs in Tawau is typically October, while July often presents the lowest earnings, highlighting opportunities for strategic pricing adjustments during shoulder and low seasons. Explore the typical Airbnb income in Tawau across different performance tiers:
- Best-in-class properties (Top 10%) achieve $924+ monthly, often utilizing dynamic pricing and superior guest experiences.
- Strong performing properties (Top 25%) earn $590 or more, indicating effective management and desirable locations/amenities.
- Typical properties (Median) generate around $350 per month, representing the average market performance.
- Entry-level properties (Bottom 25%) see earnings around $177, often with potential for optimization.
Average Monthly Airbnb Earnings Trend in Tawau
Tawau Airbnb Occupancy Rate Trends (2026)
Maximize your bookings by understanding the Tawau STR occupancy trends. Seasonal demand shifts significantly influence how often properties are booked. Typically, Februarysees the highest demand (peak season occupancy), while July experiences the lowest (low season). Effective strategies, like adjusting minimum stays or offering promotions, can boost occupancy during slower periods. Here's how different property tiers perform in Tawau:
- Best-in-class properties (Top 10%) achieve 48%+ occupancy, indicating high desirability and potentially optimized availability.
- Strong performing properties (Top 25%) maintain 35% or higher occupancy, suggesting good market fit and guest satisfaction.
- Typical properties (Median) have an occupancy rate around 23%.
- Entry-level properties (Bottom 25%) average 13% occupancy, potentially facing higher vacancy.
Average Monthly Occupancy Rate Trend in Tawau
Average Daily Rate (ADR) Airbnb Trends in Tawau (2026)
Effective short term rental pricing strategy in Tawau involves understanding monthly ADR fluctuations. The Average Daily Rate (ADR) for Airbnb in Tawau typically peaks in December and dips lowest during March. Leveraging Airbnb dynamic pricing tools or strategies based on this seasonality can significantly boost revenue. Here's a look at the typical nightly rates achieved:
- Best-in-class properties (Top 10%) command rates of $97+ per night, often due to premium features or locations.
- Strong performing properties (Top 25%) achieve nightly rates of $76 or more.
- Typical properties (Median) charge around $55 per night.
- Entry-level properties (Bottom 25%) earn around $43 per night.
Average Daily Rate (ADR) Trend by Month in Tawau
Get Live Tawau Market Intelligence 👇

Explore Real-time Analytics
Airbnb Seasonality Analysis & Trends in Tawau (2026)
Peak Season (October, April, March)
- Revenue averages $535 per month
- Occupancy rates average 29.8%
- Daily rates average $61
Shoulder Season
- Revenue averages $461 per month
- Occupancy maintains around 26.2%
- Daily rates hold near $63
Low Season (January, July, September)
- Revenue drops to average $369 per month
- Occupancy decreases to average 19.1%
- Daily rates adjust to average $63
Seasonality Insights for Tawau
- The Airbnb seasonality in Tawau shows moderate seasonality with distinct peak and low periods. While the sections above show seasonal averages, it's also insightful to look at the extremes:
- During the high season, the absolute peak month showcases Tawau's highest earning potential, with monthly revenues capable of climbing to $581, occupancy reaching a high of 32.6%, and ADRs peaking at $65.
- Conversely, the slowest single month of the year, typically falling within the low season, marks the market's lowest point. In this month, revenue might dip to $348, occupancy could drop to 16.8%, and ADRs may adjust down to $60.
- Understanding both the seasonal averages and these monthly peaks and troughs in revenue, occupancy, and ADR is crucial for maximizing your Airbnb profit potential in Tawau.
Seasonal Strategies for Maximizing Profit
- Peak Season: Maximize revenue through premium pricing and potentially longer minimum stays. Ensure high availability.
- Low Season: Offer competitive pricing, special promotions (e.g., extended stay discounts), and flexible cancellation policies. Target off-season travelers like remote workers or budget-conscious guests.
- Shoulder Seasons: Implement dynamic pricing that balances peak and low rates. Target weekend travelers or specific events. Offer slightly more flexible terms than peak season.
- Regularly analyze your own performance against these Tawau seasonality benchmarks and adjust your pricing and availability strategy accordingly.
Best Areas for Airbnb Investment in Tawau (2026)
Exploring the top neighborhoods for short-term rentals in Tawau? This section highlights key areas, outlining why they are attractive for hosts and guests, along with notable local attractions. Consider these locations based on your target guest profile and investment strategy.
| Neighborhood / Area | Why Host Here? (Target Guests & Appeal) | Key Attractions & Landmarks |
|---|---|---|
| Tawau Town | The central business district of Tawau, offering easy access to local markets, shops, and cultural experiences. It is popular with travelers seeking convenience and local flavor. | Tawau Market, Tawau Hills Park, Sabah Tea Garden, Batu Putih Beach, Teck Guan Cocoa Museum |
| Semporna | Known for its stunning islands and diving spots, Semporna attracts tourists who are interested in marine life and adventure sports. It is a key area for those seeking unique underwater experiences. | Sipadan Island, Mabul Island, Kapalai Resort, Tun Sakaran Marine Park, Semporna Jetty |
| Kota Kinabalu | While not in Tawau directly, Kota Kinabalu is a major tourist destination in Sabah, known for its beautiful beaches and Mount Kinabalu. It serves as a gateway for many travelers heading to Tawau. | Mount Kinabalu, Tunku Abdul Rahman National Park, Kota Kinabalu Waterfront, Filipino Market, Klias River |
| Batu Putih | A coastal area near Tawau known for its beautiful beaches and local seafood. It is ideal for travelers looking for a quiet retreat by the sea. | Batu Putih Beach, Tawau Golf Club, Beachfront seafood restaurants, Mangrove forests, Water sports activities |
| Kundasang | Known for its cool climate and scenic views of Mount Kinabalu, Kundasang is a popular escape for those looking to experience the natural beauty of Sabah. | Desa Dairy Farm, Kinabalu Park, Kundasang War Memorial, Ladang 88, Mountain climbing |
| Maliau Basin | This remote area is known as the 'Lost World of Sabah' and is a prime spot for eco-tourism and adventure seekers, making it suitable for unique Airbnb experiences. | Maliau Basin Conservation Area, Rainforest trekking, Wildlife spotting, Eco-lodges, Canopy walks |
| Tawau Hills Park | A natural park located near Tawau, appealing to nature lovers and hikers. It offers serene environments for those seeking to explore the rainforest. | Tawau Hills Park trails, Waterfalls, Biodiversity, Picnic areas, Camping sites |
| Island Hopping from Semporna | An adventure activity popular among tourists who want to explore the various islands around Semporna, making it a hotspot for short stays and activities. | Snorkeling trips, Day tours to nearby islands, Cultural experiences on the islands, Beach picnics, Water sports |
Understanding Airbnb License Requirements & STR Laws in Tawau (2026)
While Tawau, Sabah, Malaysia currently shows low STR regulations, specific Airbnb license requirements might still exist or change. Always verify the latest short term rental regulations and Airbnb license requirements directly with local government authorities for Tawau to ensure full compliance before hosting.
(Source: AirROI data, 2026, based on 1% licensed listings)
Top Performing Airbnb Properties in Tawau (2026)
Benchmark your potential! Explore examples of top-performing Airbnb properties in Tawaubased on Trailing Twelve Month (TTM) revenue. Analyze their characteristics, revenue, occupancy rate, and ADR to understand what drives success in this market.

Cosy 4R4B by Havenn Tonight @ Sin On, Tawau
Entire Place • 4 bedrooms
Cozy Zone (Homestay)
Entire Place • 5 bedrooms
Grace Homestay Tawau Level 1 (Whole Unit)
Entire Place • 3 bedrooms

MY Homestay
Entire Place • 4 bedrooms

Welcome To Kim_Homestay.
Entire Place • 3 bedrooms
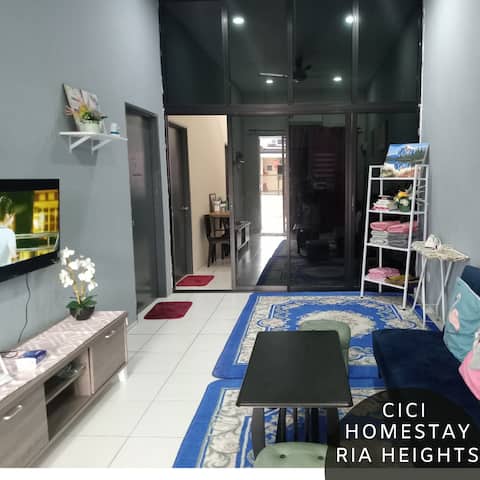
Cici Homestay Ria Heights, Tawau
Entire Place • 3 bedrooms
Note: Performance varies based on location, size, amenities, seasonality, and management quality. Data reflects the past 12 months.
Top Performing Airbnb Hosts in Tawau (2026)
Learn from the best! This table showcases top-performing Airbnb hosts in Tawau based on the number of properties managed and estimated total revenue over the past year. Analyze their scale and performance metrics.
| Host Name | Properties | Grossing Revenue | Stay Reviews | Avg Rating |
|---|---|---|---|---|
| Yi Weun | 5 | $41,273 | 162 | 4.98/5.0 |
| Grace Homestay | 2 | $17,037 | 95 | 4.86/5.0 |
| Wendy | 6 | $16,141 | 28 | 4.83/5.0 |
| Tet Yang | 3 | $13,561 | 22 | 4.77/5.0 |
| Fadzil | 2 | $12,327 | 33 | 4.79/5.0 |
| Haur | 1 | $11,835 | 20 | 4.55/5.0 |
| Lie Erl | 4 | $10,860 | 137 | 4.62/5.0 |
| Lai | 1 | $10,465 | 9 | 5.00/5.0 |
| Kimberly | 1 | $10,295 | 5 | 4.80/5.0 |
| 镛 | 3 | $8,828 | 10 | 4.75/5.0 |
Analyzing the strategies of top hosts, such as their property selection, pricing, and guest communication, can offer valuable lessons for optimizing your own Airbnb operations in Tawau.
Dive Deeper: Advanced Tawau STR Market Data (2026)
Ready to unlock more insights? AirROI provides access to advanced metrics and comprehensive Airbnb data for Tawau. Explore detailed analytics beyond this report to refine your investment strategy, optimize pricing, and maximize your vacation rental profits.
Explore Advanced MetricsTawau Short-Term Rental Market Composition (2026): Property & Room Types
Room Type Distribution
Property Type Distribution
Market Composition Insights for Tawau
- The Tawau Airbnb market composition is heavily skewed towards Entire Home/Apt listings, which make up 76.7% of the 73 active rentals. This indicates strong guest preference for privacy and space.
- Looking at the property type distribution in Tawau, House properties are the most common (76.7%), reflecting the local real estate landscape.
- Houses represent a significant 76.7% portion, catering likely to families or larger groups.
- The presence of 11% Hotel/Boutique listings indicates integration with traditional hospitality.
Tawau Airbnb Room Capacity Analysis (2026): Bedroom Distribution
Distribution of Listings by Number of Bedrooms
Room Capacity Insights for Tawau
- The dominant room capacity in Tawau is 3 bedrooms listings, making up 42.5% of the market. This suggests a strong demand for properties suitable for families or small groups.
- Together, 3 bedrooms and 4 bedrooms properties represent 64.4% of the active Airbnb listings in Tawau, indicating a high concentration in these sizes.
- A significant 67.1% of listings offer 3+ bedrooms, catering to larger groups and families seeking more space in Tawau.
Tawau Vacation Rental Guest Capacity Trends (2026)
Distribution of Listings by Guest Capacity
Guest Capacity Insights for Tawau
- The most common guest capacity trend in Tawau vacation rentals is listings accommodating 8+ guests (43.8%). This suggests the primary traveler segment is likely larger groups.
- Properties designed for 8+ guests and 6 guests dominate the Tawau STR market, accounting for 56.1% of listings.
- 67.1% of properties accommodate 6+ guests, serving the market segment for larger families or group travel in Tawau.
- On average, properties in Tawau are equipped to host 5.7 guests.
Tawau Airbnb Booking Patterns (2026): Available vs. Booked Days
Available Days Distribution
Booked Days Distribution
Booking Pattern Insights for Tawau
- The most common availability pattern in Tawau falls within the 271-366 days range, representing 78.1% of listings. This suggests many properties have significant open periods on their calendars.
- Approximately 98.6% of listings show high availability (181+ days open annually), indicating potential for increased bookings or specific owner usage patterns.
- For booked days, the 31-90 days range is most frequent in Tawau (41.1%), reflecting common guest stay durations or potential owner blocking patterns.
- A notable 2.7% of properties secure long booking periods (181+ days booked per year), highlighting successful long-term rental strategies or significant owner usage.
Tawau Airbnb Minimum Stay Requirements Analysis
Distribution of Listings by Minimum Night Requirement
1 Night
62 listings
84.9% of total
2 Nights
5 listings
6.8% of total
30+ Nights
6 listings
8.2% of total
Key Insights
- The most prevalent minimum stay requirement in Tawau is 1 Night, adopted by 84.9% of listings. This highlights the market's preference for shorter, flexible bookings.
- A strong majority (91.7%) of the Tawau Airbnb data shows acceptance of very short stays (1-2 nights), indicating a dynamic, high-turnover market.
Recommendations
- Align with the market by considering a 1 Night minimum stay, as 84.9% of Tawau hosts use this setting.
- Explore offering discounts for stays of 30+ nights to attract the 8.2% of the market seeking extended stays.
- Adjust minimum nights based on seasonality – potentially shorter during low season and longer during peak demand periods in Tawau.
Tawau Airbnb Cancellation Policy Trends Analysis (2026)
Limited
5 listings
6.9% of total
Flexible
28 listings
38.9% of total
Moderate
24 listings
33.3% of total
Firm
9 listings
12.5% of total
Strict
6 listings
8.3% of total
Cancellation Policy Insights for Tawau
- The prevailing Airbnb cancellation policy trend in Tawau is Flexible, used by 38.9% of listings.
- The market strongly favors guest-friendly terms, with 72.2% of listings offering Flexible or Moderate policies. This suggests guests in Tawau may expect booking flexibility.
- Strict cancellation policies are quite rare (8.3%), potentially making listings with this policy less competitive unless justified by high demand or property type.
Recommendations for Hosts
- Consider adopting a Flexible policy to align with the 38.9% market standard in Tawau.
- Using a Strict policy might deter some guests, as only 8.3% of listings use it. Evaluate if potential revenue protection outweighs possible lower booking rates.
- Regularly review your cancellation policy against competitors and market demand shifts in Tawau.
Tawau STR Booking Lead Time Analysis (2026)
Average Booking Lead Time by Month
Booking Lead Time Insights for Tawau
- The overall average booking lead time for vacation rentals in Tawau is 31 days.
- Guests book furthest in advance for stays during October (average 45 days), likely coinciding with peak travel demand or local events.
- The shortest booking windows occur for stays in February (average 17 days), indicating more last-minute travel plans during this time.
- Seasonally, Fall (36 days avg.) sees the longest lead times, while Spring (26 days avg.) has the shortest, reflecting typical travel planning cycles.
Recommendations for Hosts
- Use the overall average lead time (31 days) as a baseline for your pricing and availability strategy in Tawau.
- For October stays, consider implementing length-of-stay discounts or slightly higher rates for bookings made less than 45 days out to capitalize on advance planning.
- Target marketing efforts for the Fall season well in advance (at least 36 days) to capture early planners.
- Monitor your own booking lead times against these Tawau averages to identify opportunities for dynamic pricing adjustments.
Popular & Essential Airbnb Amenities in Tawau (2026)
Amenity Prevalence
Amenity Insights for Tawau
- Essential amenities in Tawau that guests expect include: Air conditioning, Free parking on premises. Lacking these (any) could significantly impact bookings.
- Popular amenities like TV, Kitchen, Washer are common but not universal. Offering these can provide a competitive edge.
- Warning: Wifi is not universally provided but is considered essential globally. Ensure reliable Wifi is offered.
Recommendations for Hosts
- Ensure your listing includes all essential amenities for Tawau: Air conditioning, Free parking on premises.
- Prioritize adding missing essentials: Free parking on premises.
- Consider adding popular differentiators like TV or Kitchen to increase appeal.
- Highlight unique or less common amenities you offer (e.g., hot tub, dedicated workspace, EV charger) in your listing description and photos.
- Regularly check competitor amenities in Tawau to stay competitive.
Tawau Airbnb Guest Demographics & Profile Analysis (2026)
Guest Profile Summary for Tawau
- The typical guest profile for Airbnb in Tawau consists of primarily domestic travelers (74%), often arriving from nearby Kuala Lumpur, typically belonging to the Post-2000s (Gen Z/Alpha) group (50%), primarily speaking English or Malay.
- Domestic travelers account for 74.2% of guests.
- Key international markets include Malaysia (74.2%) and China (6.7%).
- Top languages spoken are English (42.1%) followed by Malay (24.3%).
- A significant demographic segment is the Post-2000s (Gen Z/Alpha) group, representing 50% of guests.
Recommendations for Hosts
- Target domestic marketing efforts towards travelers from Kuala Lumpur and Kota Kinabalu.
- Tailor amenities and listing descriptions to appeal to the dominant Post-2000s (Gen Z/Alpha) demographic (e.g., highlight fast WiFi, smart home features, local guides).
- Highlight unique local experiences or amenities relevant to the primary guest profile.
- Consider seasonal promotions aligned with peak travel times for key origin markets.
Nearby Short-Term Rental Market Comparison
How does the Tawau Airbnb market stack up against its neighbors? Compare key performance metrics like average monthly revenue, ADR, and occupancy rates in surrounding areas to understand the broader regional STR landscape.
| Market | Active Properties | Monthly Revenue | Daily Rate | Avg. Occupancy |
|---|---|---|---|---|
| Kota Kinabalu | 1,580 | $602 | $79.58 | 32% |
| Tanjung Aru | 183 | $571 | $62.55 | 33% |
| Api-Api Center | 41 | $521 | $68.33 | 30% |
| Kampung Sembulan Lama | 156 | $466 | $88.54 | 27% |
| Putatan | 17 | $466 | $80.84 | 22% |
| Semporna | 231 | $442 | $74.74 | 25% |
| Sandakan | 148 | $316 | $57.02 | 24% |
| Lahad Datu | 21 | $259 | $56.19 | 22% |
| Donggongon | 174 | $222 | $55.56 | 21% |