Seri Manjung Airbnb Market Analysis 2026: Short Term Rental Data & Vacation Rental Statistics in Perak, Malaysia
Is Airbnb profitable in Seri Manjung in 2026? Explore comprehensive Airbnb analytics for Seri Manjung, Perak, Malaysia to uncover income potential. This 2026 STR market report for Seri Manjung, based on AirROI data from February 2025 to January 2026, reveals key trends in the niche market of 41 active listings.
Whether you're considering an Airbnb investment in Seri Manjung, optimizing your existing vacation rental, or exploring rental arbitrage opportunities, understanding the Seri Manjung Airbnb data is crucial. Leveraging the low regulation environment is key to maximizing your short term rental income potential. Let's dive into the specifics.
Key Seri Manjung Airbnb Performance Metrics Overview
Monthly Airbnb Revenue Variations & Income Potential in Seri Manjung (2026)
Understanding the monthly revenue variations for Airbnb listings in Seri Manjung is key to maximizing your short term rental income potential. Seasonality significantly impacts earnings. Our analysis, based on data from the past 12 months, shows that the peak revenue month for STRs in Seri Manjung is typically September, while March often presents the lowest earnings, highlighting opportunities for strategic pricing adjustments during shoulder and low seasons. Explore the typical Airbnb income in Seri Manjung across different performance tiers:
- Best-in-class properties (Top 10%) achieve $836+ monthly, often utilizing dynamic pricing and superior guest experiences.
- Strong performing properties (Top 25%) earn $544 or more, indicating effective management and desirable locations/amenities.
- Typical properties (Median) generate around $286 per month, representing the average market performance.
- Entry-level properties (Bottom 25%) see earnings around $132, often with potential for optimization.
Average Monthly Airbnb Earnings Trend in Seri Manjung
Seri Manjung Airbnb Occupancy Rate Trends (2026)
Maximize your bookings by understanding the Seri Manjung STR occupancy trends. Seasonal demand shifts significantly influence how often properties are booked. Typically, Septembersees the highest demand (peak season occupancy), while August experiences the lowest (low season). Effective strategies, like adjusting minimum stays or offering promotions, can boost occupancy during slower periods. Here's how different property tiers perform in Seri Manjung:
- Best-in-class properties (Top 10%) achieve 40%+ occupancy, indicating high desirability and potentially optimized availability.
- Strong performing properties (Top 25%) maintain 27% or higher occupancy, suggesting good market fit and guest satisfaction.
- Typical properties (Median) have an occupancy rate around 16%.
- Entry-level properties (Bottom 25%) average 7% occupancy, potentially facing higher vacancy.
Average Monthly Occupancy Rate Trend in Seri Manjung
Average Daily Rate (ADR) Airbnb Trends in Seri Manjung (2026)
Effective short term rental pricing strategy in Seri Manjung involves understanding monthly ADR fluctuations. The Average Daily Rate (ADR) for Airbnb in Seri Manjung typically peaks in October and dips lowest during March. Leveraging Airbnb dynamic pricing tools or strategies based on this seasonality can significantly boost revenue. Here's a look at the typical nightly rates achieved:
- Best-in-class properties (Top 10%) command rates of $112+ per night, often due to premium features or locations.
- Strong performing properties (Top 25%) achieve nightly rates of $72 or more.
- Typical properties (Median) charge around $53 per night.
- Entry-level properties (Bottom 25%) earn around $39 per night.
Average Daily Rate (ADR) Trend by Month in Seri Manjung
Get Live Seri Manjung Market Intelligence 👇

Explore Real-time Analytics
Airbnb Seasonality Analysis & Trends in Seri Manjung (2026)
Peak Season (September, May, October)
- Revenue averages $541 per month
- Occupancy rates average 22.7%
- Daily rates average $69
Shoulder Season
- Revenue averages $398 per month
- Occupancy maintains around 18.3%
- Daily rates hold near $68
Low Season (January, March, July)
- Revenue drops to average $300 per month
- Occupancy decreases to average 17.2%
- Daily rates adjust to average $68
Seasonality Insights for Seri Manjung
- The Airbnb seasonality in Seri Manjung shows highly seasonal trends requiring careful strategy. While the sections above show seasonal averages, it's also insightful to look at the extremes:
- During the high season, the absolute peak month showcases Seri Manjung's highest earning potential, with monthly revenues capable of climbing to $624, occupancy reaching a high of 26.1%, and ADRs peaking at $71.
- Conversely, the slowest single month of the year, typically falling within the low season, marks the market's lowest point. In this month, revenue might dip to $271, occupancy could drop to 12.8%, and ADRs may adjust down to $65.
- Understanding both the seasonal averages and these monthly peaks and troughs in revenue, occupancy, and ADR is crucial for maximizing your Airbnb profit potential in Seri Manjung.
Seasonal Strategies for Maximizing Profit
- Peak Season: Maximize revenue through premium pricing and potentially longer minimum stays. Ensure high availability.
- Low Season: Offer competitive pricing, special promotions (e.g., extended stay discounts), and flexible cancellation policies. Target off-season travelers like remote workers or budget-conscious guests.
- Shoulder Seasons: Implement dynamic pricing that balances peak and low rates. Target weekend travelers or specific events. Offer slightly more flexible terms than peak season.
- Regularly analyze your own performance against these Seri Manjung seasonality benchmarks and adjust your pricing and availability strategy accordingly.
Best Areas for Airbnb Investment in Seri Manjung (2026)
Exploring the top neighborhoods for short-term rentals in Seri Manjung? This section highlights key areas, outlining why they are attractive for hosts and guests, along with notable local attractions. Consider these locations based on your target guest profile and investment strategy.
| Neighborhood / Area | Why Host Here? (Target Guests & Appeal) | Key Attractions & Landmarks |
|---|---|---|
| Pantai Remis | A beautiful beach area known for its picturesque coastal views and seafood restaurants. Perfect for tourists looking to relax by the sea. | Pantai Remis Beach, Fishing Village, Nasi Lemak Warisan, Seafood Restaurants, Sunset Viewing |
| Kg. Tanjung Piandang | A traditional fishing village that offers a glimpse into local life, popular for its fresh seafood and cultural experiences. | Tanjung Piandang Jetty, Local Seafood Markets, Cultural Festivals, Village Tours |
| Sitiawan | A growing urban area that combines modern amenities with traditional values. A good base for exploring nearby natural attractions. | Central Market, Kampung Cina Sitiawan, Eat Street, Batu Lima Beach, Local Temples |
| Lumut | Known for its naval base and beautiful beaches, Lumut attracts both tourists and locals looking for leisure and entertainment. | Lumut Waterfront, Marina Island, Coral Beach, Royal Malaysian Navy Museum, Eco-Adventure Parks |
| Teluk Batik | A popular beach destination for both tourists and locals, known for its clear waters and recreational activities. | Teluk Batik Beach, Water Sports Activities, Resort Hotels, Family Picnics, Sunbathing |
| Kg. Koh | A historic village known for its heritage and cultural significance, it's a great spot for visitors interested in local history and food. | Old Temples, Local Artisans, Heritage Tours, Traditional Food |
| Setiawan | A vibrant town with a mix of traditional and modern living, offering good shopping and dining experiences. | Parkson Setiawan, Local Night Markets, Sitiawan Plaza, Cafes and Restaurants |
| Manjung District | The encompassing district that includes several attractions, it's a strategic location for hosting Airbnb due to its diverse offerings. | Manjung Municipal Council, Lagoon Park, Local Parks, Natural Reserves, Art and Cultural Events |
Understanding Airbnb License Requirements & STR Laws in Seri Manjung (2026)
While Seri Manjung, Perak, Malaysia currently shows low STR regulations, specific Airbnb license requirements might still exist or change. Always verify the latest short term rental regulations and Airbnb license requirements directly with local government authorities for Seri Manjung to ensure full compliance before hosting.
(Source: AirROI data, 2026, finding no licensed listings among those analyzed)
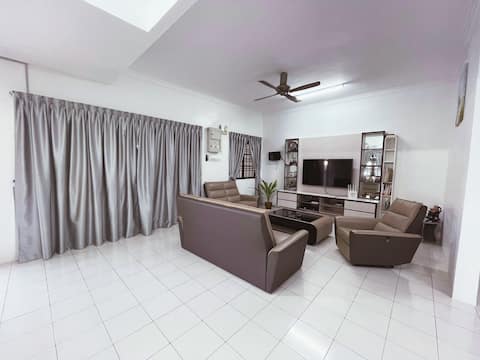
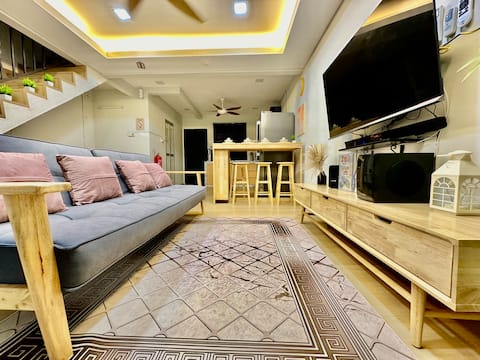
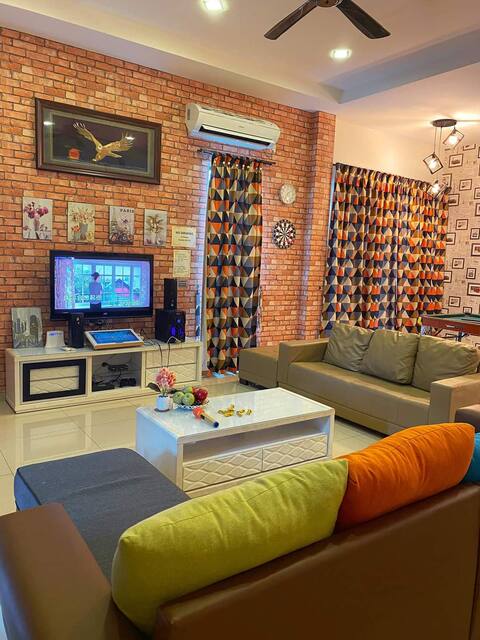
Top Performing Airbnb Properties in Seri Manjung (2026)
Benchmark your potential! Explore examples of top-performing Airbnb properties in Seri Manjungbased on Trailing Twelve Month (TTM) revenue. Analyze their characteristics, revenue, occupancy rate, and ADR to understand what drives success in this market.
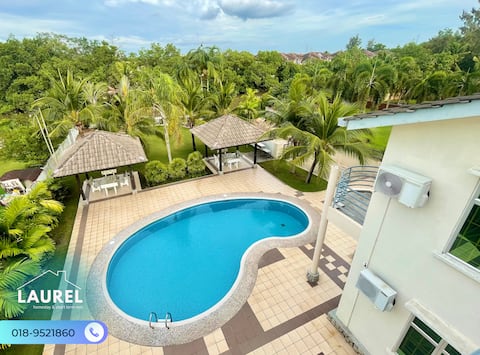
Bungalow Private Pool Near Aeon Manjung 5BR
Entire Place • 5 bedrooms

Love Homestay Pool Manjung
Entire Place • 5 bedrooms
Lovely Semi-D@Manjung Lumut
Entire Place • 3 bedrooms
My Muji Homestay | Massage Chair | Wifi 500Mbps
Entire Place • 3 bedrooms
17 Teluk Batik | Pool•Karaoke•BBQ. Snooker|15 pax
Entire Place • 4 bedrooms

homestay manjung wifi300mbps 3br
Entire Place • 3 bedrooms
Note: Performance varies based on location, size, amenities, seasonality, and management quality. Data reflects the past 12 months.
Top Performing Airbnb Hosts in Seri Manjung (2026)
Learn from the best! This table showcases top-performing Airbnb hosts in Seri Manjung based on the number of properties managed and estimated total revenue over the past year. Analyze their scale and performance metrics.
| Host Name | Properties | Grossing Revenue | Stay Reviews | Avg Rating |
|---|---|---|---|---|
| Laurel | 1 | $15,581 | 132 | 4.73/5.0 |
| Grace | 3 | $15,258 | 44 | 5.00/5.0 |
| Muhd Khairi | 1 | $14,512 | 9 | 4.89/5.0 |
| June | 3 | $9,320 | 67 | 4.20/5.0 |
| Aina Afiqah | 2 | $7,405 | 42 | 4.88/5.0 |
| Nur Ain | 1 | $7,375 | 67 | 4.97/5.0 |
| Bin | 2 | $6,434 | 69 | 4.84/5.0 |
| Lumuthomestay | 1 | $5,868 | 18 | 5.00/5.0 |
| Abu Samah | 1 | $4,378 | 12 | 4.83/5.0 |
| Latiff | 1 | $3,584 | 105 | 4.74/5.0 |
Analyzing the strategies of top hosts, such as their property selection, pricing, and guest communication, can offer valuable lessons for optimizing your own Airbnb operations in Seri Manjung.
Dive Deeper: Advanced Seri Manjung STR Market Data (2026)
Ready to unlock more insights? AirROI provides access to advanced metrics and comprehensive Airbnb data for Seri Manjung. Explore detailed analytics beyond this report to refine your investment strategy, optimize pricing, and maximize your vacation rental profits.
Explore Advanced MetricsSeri Manjung Short-Term Rental Market Composition (2026): Property & Room Types
Room Type Distribution
Property Type Distribution
Market Composition Insights for Seri Manjung
- The Seri Manjung Airbnb market composition is heavily skewed towards Entire Home/Apt listings, which make up 87.8% of the 41 active rentals. This indicates strong guest preference for privacy and space.
- Looking at the property type distribution in Seri Manjung, House properties are the most common (82.9%), reflecting the local real estate landscape.
- Houses represent a significant 82.9% portion, catering likely to families or larger groups.
Seri Manjung Airbnb Room Capacity Analysis (2026): Bedroom Distribution
Distribution of Listings by Number of Bedrooms
Room Capacity Insights for Seri Manjung
- The dominant room capacity in Seri Manjung is 3 bedrooms listings, making up 48.8% of the market. This suggests a strong demand for properties suitable for families or small groups.
- Together, 3 bedrooms and 4 bedrooms properties represent 70.8% of the active Airbnb listings in Seri Manjung, indicating a high concentration in these sizes.
- A significant 80.6% of listings offer 3+ bedrooms, catering to larger groups and families seeking more space in Seri Manjung.
Seri Manjung Vacation Rental Guest Capacity Trends (2026)
Distribution of Listings by Guest Capacity
Guest Capacity Insights for Seri Manjung
- The most common guest capacity trend in Seri Manjung vacation rentals is listings accommodating 8+ guests (63.4%). This suggests the primary traveler segment is likely larger groups.
- Properties designed for 8+ guests and 6 guests dominate the Seri Manjung STR market, accounting for 78.0% of listings.
- 85.3% of properties accommodate 6+ guests, serving the market segment for larger families or group travel in Seri Manjung.
- On average, properties in Seri Manjung are equipped to host 6.6 guests.
Seri Manjung Airbnb Booking Patterns (2026): Available vs. Booked Days
Available Days Distribution
Booked Days Distribution
Booking Pattern Insights for Seri Manjung
- The most common availability pattern in Seri Manjung falls within the 271-366 days range, representing 90.2% of listings. This suggests many properties have significant open periods on their calendars.
- Approximately 100.0% of listings show high availability (181+ days open annually), indicating potential for increased bookings or specific owner usage patterns.
- For booked days, the 31-90 days range is most frequent in Seri Manjung (46.3%), reflecting common guest stay durations or potential owner blocking patterns.
Seri Manjung Airbnb Minimum Stay Requirements Analysis
Distribution of Listings by Minimum Night Requirement
1 Night
39 listings
95.1% of total
2 Nights
1 listings
2.4% of total
30+ Nights
1 listings
2.4% of total
Key Insights
- The most prevalent minimum stay requirement in Seri Manjung is 1 Night, adopted by 95.1% of listings. This highlights the market's preference for shorter, flexible bookings.
- A strong majority (97.5%) of the Seri Manjung Airbnb data shows acceptance of very short stays (1-2 nights), indicating a dynamic, high-turnover market.
- Dedicated monthly rentals (30+ nights) represent a small niche (2.4%), possibly an untapped area for hosts.
Recommendations
- Align with the market by considering a 1 Night minimum stay, as 95.1% of Seri Manjung hosts use this setting.
- Adjust minimum nights based on seasonality – potentially shorter during low season and longer during peak demand periods in Seri Manjung.
Seri Manjung Airbnb Cancellation Policy Trends Analysis (2026)
Limited
1 listings
2.4% of total
Flexible
19 listings
46.3% of total
Moderate
10 listings
24.4% of total
Firm
10 listings
24.4% of total
Strict
1 listings
2.4% of total
Cancellation Policy Insights for Seri Manjung
- The prevailing Airbnb cancellation policy trend in Seri Manjung is Flexible, used by 46.3% of listings.
- The market strongly favors guest-friendly terms, with 70.7% of listings offering Flexible or Moderate policies. This suggests guests in Seri Manjung may expect booking flexibility.
- Strict cancellation policies are quite rare (2.4%), potentially making listings with this policy less competitive unless justified by high demand or property type.
Recommendations for Hosts
- Consider adopting a Flexible policy to align with the 46.3% market standard in Seri Manjung.
- Using a Strict policy might deter some guests, as only 2.4% of listings use it. Evaluate if potential revenue protection outweighs possible lower booking rates.
- Regularly review your cancellation policy against competitors and market demand shifts in Seri Manjung.
Seri Manjung STR Booking Lead Time Analysis (2026)
Average Booking Lead Time by Month
Booking Lead Time Insights for Seri Manjung
- The overall average booking lead time for vacation rentals in Seri Manjung is 25 days.
- Guests book furthest in advance for stays during October (average 39 days), likely coinciding with peak travel demand or local events.
- The shortest booking windows occur for stays in July (average 18 days), indicating more last-minute travel plans during this time.
- Seasonally, Spring (28 days avg.) sees the longest lead times, while Winter (23 days avg.) has the shortest, reflecting typical travel planning cycles.
Recommendations for Hosts
- Use the overall average lead time (25 days) as a baseline for your pricing and availability strategy in Seri Manjung.
- For October stays, consider implementing length-of-stay discounts or slightly higher rates for bookings made less than 39 days out to capitalize on advance planning.
- Target marketing efforts for the Spring season well in advance (at least 28 days) to capture early planners.
- Monitor your own booking lead times against these Seri Manjung averages to identify opportunities for dynamic pricing adjustments.
Popular & Essential Airbnb Amenities in Seri Manjung (2026)
Amenity Prevalence
Amenity Insights for Seri Manjung
- Essential amenities in Seri Manjung that guests expect include: Kitchen, Air conditioning, Free parking on premises. Lacking these (any) could significantly impact bookings.
- Popular amenities like Washer, TV, Wifi are common but not universal. Offering these can provide a competitive edge.
- Warning: Wifi is not universally provided but is considered essential globally. Ensure reliable Wifi is offered.
Recommendations for Hosts
- Ensure your listing includes all essential amenities for Seri Manjung: Kitchen, Air conditioning, Free parking on premises.
- Prioritize adding missing essentials: Free parking on premises.
- Consider adding popular differentiators like Washer or TV to increase appeal.
- Highlight unique or less common amenities you offer (e.g., hot tub, dedicated workspace, EV charger) in your listing description and photos.
- Regularly check competitor amenities in Seri Manjung to stay competitive.
Seri Manjung Airbnb Guest Demographics & Profile Analysis (2026)
Guest Profile Summary for Seri Manjung
- The typical guest profile for Airbnb in Seri Manjung consists of primarily domestic travelers (97%), often arriving from nearby Kuala Lumpur, typically belonging to the Post-2000s (Gen Z/Alpha) group (50%), primarily speaking Malay or English.
- Domestic travelers account for 96.8% of guests.
- Key international markets include Malaysia (96.8%) and Poland (1.6%).
- Top languages spoken are Malay (42.3%) followed by English (42.3%).
- A significant demographic segment is the Post-2000s (Gen Z/Alpha) group, representing 50% of guests.
Recommendations for Hosts
- Target domestic marketing efforts towards travelers from Kuala Lumpur and Selangor.
- Tailor amenities and listing descriptions to appeal to the dominant Post-2000s (Gen Z/Alpha) demographic (e.g., highlight fast WiFi, smart home features, local guides).
- Highlight unique local experiences or amenities relevant to the primary guest profile.
- Consider seasonal promotions aligned with peak travel times for key origin markets.
Nearby Short-Term Rental Market Comparison
How does the Seri Manjung Airbnb market stack up against its neighbors? Compare key performance metrics like average monthly revenue, ADR, and occupancy rates in surrounding areas to understand the broader regional STR landscape.
| Market | Active Properties | Monthly Revenue | Daily Rate | Avg. Occupancy |
|---|---|---|---|---|
| Genting Sempah | 16 | $5,194 | $590.69 | 32% |
| Kampung Janda Baik | 23 | $2,028 | $303.47 | 20% |
| Jeram | 11 | $1,496 | $194.55 | 23% |
| Bukit Tinggi | 82 | $1,291 | $168.48 | 23% |
| Hulu Chemperuh Aboriginal Village | 17 | $1,250 | $182.99 | 26% |
| Batang Kali | 13 | $912 | $146.11 | 17% |
| Kuala Kubu Bharu | 42 | $869 | $126.03 | 22% |
| Bentong | 95 | $830 | $176.50 | 18% |
| Tanjung Tokong | 25 | $697 | $78.55 | 47% |
| George Town | 3,772 | $687 | $81.80 | 34% |