Cameron Highlands Airbnb Market Analysis 2026: Short Term Rental Data & Vacation Rental Statistics in Pahang, Malaysia
Is Airbnb profitable in Cameron Highlands in 2026? Explore comprehensive Airbnb analytics for Cameron Highlands, Pahang, Malaysia to uncover income potential. This 2026 STR market report for Cameron Highlands, based on AirROI data from February 2025 to January 2026, reveals key trends in the market of 680 active listings.
Whether you're considering an Airbnb investment in Cameron Highlands, optimizing your existing vacation rental, or exploring rental arbitrage opportunities, understanding the Cameron Highlands Airbnb data is crucial. Leveraging the low regulation environment is key to maximizing your short term rental income potential. Let's dive into the specifics.
Key Cameron Highlands Airbnb Performance Metrics Overview
Monthly Airbnb Revenue Variations & Income Potential in Cameron Highlands (2026)
Understanding the monthly revenue variations for Airbnb listings in Cameron Highlands is key to maximizing your short term rental income potential. Seasonality significantly impacts earnings. Our analysis, based on data from the past 12 months, shows that the peak revenue month for STRs in Cameron Highlands is typically December, while April often presents the lowest earnings, highlighting opportunities for strategic pricing adjustments during shoulder and low seasons. Explore the typical Airbnb income in Cameron Highlands across different performance tiers:
- Best-in-class properties (Top 10%) achieve $1,447+ monthly, often utilizing dynamic pricing and superior guest experiences.
- Strong performing properties (Top 25%) earn $880 or more, indicating effective management and desirable locations/amenities.
- Typical properties (Median) generate around $445 per month, representing the average market performance.
- Entry-level properties (Bottom 25%) see earnings around $204, often with potential for optimization.
Average Monthly Airbnb Earnings Trend in Cameron Highlands
Cameron Highlands Airbnb Occupancy Rate Trends (2026)
Maximize your bookings by understanding the Cameron Highlands STR occupancy trends. Seasonal demand shifts significantly influence how often properties are booked. Typically, Decembersees the highest demand (peak season occupancy), while April experiences the lowest (low season). Effective strategies, like adjusting minimum stays or offering promotions, can boost occupancy during slower periods. Here's how different property tiers perform in Cameron Highlands:
- Best-in-class properties (Top 10%) achieve 58%+ occupancy, indicating high desirability and potentially optimized availability.
- Strong performing properties (Top 25%) maintain 38% or higher occupancy, suggesting good market fit and guest satisfaction.
- Typical properties (Median) have an occupancy rate around 22%.
- Entry-level properties (Bottom 25%) average 11% occupancy, potentially facing higher vacancy.
Average Monthly Occupancy Rate Trend in Cameron Highlands
Average Daily Rate (ADR) Airbnb Trends in Cameron Highlands (2026)
Effective short term rental pricing strategy in Cameron Highlands involves understanding monthly ADR fluctuations. The Average Daily Rate (ADR) for Airbnb in Cameron Highlands typically peaks in December and dips lowest during March. Leveraging Airbnb dynamic pricing tools or strategies based on this seasonality can significantly boost revenue. Here's a look at the typical nightly rates achieved:
- Best-in-class properties (Top 10%) command rates of $116+ per night, often due to premium features or locations.
- Strong performing properties (Top 25%) achieve nightly rates of $84 or more.
- Typical properties (Median) charge around $64 per night.
- Entry-level properties (Bottom 25%) earn around $49 per night.
Average Daily Rate (ADR) Trend by Month in Cameron Highlands
Get Live Cameron Highlands Market Intelligence 👇

Explore Real-time Analytics
Airbnb Seasonality Analysis & Trends in Cameron Highlands (2026)
Peak Season (December, August, July)
- Revenue averages $808 per month
- Occupancy rates average 30.9%
- Daily rates average $78
Shoulder Season
- Revenue averages $683 per month
- Occupancy maintains around 28.0%
- Daily rates hold near $77
Low Season (January, April, May)
- Revenue drops to average $532 per month
- Occupancy decreases to average 21.9%
- Daily rates adjust to average $77
Seasonality Insights for Cameron Highlands
- The Airbnb seasonality in Cameron Highlands shows moderate seasonality with distinct peak and low periods. While the sections above show seasonal averages, it's also insightful to look at the extremes:
- During the high season, the absolute peak month showcases Cameron Highlands's highest earning potential, with monthly revenues capable of climbing to $878, occupancy reaching a high of 32.1%, and ADRs peaking at $80.
- Conversely, the slowest single month of the year, typically falling within the low season, marks the market's lowest point. In this month, revenue might dip to $483, occupancy could drop to 20.5%, and ADRs may adjust down to $74.
- Understanding both the seasonal averages and these monthly peaks and troughs in revenue, occupancy, and ADR is crucial for maximizing your Airbnb profit potential in Cameron Highlands.
Seasonal Strategies for Maximizing Profit
- Peak Season: Maximize revenue through premium pricing and potentially longer minimum stays. Ensure high availability.
- Low Season: Offer competitive pricing, special promotions (e.g., extended stay discounts), and flexible cancellation policies. Target off-season travelers like remote workers or budget-conscious guests.
- Shoulder Seasons: Implement dynamic pricing that balances peak and low rates. Target weekend travelers or specific events. Offer slightly more flexible terms than peak season.
- Regularly analyze your own performance against these Cameron Highlands seasonality benchmarks and adjust your pricing and availability strategy accordingly.
Best Areas for Airbnb Investment in Cameron Highlands (2026)
Exploring the top neighborhoods for short-term rentals in Cameron Highlands? This section highlights key areas, outlining why they are attractive for hosts and guests, along with notable local attractions. Consider these locations based on your target guest profile and investment strategy.
| Neighborhood / Area | Why Host Here? (Target Guests & Appeal) | Key Attractions & Landmarks |
|---|---|---|
| Brinchang | Brinchang is the second highest point in Cameron Highlands and is known for its cool climate and beautiful views. It is popular among tourists for its vibrant night market and accessibility to key attractions. | Cameron Highlands Night Market, Strawberry Farms, Cactus Valley, Mossy Forest |
| Tanah Rata | Tanah Rata is the main town of Cameron Highlands and serves as a hub for tourists. It offers a wide range of accommodations and dining options, along with access to nearby tea plantations and hiking trails. | Cameron Bharat Tea Plantation, Tanah Rata Golf Course, Cameron Highlands Jungle Trail |
| Ringlet | Ringlet is a quieter area known for its scenic landscapes and agricultural lands. It offers a peaceful retreat for visitors looking to escape the hustle and bustle of the main towns. | Ringlet River, Butterfly Garden, Tea Plantations |
| Lojing | Lojing, located further away from the main attractions, offers unique eco-tourism opportunities and is known for its natural beauty and serenity. It's ideal for those who want a more secluded experience. | Lojing Stong State Park, Gua Musang |
| Bertam Valley | Bertam Valley is known for its lush agricultural lands and offers visitors a chance to experience local farming. It's a great spot for nature lovers and those interested in rural tourism. | Bertam Valley Strawberry Farm, Local Agricultural Tours |
| Hulu Selangor | This area provides a more adventurous experience with its lush jungles and waterfalls, attracting those who enjoy outdoor activities like hiking and nature exploration. | Sungai Chiling Waterfall, Kota Damansara Forest Reserve |
| Kea Farm | Kea Farm is famous for its market that sells fresh produce and souvenirs. It attracts many tourists looking for local goods and a taste of local produce. | Kea Farm Market, Butterfly Garden |
| Taman Negara | Taman Negara is not directly in Cameron Highlands but is nearby and offers one of the world’s premier national parks with rich biodiversity. It attracts eco-tourists and adventure seekers. | Taman Negara National Park, Jungle Trekking, Canopy Walkway |
Understanding Airbnb License Requirements & STR Laws in Cameron Highlands (2026)
While Cameron Highlands, Pahang, Malaysia currently shows low STR regulations, specific Airbnb license requirements might still exist or change. Always verify the latest short term rental regulations and Airbnb license requirements directly with local government authorities for Cameron Highlands to ensure full compliance before hosting.
(Source: AirROI data, 2026, based on 0% licensed listings)
Top Performing Airbnb Properties in Cameron Highlands (2026)
Benchmark your potential! Explore examples of top-performing Airbnb properties in Cameron Highlandsbased on Trailing Twelve Month (TTM) revenue. Analyze their characteristics, revenue, occupancy rate, and ADR to understand what drives success in this market.

8R7B Barrington villa @ Golden Hill (20-34pax)
Entire Place • 8 bedrooms
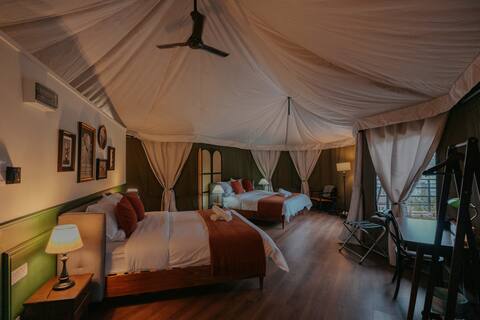
Luxury Safari Tent | 3 Rooms + Huge Outdoor Deck
Private Room • 3 bedrooms
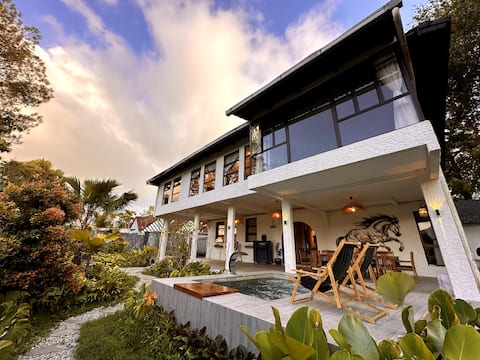
The White Horse
Entire Place • 4 bedrooms
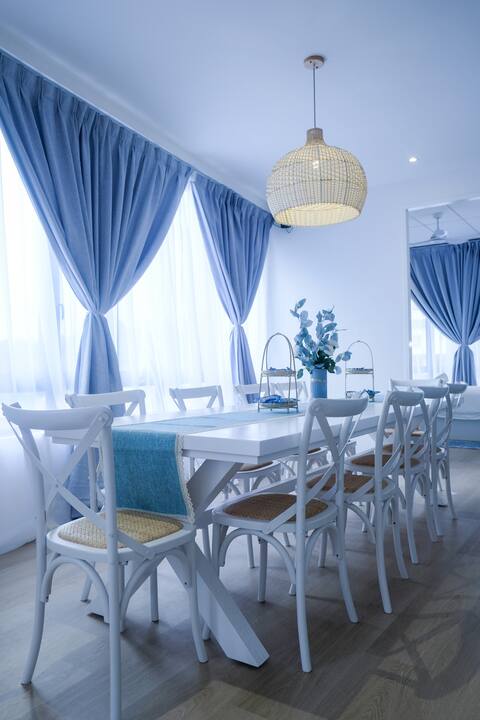
Tung's Hideout- Hidden Homestay@ Centrum Cameron
Entire Place • 5 bedrooms
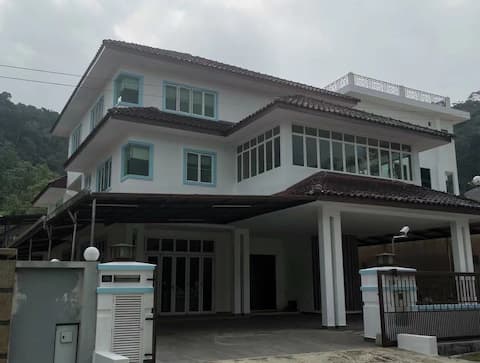
Dear Dino House Cameron Highlands (29 pax)
Entire Place • 9 bedrooms
ZenByStellar Luxury Tent (Yama) With Breakfast
Private Room • 1 bedroom
Note: Performance varies based on location, size, amenities, seasonality, and management quality. Data reflects the past 12 months.
Top Performing Airbnb Hosts in Cameron Highlands (2026)
Learn from the best! This table showcases top-performing Airbnb hosts in Cameron Highlands based on the number of properties managed and estimated total revenue over the past year. Analyze their scale and performance metrics.
| Host Name | Properties | Grossing Revenue | Stay Reviews | Avg Rating |
|---|---|---|---|---|
| Weng Kin | 6 | $115,790 | 179 | 4.71/5.0 |
| Chew Lim | 4 | $112,951 | 695 | 4.96/5.0 |
| Tung | 3 | $111,508 | 949 | 4.88/5.0 |
| Stellar | 5 | $103,201 | 10 | 5.00/5.0 |
| Bernice | 7 | $102,952 | 693 | 4.91/5.0 |
| G | 24 | $102,175 | 2440 | 4.73/5.0 |
| Wen Wen | 4 | $91,314 | 412 | 4.83/5.0 |
| Barrington Villa | 5 | $86,084 | 61 | 4.49/5.0 |
| Gladys | 7 | $77,993 | 460 | 4.59/5.0 |
| Suraj | 6 | $70,301 | 589 | 4.91/5.0 |
Analyzing the strategies of top hosts, such as their property selection, pricing, and guest communication, can offer valuable lessons for optimizing your own Airbnb operations in Cameron Highlands.
Dive Deeper: Advanced Cameron Highlands STR Market Data (2026)
Ready to unlock more insights? AirROI provides access to advanced metrics and comprehensive Airbnb data for Cameron Highlands. Explore detailed analytics beyond this report to refine your investment strategy, optimize pricing, and maximize your vacation rental profits.
Explore Advanced MetricsCameron Highlands Short-Term Rental Market Composition (2026): Property & Room Types
Room Type Distribution
Property Type Distribution
Market Composition Insights for Cameron Highlands
- The Cameron Highlands Airbnb market composition is heavily skewed towards Entire Home/Apt listings, which make up 85.3% of the 680 active rentals. This indicates strong guest preference for privacy and space.
- Looking at the property type distribution in Cameron Highlands, Apartment/Condo properties are the most common (70.7%), reflecting the local real estate landscape.
- Houses represent a significant 15.9% portion, catering likely to families or larger groups.
- The presence of 10% Hotel/Boutique listings indicates integration with traditional hospitality.
- Smaller segments like others, outdoor/unique, unique stays (combined 3.4%) offer potential for unique stay experiences.
Cameron Highlands Airbnb Room Capacity Analysis (2026): Bedroom Distribution
Distribution of Listings by Number of Bedrooms
Room Capacity Insights for Cameron Highlands
- The dominant room capacity in Cameron Highlands is 3 bedrooms listings, making up 47.6% of the market. This suggests a strong demand for properties suitable for families or small groups.
- Together, 3 bedrooms and 1 bedroom properties represent 66.0% of the active Airbnb listings in Cameron Highlands, indicating a high concentration in these sizes.
- A significant 63.1% of listings offer 3+ bedrooms, catering to larger groups and families seeking more space in Cameron Highlands.
Cameron Highlands Vacation Rental Guest Capacity Trends (2026)
Distribution of Listings by Guest Capacity
Guest Capacity Insights for Cameron Highlands
- The most common guest capacity trend in Cameron Highlands vacation rentals is listings accommodating 8+ guests (54.9%). This suggests the primary traveler segment is likely larger groups.
- Properties designed for 8+ guests and 6 guests dominate the Cameron Highlands STR market, accounting for 69.5% of listings.
- 76.0% of properties accommodate 6+ guests, serving the market segment for larger families or group travel in Cameron Highlands.
- On average, properties in Cameron Highlands are equipped to host 6.3 guests.
Cameron Highlands Airbnb Booking Patterns (2026): Available vs. Booked Days
Available Days Distribution
Booked Days Distribution
Booking Pattern Insights for Cameron Highlands
- The most common availability pattern in Cameron Highlands falls within the 271-366 days range, representing 71.3% of listings. This suggests many properties have significant open periods on their calendars.
- Approximately 92.0% of listings show high availability (181+ days open annually), indicating potential for increased bookings or specific owner usage patterns.
- For booked days, the 31-90 days range is most frequent in Cameron Highlands (35.9%), reflecting common guest stay durations or potential owner blocking patterns.
- A notable 8.8% of properties secure long booking periods (181+ days booked per year), highlighting successful long-term rental strategies or significant owner usage.
Cameron Highlands Airbnb Minimum Stay Requirements Analysis
Distribution of Listings by Minimum Night Requirement
1 Night
639 listings
94% of total
2 Nights
15 listings
2.2% of total
30+ Nights
26 listings
3.8% of total
Key Insights
- The most prevalent minimum stay requirement in Cameron Highlands is 1 Night, adopted by 94% of listings. This highlights the market's preference for shorter, flexible bookings.
- A strong majority (96.2%) of the Cameron Highlands Airbnb data shows acceptance of very short stays (1-2 nights), indicating a dynamic, high-turnover market.
Recommendations
- Align with the market by considering a 1 Night minimum stay, as 94% of Cameron Highlands hosts use this setting.
- Adjust minimum nights based on seasonality – potentially shorter during low season and longer during peak demand periods in Cameron Highlands.
Cameron Highlands Airbnb Cancellation Policy Trends Analysis (2026)
Limited
6 listings
0.9% of total
Flexible
127 listings
18.8% of total
Moderate
183 listings
27% of total
Firm
228 listings
33.7% of total
Strict
133 listings
19.6% of total
Cancellation Policy Insights for Cameron Highlands
- The prevailing Airbnb cancellation policy trend in Cameron Highlands is Firm, used by 33.7% of listings.
- A majority (53.3%) of hosts in Cameron Highlands utilize Firm or Strict policies, indicating a market where hosts prioritize booking security.
Recommendations for Hosts
- Consider adopting a Firm policy to align with the 33.7% market standard in Cameron Highlands.
- Regularly review your cancellation policy against competitors and market demand shifts in Cameron Highlands.
Cameron Highlands STR Booking Lead Time Analysis (2026)
Average Booking Lead Time by Month
Booking Lead Time Insights for Cameron Highlands
- The overall average booking lead time for vacation rentals in Cameron Highlands is 24 days.
- Guests book furthest in advance for stays during December (average 31 days), likely coinciding with peak travel demand or local events.
- The shortest booking windows occur for stays in June (average 18 days), indicating more last-minute travel plans during this time.
- Seasonally, Winter (28 days avg.) sees the longest lead times, while Spring (19 days avg.) has the shortest, reflecting typical travel planning cycles.
Recommendations for Hosts
- Use the overall average lead time (24 days) as a baseline for your pricing and availability strategy in Cameron Highlands.
- Target marketing efforts for the Winter season well in advance (at least 28 days) to capture early planners.
- Monitor your own booking lead times against these Cameron Highlands averages to identify opportunities for dynamic pricing adjustments.
Popular & Essential Airbnb Amenities in Cameron Highlands (2026)
Amenity Prevalence
Amenity Insights for Cameron Highlands
- Popular amenities like TV, Wifi, Free parking on premises are common but not universal. Offering these can provide a competitive edge.
- Warning: Wifi is not universally provided but is considered essential globally. Ensure reliable Wifi is offered.
Recommendations for Hosts
- Consider adding popular differentiators like TV or Wifi to increase appeal.
- Highlight unique or less common amenities you offer (e.g., hot tub, dedicated workspace, EV charger) in your listing description and photos.
- Regularly check competitor amenities in Cameron Highlands to stay competitive.
Cameron Highlands Airbnb Guest Demographics & Profile Analysis (2026)
Guest Profile Summary for Cameron Highlands
- The typical guest profile for Airbnb in Cameron Highlands consists of primarily domestic travelers (73%), often arriving from nearby Kuala Lumpur, typically belonging to the Post-2000s (Gen Z/Alpha) group (50%), primarily speaking English or Malay.
- Domestic travelers account for 73.4% of guests.
- Key international markets include Malaysia (73.4%) and Singapore (9%).
- Top languages spoken are English (43%) followed by Malay (27.1%).
- A significant demographic segment is the Post-2000s (Gen Z/Alpha) group, representing 50% of guests.
Recommendations for Hosts
- Target domestic marketing efforts towards travelers from Kuala Lumpur and Selangor.
- Tailor amenities and listing descriptions to appeal to the dominant Post-2000s (Gen Z/Alpha) demographic (e.g., highlight fast WiFi, smart home features, local guides).
- Highlight unique local experiences or amenities relevant to the primary guest profile.
- Consider seasonal promotions aligned with peak travel times for key origin markets.
Nearby Short-Term Rental Market Comparison
How does the Cameron Highlands Airbnb market stack up against its neighbors? Compare key performance metrics like average monthly revenue, ADR, and occupancy rates in surrounding areas to understand the broader regional STR landscape.
| Market | Active Properties | Monthly Revenue | Daily Rate | Avg. Occupancy |
|---|---|---|---|---|
| Genting Sempah | 16 | $5,194 | $590.69 | 32% |
| Kampung Janda Baik | 23 | $2,028 | $303.47 | 20% |
| Jeram | 11 | $1,496 | $194.55 | 23% |
| Pulau Perhentian Kecil | 10 | $1,354 | $101.42 | 60% |
| Bukit Tinggi | 82 | $1,291 | $168.48 | 23% |
| Hulu Chemperuh Aboriginal Village | 17 | $1,250 | $182.99 | 26% |
| Batang Kali | 13 | $912 | $146.11 | 17% |
| Kuala Kubu Bharu | 42 | $869 | $126.03 | 22% |
| Bentong | 95 | $830 | $176.50 | 18% |
| Tanjung Tokong | 25 | $697 | $78.55 | 47% |