Bentong Airbnb Market Analysis 2026: Short Term Rental Data & Vacation Rental Statistics in Pahang, Malaysia
Is Airbnb profitable in Bentong in 2026? Explore comprehensive Airbnb analytics for Bentong, Pahang, Malaysia to uncover income potential. This 2026 STR market report for Bentong, based on AirROI data from February 2025 to January 2026, reveals key trends in the niche market of 95 active listings.
Whether you're considering an Airbnb investment in Bentong, optimizing your existing vacation rental, or exploring rental arbitrage opportunities, understanding the Bentong Airbnb data is crucial. Leveraging the low regulation environment is key to maximizing your short term rental income potential. Let's dive into the specifics.
Key Bentong Airbnb Performance Metrics Overview
Monthly Airbnb Revenue Variations & Income Potential in Bentong (2026)
Understanding the monthly revenue variations for Airbnb listings in Bentong is key to maximizing your short term rental income potential. Seasonality significantly impacts earnings. Our analysis, based on data from the past 12 months, shows that the peak revenue month for STRs in Bentong is typically December, while May often presents the lowest earnings, highlighting opportunities for strategic pricing adjustments during shoulder and low seasons. Explore the typical Airbnb income in Bentong across different performance tiers:
- Best-in-class properties (Top 10%) achieve $2,548+ monthly, often utilizing dynamic pricing and superior guest experiences.
- Strong performing properties (Top 25%) earn $1,145 or more, indicating effective management and desirable locations/amenities.
- Typical properties (Median) generate around $552 per month, representing the average market performance.
- Entry-level properties (Bottom 25%) see earnings around $226, often with potential for optimization.
Average Monthly Airbnb Earnings Trend in Bentong
Bentong Airbnb Occupancy Rate Trends (2026)
Maximize your bookings by understanding the Bentong STR occupancy trends. Seasonal demand shifts significantly influence how often properties are booked. Typically, Septembersees the highest demand (peak season occupancy), while May experiences the lowest (low season). Effective strategies, like adjusting minimum stays or offering promotions, can boost occupancy during slower periods. Here's how different property tiers perform in Bentong:
- Best-in-class properties (Top 10%) achieve 41%+ occupancy, indicating high desirability and potentially optimized availability.
- Strong performing properties (Top 25%) maintain 25% or higher occupancy, suggesting good market fit and guest satisfaction.
- Typical properties (Median) have an occupancy rate around 13%.
- Entry-level properties (Bottom 25%) average 7% occupancy, potentially facing higher vacancy.
Average Monthly Occupancy Rate Trend in Bentong
Average Daily Rate (ADR) Airbnb Trends in Bentong (2026)
Effective short term rental pricing strategy in Bentong involves understanding monthly ADR fluctuations. The Average Daily Rate (ADR) for Airbnb in Bentong typically peaks in December and dips lowest during March. Leveraging Airbnb dynamic pricing tools or strategies based on this seasonality can significantly boost revenue. Here's a look at the typical nightly rates achieved:
- Best-in-class properties (Top 10%) command rates of $361+ per night, often due to premium features or locations.
- Strong performing properties (Top 25%) achieve nightly rates of $196 or more.
- Typical properties (Median) charge around $114 per night.
- Entry-level properties (Bottom 25%) earn around $66 per night.
Average Daily Rate (ADR) Trend by Month in Bentong
Get Live Bentong Market Intelligence 👇

Explore Real-time Analytics
Airbnb Seasonality Analysis & Trends in Bentong (2026)
Peak Season (December, June, November)
- Revenue averages $1,563 per month
- Occupancy rates average 21.8%
- Daily rates average $179
Shoulder Season
- Revenue averages $1,230 per month
- Occupancy maintains around 19.4%
- Daily rates hold near $171
Low Season (March, April, May)
- Revenue drops to average $964 per month
- Occupancy decreases to average 16.1%
- Daily rates adjust to average $160
Seasonality Insights for Bentong
- The Airbnb seasonality in Bentong shows highly seasonal trends requiring careful strategy. While the sections above show seasonal averages, it's also insightful to look at the extremes:
- During the high season, the absolute peak month showcases Bentong's highest earning potential, with monthly revenues capable of climbing to $1,786, occupancy reaching a high of 24.0%, and ADRs peaking at $188.
- Conversely, the slowest single month of the year, typically falling within the low season, marks the market's lowest point. In this month, revenue might dip to $881, occupancy could drop to 13.3%, and ADRs may adjust down to $160.
- Understanding both the seasonal averages and these monthly peaks and troughs in revenue, occupancy, and ADR is crucial for maximizing your Airbnb profit potential in Bentong.
Seasonal Strategies for Maximizing Profit
- Peak Season: Maximize revenue through premium pricing and potentially longer minimum stays. Ensure high availability.
- Low Season: Offer competitive pricing, special promotions (e.g., extended stay discounts), and flexible cancellation policies. Target off-season travelers like remote workers or budget-conscious guests.
- Shoulder Seasons: Implement dynamic pricing that balances peak and low rates. Target weekend travelers or specific events. Offer slightly more flexible terms than peak season.
- Regularly analyze your own performance against these Bentong seasonality benchmarks and adjust your pricing and availability strategy accordingly.
Best Areas for Airbnb Investment in Bentong (2026)
Exploring the top neighborhoods for short-term rentals in Bentong? This section highlights key areas, outlining why they are attractive for hosts and guests, along with notable local attractions. Consider these locations based on your target guest profile and investment strategy.
| Neighborhood / Area | Why Host Here? (Target Guests & Appeal) | Key Attractions & Landmarks |
|---|---|---|
| Janda Baik | A popular weekend getaway spot close to nature, known for its cool climate, lush greenery, and outdoor activities. Ideal for travelers looking for a peaceful retreat from the city. | Janda Baik Nature Reserve, Chamang Waterfall, Eco-Adventure Resort, Hiking Trails, Local Food Stalls |
| Bentong Town | The main town in Bentong, offering a mix of local culture, shopping, and dining. Good for guests seeking authentic local experiences and accessibility to amenities. | Bentong Market, Chamang Waterfall, Pahang Street, Local Food Courts, Bentong Walk |
| Bukit Tinggi | Known for its charming French-themed village, this area attracts tourists seeking unique experiences and scenic views. Great for family-friendly stays. | Colmar Tropicale, Japanese Village, Botanical Garden, Horse Riding, Food and Craft Market |
| Berjaya Hills | A beautiful resort area offering a range of amenities including golf courses and luxury accommodations. Perfect for guests wanting an upscale experience. | Berjaya Hills Golf Club, The Chateau Spa & Organic Wellness Resort, Adventure Park, Nature Trails, Farming Experience |
| Sungai Lalang | A tranquil area by the river, attracting families and group retreats. Ideal for those looking for serene nature experiences and outdoor activities. | Sungai Lalang River, Camping Spots, Picnic Areas, Fishing Activities, Nature Walks |
| Gohtong Jaya | A host of attractions near Genting Highlands, this area is good for those interested in entertainment and leisure. Popular for day trips from the city. | Genting Highlands Theme Park, Skyway Cable Car, Shopping Mall, Casino, Nightlife |
| Kampung Bukit Tinggi | A traditional village known for its rural charm and hospitality, perfect for guests looking to immerse themselves in local culture. | Traditional Malay Houses, Local Handicrafts, Cultural Activities, Village Tours |
| Lurah Bilut | Known for its beautiful landscapes and agricultural activities, this area is perfect for eco-tourism and outdoor activities, attracting nature lovers. | Rice Fields, Orchard Tours, Nature Trails, Local Farms, Bird Watching |
Understanding Airbnb License Requirements & STR Laws in Bentong (2026)
While Bentong, Pahang, Malaysia currently shows low STR regulations, specific Airbnb license requirements might still exist or change. Always verify the latest short term rental regulations and Airbnb license requirements directly with local government authorities for Bentong to ensure full compliance before hosting.
(Source: AirROI data, 2026, based on 1% licensed listings)
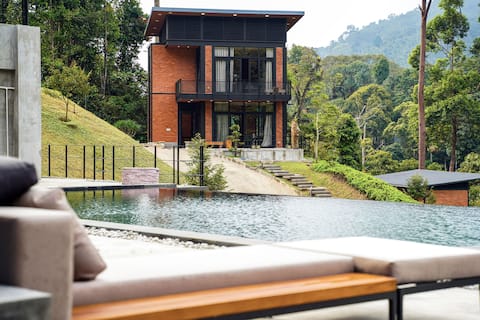
Top Performing Airbnb Properties in Bentong (2026)
Benchmark your potential! Explore examples of top-performing Airbnb properties in Bentongbased on Trailing Twelve Month (TTM) revenue. Analyze their characteristics, revenue, occupancy rate, and ADR to understand what drives success in this market.

Rainforest Luxury Retreat
Entire Place • 7 bedrooms

SumDay Villa, Good Widow
Entire Place • 6 bedrooms
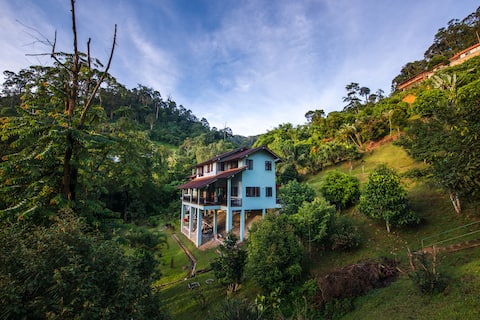
IKAN Residence | Hidden Gem Villa with Forest View
Entire Place • 6 bedrooms
Rest. Pause. Rainforest Retreat
Entire Place • 4 bedrooms
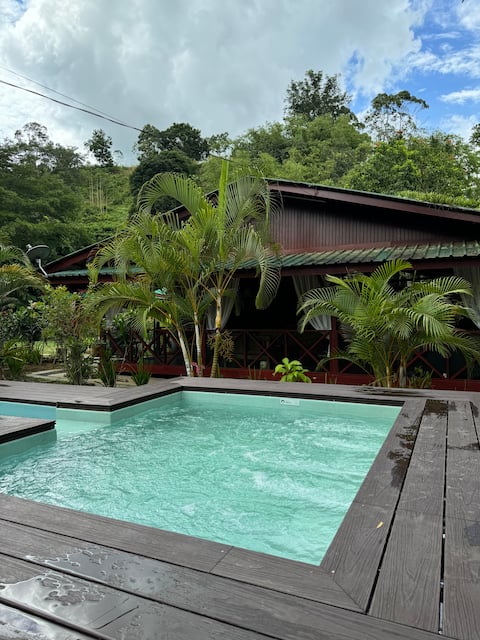
duapintu: Private Riverside Cottages in Kampung
Entire Place • 2 bedrooms
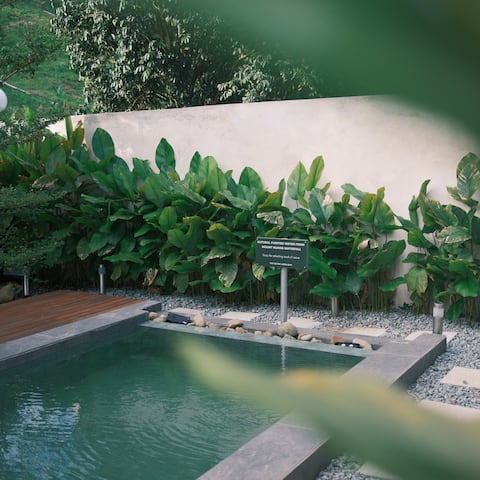
BRIC by The Hectar Private Pool Villa Janda Baik
Entire Place • 1 bedroom
Note: Performance varies based on location, size, amenities, seasonality, and management quality. Data reflects the past 12 months.
Top Performing Airbnb Hosts in Bentong (2026)
Learn from the best! This table showcases top-performing Airbnb hosts in Bentong based on the number of properties managed and estimated total revenue over the past year. Analyze their scale and performance metrics.
| Host Name | Properties | Grossing Revenue | Stay Reviews | Avg Rating |
|---|---|---|---|---|
| Gavin | 1 | $184,670 | 37 | 4.92/5.0 |
| Cherrie | 1 | $83,703 | 87 | 4.92/5.0 |
| Puncak Rimba | 9 | $82,227 | 195 | 4.75/5.0 |
| IKAN & Co. | 1 | $75,901 | 60 | 4.92/5.0 |
| Dorena | 1 | $54,883 | 308 | 4.88/5.0 |
| Trinity | 6 | $45,769 | 9 | 4.67/5.0 |
| Ben | 5 | $43,270 | 123 | 4.65/5.0 |
| Intan | 1 | $37,989 | 81 | 4.86/5.0 |
| Wan Az Aleesa | 1 | $23,573 | 20 | 4.90/5.0 |
| Ashton | 1 | $22,637 | 171 | 4.65/5.0 |
Analyzing the strategies of top hosts, such as their property selection, pricing, and guest communication, can offer valuable lessons for optimizing your own Airbnb operations in Bentong.
Dive Deeper: Advanced Bentong STR Market Data (2026)
Ready to unlock more insights? AirROI provides access to advanced metrics and comprehensive Airbnb data for Bentong. Explore detailed analytics beyond this report to refine your investment strategy, optimize pricing, and maximize your vacation rental profits.
Explore Advanced MetricsBentong Short-Term Rental Market Composition (2026): Property & Room Types
Room Type Distribution
Property Type Distribution
Market Composition Insights for Bentong
- The Bentong Airbnb market composition is heavily skewed towards Entire Home/Apt listings, which make up 83.2% of the 95 active rentals. This indicates strong guest preference for privacy and space.
- Looking at the property type distribution in Bentong, House properties are the most common (57.9%), reflecting the local real estate landscape.
- Houses represent a significant 57.9% portion, catering likely to families or larger groups.
- Smaller segments like hotel/boutique, others (combined 3.2%) offer potential for unique stay experiences.
Bentong Airbnb Room Capacity Analysis (2026): Bedroom Distribution
Distribution of Listings by Number of Bedrooms
Room Capacity Insights for Bentong
- The dominant room capacity in Bentong is 1 bedroom listings, making up 26.3% of the market. This suggests a strong demand for properties suitable for couples or solo travelers.
- Together, 1 bedroom and 2 bedrooms properties represent 49.5% of the active Airbnb listings in Bentong, indicating a high concentration in these sizes.
- A significant 47.4% of listings offer 3+ bedrooms, catering to larger groups and families seeking more space in Bentong.
Bentong Vacation Rental Guest Capacity Trends (2026)
Distribution of Listings by Guest Capacity
Guest Capacity Insights for Bentong
- The most common guest capacity trend in Bentong vacation rentals is listings accommodating 8+ guests (52.6%). This suggests the primary traveler segment is likely larger groups.
- Properties designed for 8+ guests and 4 guests dominate the Bentong STR market, accounting for 71.5% of listings.
- 60.0% of properties accommodate 6+ guests, serving the market segment for larger families or group travel in Bentong.
- On average, properties in Bentong are equipped to host 5.9 guests.
Bentong Airbnb Booking Patterns (2026): Available vs. Booked Days
Available Days Distribution
Booked Days Distribution
Booking Pattern Insights for Bentong
- The most common availability pattern in Bentong falls within the 271-366 days range, representing 87.4% of listings. This suggests many properties have significant open periods on their calendars.
- Approximately 99.0% of listings show high availability (181+ days open annually), indicating potential for increased bookings or specific owner usage patterns.
- For booked days, the 1-30 days range is most frequent in Bentong (43.2%), reflecting common guest stay durations or potential owner blocking patterns.
- A notable 2.2% of properties secure long booking periods (181+ days booked per year), highlighting successful long-term rental strategies or significant owner usage.
Bentong Airbnb Minimum Stay Requirements Analysis
Distribution of Listings by Minimum Night Requirement
1 Night
92 listings
96.8% of total
2 Nights
3 listings
3.2% of total
Key Insights
- The most prevalent minimum stay requirement in Bentong is 1 Night, adopted by 96.8% of listings. This highlights the market's preference for shorter, flexible bookings.
- A strong majority (100.0%) of the Bentong Airbnb data shows acceptance of very short stays (1-2 nights), indicating a dynamic, high-turnover market.
Recommendations
- Align with the market by considering a 1 Night minimum stay, as 96.8% of Bentong hosts use this setting.
- Adjust minimum nights based on seasonality – potentially shorter during low season and longer during peak demand periods in Bentong.
Bentong Airbnb Cancellation Policy Trends Analysis (2026)
Flexible
26 listings
28% of total
Moderate
30 listings
32.3% of total
Firm
26 listings
28% of total
Strict
11 listings
11.8% of total
Cancellation Policy Insights for Bentong
- The prevailing Airbnb cancellation policy trend in Bentong is Moderate, used by 32.3% of listings.
- There's a relatively balanced mix between guest-friendly (60.3%) and stricter (39.8%) policies, offering choices for different guest needs.
Recommendations for Hosts
- Consider adopting a Moderate policy to align with the 32.3% market standard in Bentong.
- Using a Strict policy might deter some guests, as only 11.8% of listings use it. Evaluate if potential revenue protection outweighs possible lower booking rates.
- Regularly review your cancellation policy against competitors and market demand shifts in Bentong.
Bentong STR Booking Lead Time Analysis (2026)
Average Booking Lead Time by Month
Booking Lead Time Insights for Bentong
- The overall average booking lead time for vacation rentals in Bentong is 44 days.
- Guests book furthest in advance for stays during November (average 65 days), likely coinciding with peak travel demand or local events.
- The shortest booking windows occur for stays in April (average 25 days), indicating more last-minute travel plans during this time.
- Seasonally, Fall (56 days avg.) sees the longest lead times, while Spring (28 days avg.) has the shortest, reflecting typical travel planning cycles.
Recommendations for Hosts
- Use the overall average lead time (44 days) as a baseline for your pricing and availability strategy in Bentong.
- For November stays, consider implementing length-of-stay discounts or slightly higher rates for bookings made less than 65 days out to capitalize on advance planning.
- Target marketing efforts for the Fall season well in advance (at least 56 days) to capture early planners.
- Monitor your own booking lead times against these Bentong averages to identify opportunities for dynamic pricing adjustments.
Popular & Essential Airbnb Amenities in Bentong (2026)
Amenity Prevalence
Amenity Insights for Bentong
- Popular amenities like Free parking on premises, Kitchen, Air conditioning are common but not universal. Offering these can provide a competitive edge.
- Warning: Wifi is not universally provided but is considered essential globally. Ensure reliable Wifi is offered.
Recommendations for Hosts
- Consider adding popular differentiators like Free parking on premises or Kitchen to increase appeal.
- Highlight unique or less common amenities you offer (e.g., hot tub, dedicated workspace, EV charger) in your listing description and photos.
- Regularly check competitor amenities in Bentong to stay competitive.
Bentong Airbnb Guest Demographics & Profile Analysis (2026)
Guest Profile Summary for Bentong
- The typical guest profile for Airbnb in Bentong consists of primarily domestic travelers (83%), often arriving from nearby Kuala Lumpur, typically belonging to the Post-2000s (Gen Z/Alpha) group (50%), primarily speaking English or Malay.
- Domestic travelers account for 83.3% of guests.
- Key international markets include Malaysia (83.3%) and Singapore (9.2%).
- Top languages spoken are English (43.9%) followed by Malay (26.5%).
- A significant demographic segment is the Post-2000s (Gen Z/Alpha) group, representing 50% of guests.
Recommendations for Hosts
- Target domestic marketing efforts towards travelers from Kuala Lumpur and Selangor.
- Tailor amenities and listing descriptions to appeal to the dominant Post-2000s (Gen Z/Alpha) demographic (e.g., highlight fast WiFi, smart home features, local guides).
- Highlight unique local experiences or amenities relevant to the primary guest profile.
- Consider seasonal promotions aligned with peak travel times for key origin markets.
Nearby Short-Term Rental Market Comparison
How does the Bentong Airbnb market stack up against its neighbors? Compare key performance metrics like average monthly revenue, ADR, and occupancy rates in surrounding areas to understand the broader regional STR landscape.
| Market | Active Properties | Monthly Revenue | Daily Rate | Avg. Occupancy |
|---|---|---|---|---|
| Genting Sempah | 16 | $5,194 | $590.69 | 32% |
| Kampung Janda Baik | 23 | $2,028 | $303.47 | 20% |
| Si Rusa | 11 | $1,834 | $247.46 | 23% |
| Jeram | 11 | $1,496 | $194.55 | 23% |
| Bukit Tinggi | 82 | $1,291 | $168.48 | 23% |
| Hulu Chemperuh Aboriginal Village | 17 | $1,250 | $182.99 | 26% |
| Kuala Sungai Baru | 13 | $1,093 | $156.49 | 22% |
| Pulau Sebang | 88 | $916 | $203.35 | 19% |
| Batang Kali | 13 | $912 | $146.11 | 17% |
| Kuala Kubu Bharu | 42 | $869 | $126.03 | 22% |