Balok Airbnb Market Analysis 2026: Short Term Rental Data & Vacation Rental Statistics in Pahang, Malaysia
Is Airbnb profitable in Balok in 2026? Explore comprehensive Airbnb analytics for Balok, Pahang, Malaysia to uncover income potential. This 2026 STR market report for Balok, based on AirROI data from February 2025 to January 2026, reveals key trends in the niche market of 42 active listings.
Whether you're considering an Airbnb investment in Balok, optimizing your existing vacation rental, or exploring rental arbitrage opportunities, understanding the Balok Airbnb data is crucial. Leveraging the low regulation environment is key to maximizing your short term rental income potential. Let's dive into the specifics.
Key Balok Airbnb Performance Metrics Overview
Monthly Airbnb Revenue Variations & Income Potential in Balok (2026)
Understanding the monthly revenue variations for Airbnb listings in Balok is key to maximizing your short term rental income potential. Seasonality significantly impacts earnings. Our analysis, based on data from the past 12 months, shows that the peak revenue month for STRs in Balok is typically February, while November often presents the lowest earnings, highlighting opportunities for strategic pricing adjustments during shoulder and low seasons. Explore the typical Airbnb income in Balok across different performance tiers:
- Best-in-class properties (Top 10%) achieve $1,215+ monthly, often utilizing dynamic pricing and superior guest experiences.
- Strong performing properties (Top 25%) earn $820 or more, indicating effective management and desirable locations/amenities.
- Typical properties (Median) generate around $435 per month, representing the average market performance.
- Entry-level properties (Bottom 25%) see earnings around $169, often with potential for optimization.
Average Monthly Airbnb Earnings Trend in Balok
Balok Airbnb Occupancy Rate Trends (2026)
Maximize your bookings by understanding the Balok STR occupancy trends. Seasonal demand shifts significantly influence how often properties are booked. Typically, Februarysees the highest demand (peak season occupancy), while March experiences the lowest (low season). Effective strategies, like adjusting minimum stays or offering promotions, can boost occupancy during slower periods. Here's how different property tiers perform in Balok:
- Best-in-class properties (Top 10%) achieve 51%+ occupancy, indicating high desirability and potentially optimized availability.
- Strong performing properties (Top 25%) maintain 37% or higher occupancy, suggesting good market fit and guest satisfaction.
- Typical properties (Median) have an occupancy rate around 21%.
- Entry-level properties (Bottom 25%) average 10% occupancy, potentially facing higher vacancy.
Average Monthly Occupancy Rate Trend in Balok
Average Daily Rate (ADR) Airbnb Trends in Balok (2026)
Effective short term rental pricing strategy in Balok involves understanding monthly ADR fluctuations. The Average Daily Rate (ADR) for Airbnb in Balok typically peaks in September and dips lowest during April. Leveraging Airbnb dynamic pricing tools or strategies based on this seasonality can significantly boost revenue. Here's a look at the typical nightly rates achieved:
- Best-in-class properties (Top 10%) command rates of $114+ per night, often due to premium features or locations.
- Strong performing properties (Top 25%) achieve nightly rates of $81 or more.
- Typical properties (Median) charge around $58 per night.
- Entry-level properties (Bottom 25%) earn around $47 per night.
Average Daily Rate (ADR) Trend by Month in Balok
Get Live Balok Market Intelligence 👇

Explore Real-time Analytics
Airbnb Seasonality Analysis & Trends in Balok (2026)
Peak Season (February, September, October)
- Revenue averages $948 per month
- Occupancy rates average 31.2%
- Daily rates average $80
Shoulder Season
- Revenue averages $732 per month
- Occupancy maintains around 24.0%
- Daily rates hold near $75
Low Season (January, June, November)
- Revenue drops to average $589 per month
- Occupancy decreases to average 23.5%
- Daily rates adjust to average $79
Seasonality Insights for Balok
- The Airbnb seasonality in Balok shows moderate seasonality with distinct peak and low periods. While the sections above show seasonal averages, it's also insightful to look at the extremes:
- During the high season, the absolute peak month showcases Balok's highest earning potential, with monthly revenues capable of climbing to $1,073, occupancy reaching a high of 36.3%, and ADRs peaking at $86.
- Conversely, the slowest single month of the year, typically falling within the low season, marks the market's lowest point. In this month, revenue might dip to $563, occupancy could drop to 20.6%, and ADRs may adjust down to $70.
- Understanding both the seasonal averages and these monthly peaks and troughs in revenue, occupancy, and ADR is crucial for maximizing your Airbnb profit potential in Balok.
Seasonal Strategies for Maximizing Profit
- Peak Season: Maximize revenue through premium pricing and potentially longer minimum stays. Ensure high availability.
- Low Season: Offer competitive pricing, special promotions (e.g., extended stay discounts), and flexible cancellation policies. Target off-season travelers like remote workers or budget-conscious guests.
- Shoulder Seasons: Implement dynamic pricing that balances peak and low rates. Target weekend travelers or specific events. Offer slightly more flexible terms than peak season.
- Regularly analyze your own performance against these Balok seasonality benchmarks and adjust your pricing and availability strategy accordingly.
Best Areas for Airbnb Investment in Balok (2026)
Exploring the top neighborhoods for short-term rentals in Balok? This section highlights key areas, outlining why they are attractive for hosts and guests, along with notable local attractions. Consider these locations based on your target guest profile and investment strategy.
| Neighborhood / Area | Why Host Here? (Target Guests & Appeal) | Key Attractions & Landmarks |
|---|---|---|
| Pantai Balok | A beautiful beach area known for its white sandy beaches and clear waters. Popular with families and tourists looking for a relaxing beach getaway with water sports activities. | Balok Beach, Water sports facilities, Beachfront restaurants, Sunset viewing spots, Campsites |
| Cherating | Famous for its cultural heritage and eco-tourism, Cherating offers a unique blend of relaxation and adventure. It attracts travelers interested in nature, surfing, and local crafts. | Cherating Beach, Surfing spots, Cherating Turtle Sanctuary, Local craft shops, Wildlife tours |
| Kuantan | As the state capital, Kuantan provides a mix of urban amenities and access to natural attractions. It's popular with business travelers and tourists alike. | Teluk Chempedak, Sungai Lembing, Kuantan River, Shopping malls, Cultural sites |
| Taman Gelora | A serene park area near the beach that is perfect for picnics and outdoor activities. Great for families looking for leisure activities and parks. | Gelora Park, Beach activities, Jogging trails, Picnic areas, Children's playgrounds |
| Bukit Gambang Resort City | A popular resort area with family-oriented attractions and a water park. Ideal for family gatherings and vacationing. | Bukit Gambang Water Park, Safari Park, Resort amenities, Adventure activities, Family entertainment |
| Sungai Lembing | Known for its tin mining history and beautiful nature, Sungai Lembing attracts those interested in historical tours and natural scenery. | Sungai Lembing Tin Mine, Rainbow Waterfall, Historical sites, Nature trails, Caves |
| Janda baik | Nestled in the hills, Janda Baik is famous for its cool climate and beautiful countryside. Perfect for eco-tourism and retreat holidays. | Waterfalls, Eco-resorts, Nature trails, Camping spots, Cultural experiences |
| Batu Hitam | A lovely coastal area with stunning beaches and a more laid-back atmosphere. Ideal for visitors looking for peace and tranquillity. | Batu Hitam Beach, Fishing spots, Local seafood, Relaxation spots, Scenic views |
Understanding Airbnb License Requirements & STR Laws in Balok (2026)
While Balok, Pahang, Malaysia currently shows low STR regulations, specific Airbnb license requirements might still exist or change. Always verify the latest short term rental regulations and Airbnb license requirements directly with local government authorities for Balok to ensure full compliance before hosting.
(Source: AirROI data, 2026, finding no licensed listings among those analyzed)
Top Performing Airbnb Properties in Balok (2026)
Benchmark your potential! Explore examples of top-performing Airbnb properties in Balokbased on Trailing Twelve Month (TTM) revenue. Analyze their characteristics, revenue, occupancy rate, and ADR to understand what drives success in this market.
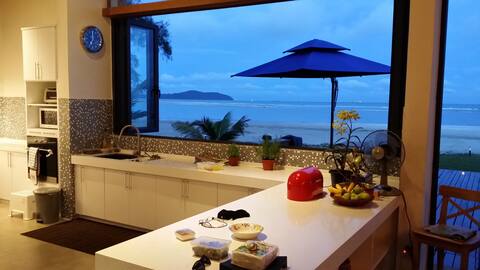
Beachfront VILLAKU RESIDENCES
Entire Place • 6 bedrooms
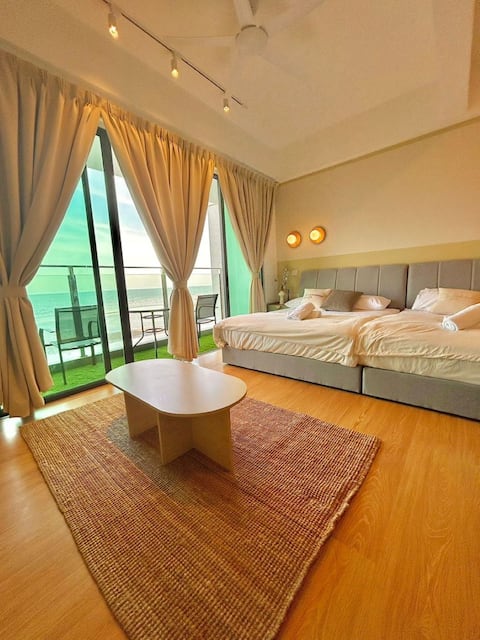
imperium residence kuantan sea view balcony 5pax A
Entire Place • 1 bedroom

imperium residence 2bedroom sea view suite 9 pax
Entire Place • 2 bedrooms

imperium residence 2bedroom city view 8pax
Entire Place • 2 bedrooms
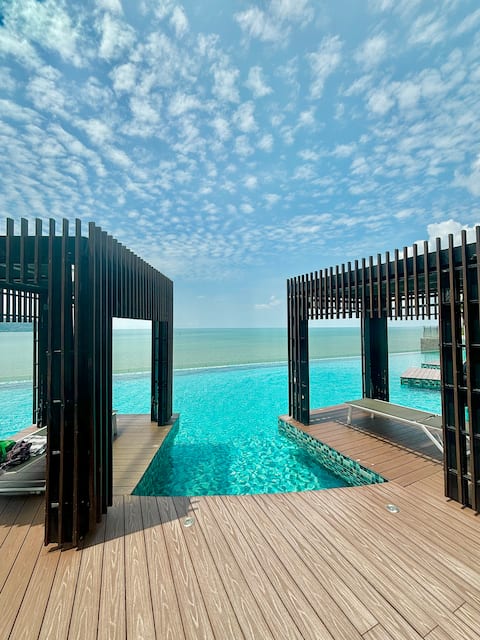
Beachside Pool Access 2BR2BA at Imperium | 6pax
Entire Place • 2 bedrooms

imperium residence kuantan sea view balcony 5pax
Entire Place • 1 bedroom
Note: Performance varies based on location, size, amenities, seasonality, and management quality. Data reflects the past 12 months.
Top Performing Airbnb Hosts in Balok (2026)
Learn from the best! This table showcases top-performing Airbnb hosts in Balok based on the number of properties managed and estimated total revenue over the past year. Analyze their scale and performance metrics.
| Host Name | Properties | Grossing Revenue | Stay Reviews | Avg Rating |
|---|---|---|---|---|
| Story House | 13 | $113,515 | 199 | 4.66/5.0 |
| Syed | 1 | $91,730 | 88 | 4.86/5.0 |
| Chuaa | 1 | $11,582 | 25 | 4.68/5.0 |
| Soon | 2 | $10,744 | 90 | 4.64/5.0 |
| Helen | 1 | $8,210 | 8 | 4.75/5.0 |
| Alia | 1 | $7,428 | 66 | 4.80/5.0 |
| Marcus Au | 1 | $5,840 | 51 | 4.82/5.0 |
| Yee | 2 | $4,748 | 65 | 4.57/5.0 |
| Rahimah | 1 | $4,625 | 27 | 4.81/5.0 |
| Rashidi | 1 | $3,632 | 8 | 5.00/5.0 |
Analyzing the strategies of top hosts, such as their property selection, pricing, and guest communication, can offer valuable lessons for optimizing your own Airbnb operations in Balok.
Dive Deeper: Advanced Balok STR Market Data (2026)
Ready to unlock more insights? AirROI provides access to advanced metrics and comprehensive Airbnb data for Balok. Explore detailed analytics beyond this report to refine your investment strategy, optimize pricing, and maximize your vacation rental profits.
Explore Advanced MetricsBalok Short-Term Rental Market Composition (2026): Property & Room Types
Room Type Distribution
Property Type Distribution
Market Composition Insights for Balok
- The Balok Airbnb market composition is heavily skewed towards Entire Home/Apt listings, which make up 95.2% of the 42 active rentals. This indicates strong guest preference for privacy and space.
- Looking at the property type distribution in Balok, Apartment/Condo properties are the most common (71.4%), reflecting the local real estate landscape.
- Houses represent a significant 28.6% portion, catering likely to families or larger groups.
Balok Airbnb Room Capacity Analysis (2026): Bedroom Distribution
Distribution of Listings by Number of Bedrooms
Room Capacity Insights for Balok
- The dominant room capacity in Balok is 1 bedroom listings, making up 47.6% of the market. This suggests a strong demand for properties suitable for couples or solo travelers.
- Together, 1 bedroom and 2 bedrooms properties represent 66.6% of the active Airbnb listings in Balok, indicating a high concentration in these sizes.
- A significant 23.8% of listings offer 3+ bedrooms, catering to larger groups and families seeking more space in Balok.
Balok Vacation Rental Guest Capacity Trends (2026)
Distribution of Listings by Guest Capacity
Guest Capacity Insights for Balok
- The most common guest capacity trend in Balok vacation rentals is listings accommodating 5 guests (26.2%). This suggests the primary traveler segment is likely larger groups.
- Properties designed for 5 guests and 8+ guests dominate the Balok STR market, accounting for 50.0% of listings.
- 49.9% of properties accommodate 6+ guests, serving the market segment for larger families or group travel in Balok.
- On average, properties in Balok are equipped to host 5.5 guests.
Balok Airbnb Booking Patterns (2026): Available vs. Booked Days
Available Days Distribution
Booked Days Distribution
Booking Pattern Insights for Balok
- The most common availability pattern in Balok falls within the 271-366 days range, representing 71.4% of listings. This suggests many properties have significant open periods on their calendars.
- Approximately 97.6% of listings show high availability (181+ days open annually), indicating potential for increased bookings or specific owner usage patterns.
- For booked days, the 31-90 days range is most frequent in Balok (38.1%), reflecting common guest stay durations or potential owner blocking patterns.
- A notable 2.4% of properties secure long booking periods (181+ days booked per year), highlighting successful long-term rental strategies or significant owner usage.
Balok Airbnb Minimum Stay Requirements Analysis
Distribution of Listings by Minimum Night Requirement
1 Night
41 listings
97.6% of total
30+ Nights
1 listings
2.4% of total
Key Insights
- The most prevalent minimum stay requirement in Balok is 1 Night, adopted by 97.6% of listings. This highlights the market's preference for shorter, flexible bookings.
- A strong majority (97.6%) of the Balok Airbnb data shows acceptance of very short stays (1-2 nights), indicating a dynamic, high-turnover market.
- Dedicated monthly rentals (30+ nights) represent a small niche (2.4%), possibly an untapped area for hosts.
Recommendations
- Align with the market by considering a 1 Night minimum stay, as 97.6% of Balok hosts use this setting.
- Adjust minimum nights based on seasonality – potentially shorter during low season and longer during peak demand periods in Balok.
Balok Airbnb Cancellation Policy Trends Analysis (2026)
Flexible
16 listings
38.1% of total
Moderate
12 listings
28.6% of total
Firm
10 listings
23.8% of total
Strict
4 listings
9.5% of total
Cancellation Policy Insights for Balok
- The prevailing Airbnb cancellation policy trend in Balok is Flexible, used by 38.1% of listings.
- There's a relatively balanced mix between guest-friendly (66.7%) and stricter (33.3%) policies, offering choices for different guest needs.
- Strict cancellation policies are quite rare (9.5%), potentially making listings with this policy less competitive unless justified by high demand or property type.
Recommendations for Hosts
- Consider adopting a Flexible policy to align with the 38.1% market standard in Balok.
- Using a Strict policy might deter some guests, as only 9.5% of listings use it. Evaluate if potential revenue protection outweighs possible lower booking rates.
- Regularly review your cancellation policy against competitors and market demand shifts in Balok.
Balok STR Booking Lead Time Analysis (2026)
Average Booking Lead Time by Month
Booking Lead Time Insights for Balok
- The overall average booking lead time for vacation rentals in Balok is 20 days.
- Guests book furthest in advance for stays during September (average 30 days), likely coinciding with peak travel demand or local events.
- The shortest booking windows occur for stays in June (average 16 days), indicating more last-minute travel plans during this time.
- Seasonally, Fall (23 days avg.) sees the longest lead times, while Winter (18 days avg.) has the shortest, reflecting typical travel planning cycles.
Recommendations for Hosts
- Use the overall average lead time (20 days) as a baseline for your pricing and availability strategy in Balok.
- Target marketing efforts for the Fall season well in advance (at least 23 days) to capture early planners.
- Monitor your own booking lead times against these Balok averages to identify opportunities for dynamic pricing adjustments.
Popular & Essential Airbnb Amenities in Balok (2026)
Amenity Prevalence
Amenity Insights for Balok
- Essential amenities in Balok that guests expect include: Free parking on premises. Lacking these (this) could significantly impact bookings.
- Popular amenities like Air conditioning, TV, Wifi are common but not universal. Offering these can provide a competitive edge.
- Warning: Wifi is not universally provided but is considered essential globally. Ensure reliable Wifi is offered.
Recommendations for Hosts
- Ensure your listing includes all essential amenities for Balok: Free parking on premises.
- Consider adding popular differentiators like Air conditioning or TV to increase appeal.
- Highlight unique or less common amenities you offer (e.g., hot tub, dedicated workspace, EV charger) in your listing description and photos.
- Regularly check competitor amenities in Balok to stay competitive.
Balok Airbnb Guest Demographics & Profile Analysis (2026)
Guest Profile Summary for Balok
- The typical guest profile for Airbnb in Balok consists of primarily domestic travelers (83%), often arriving from nearby Kuala Lumpur, typically belonging to the Post-2000s (Gen Z/Alpha) group (50%), primarily speaking English or Malay.
- Domestic travelers account for 83.2% of guests.
- Key international markets include Malaysia (83.2%) and Germany (5.6%).
- Top languages spoken are English (43.2%) followed by Malay (36.4%).
- A significant demographic segment is the Post-2000s (Gen Z/Alpha) group, representing 50% of guests.
Recommendations for Hosts
- Target domestic marketing efforts towards travelers from Kuala Lumpur and Selangor.
- Tailor amenities and listing descriptions to appeal to the dominant Post-2000s (Gen Z/Alpha) demographic (e.g., highlight fast WiFi, smart home features, local guides).
- Highlight unique local experiences or amenities relevant to the primary guest profile.
- Consider seasonal promotions aligned with peak travel times for key origin markets.
Nearby Short-Term Rental Market Comparison
How does the Balok Airbnb market stack up against its neighbors? Compare key performance metrics like average monthly revenue, ADR, and occupancy rates in surrounding areas to understand the broader regional STR landscape.
| Market | Active Properties | Monthly Revenue | Daily Rate | Avg. Occupancy |
|---|---|---|---|---|
| Kuala Sungai Baru | 13 | $1,093 | $156.49 | 22% |
| Pulau Sebang | 88 | $916 | $203.35 | 19% |
| Pahang | 26 | $800 | $152.46 | 20% |
| Alor Gajah | 95 | $659 | $146.75 | 18% |
| Jasin | 40 | $608 | $123.36 | 18% |
| Kampung Bukit Payung | 10 | $539 | $164.67 | 20% |
| Hang Tuah Jaya Municipal Council | 60 | $532 | $121.53 | 17% |
| Melaka | 32 | $520 | $112.64 | 17% |
| Malacca City | 2,829 | $505 | $89.09 | 22% |
| Masjid Tanah | 31 | $458 | $103.53 | 17% |