Kota Bharu Airbnb Market Analysis 2026: Short Term Rental Data & Vacation Rental Statistics in Kelantan, Malaysia
Is Airbnb profitable in Kota Bharu in 2026? Explore comprehensive Airbnb analytics for Kota Bharu, Kelantan, Malaysia to uncover income potential. This 2026 STR market report for Kota Bharu, based on AirROI data from February 2025 to January 2026, reveals key trends in the market of 443 active listings.
Whether you're considering an Airbnb investment in Kota Bharu, optimizing your existing vacation rental, or exploring rental arbitrage opportunities, understanding the Kota Bharu Airbnb data is crucial. Leveraging the low regulation environment is key to maximizing your short term rental income potential. Let's dive into the specifics.
Key Kota Bharu Airbnb Performance Metrics Overview
Monthly Airbnb Revenue Variations & Income Potential in Kota Bharu (2026)
Understanding the monthly revenue variations for Airbnb listings in Kota Bharu is key to maximizing your short term rental income potential. Seasonality significantly impacts earnings. Our analysis, based on data from the past 12 months, shows that the peak revenue month for STRs in Kota Bharu is typically September, while March often presents the lowest earnings, highlighting opportunities for strategic pricing adjustments during shoulder and low seasons. Explore the typical Airbnb income in Kota Bharu across different performance tiers:
- Best-in-class properties (Top 10%) achieve $733+ monthly, often utilizing dynamic pricing and superior guest experiences.
- Strong performing properties (Top 25%) earn $471 or more, indicating effective management and desirable locations/amenities.
- Typical properties (Median) generate around $264 per month, representing the average market performance.
- Entry-level properties (Bottom 25%) see earnings around $137, often with potential for optimization.
Average Monthly Airbnb Earnings Trend in Kota Bharu
Kota Bharu Airbnb Occupancy Rate Trends (2026)
Maximize your bookings by understanding the Kota Bharu STR occupancy trends. Seasonal demand shifts significantly influence how often properties are booked. Typically, Septembersees the highest demand (peak season occupancy), while March experiences the lowest (low season). Effective strategies, like adjusting minimum stays or offering promotions, can boost occupancy during slower periods. Here's how different property tiers perform in Kota Bharu:
- Best-in-class properties (Top 10%) achieve 43%+ occupancy, indicating high desirability and potentially optimized availability.
- Strong performing properties (Top 25%) maintain 30% or higher occupancy, suggesting good market fit and guest satisfaction.
- Typical properties (Median) have an occupancy rate around 17%.
- Entry-level properties (Bottom 25%) average 10% occupancy, potentially facing higher vacancy.
Average Monthly Occupancy Rate Trend in Kota Bharu
Average Daily Rate (ADR) Airbnb Trends in Kota Bharu (2026)
Effective short term rental pricing strategy in Kota Bharu involves understanding monthly ADR fluctuations. The Average Daily Rate (ADR) for Airbnb in Kota Bharu typically peaks in January and dips lowest during March. Leveraging Airbnb dynamic pricing tools or strategies based on this seasonality can significantly boost revenue. Here's a look at the typical nightly rates achieved:
- Best-in-class properties (Top 10%) command rates of $85+ per night, often due to premium features or locations.
- Strong performing properties (Top 25%) achieve nightly rates of $64 or more.
- Typical properties (Median) charge around $50 per night.
- Entry-level properties (Bottom 25%) earn around $37 per night.
Average Daily Rate (ADR) Trend by Month in Kota Bharu
Get Live Kota Bharu Market Intelligence 👇

Explore Real-time Analytics
Airbnb Seasonality Analysis & Trends in Kota Bharu (2026)
Peak Season (September, July, June)
- Revenue averages $430 per month
- Occupancy rates average 25.9%
- Daily rates average $57
Shoulder Season
- Revenue averages $350 per month
- Occupancy maintains around 20.9%
- Daily rates hold near $58
Low Season (March, April, November)
- Revenue drops to average $289 per month
- Occupancy decreases to average 18.8%
- Daily rates adjust to average $56
Seasonality Insights for Kota Bharu
- The Airbnb seasonality in Kota Bharu shows moderate seasonality with distinct peak and low periods. While the sections above show seasonal averages, it's also insightful to look at the extremes:
- During the high season, the absolute peak month showcases Kota Bharu's highest earning potential, with monthly revenues capable of climbing to $458, occupancy reaching a high of 27.3%, and ADRs peaking at $60.
- Conversely, the slowest single month of the year, typically falling within the low season, marks the market's lowest point. In this month, revenue might dip to $259, occupancy could drop to 15.7%, and ADRs may adjust down to $55.
- Understanding both the seasonal averages and these monthly peaks and troughs in revenue, occupancy, and ADR is crucial for maximizing your Airbnb profit potential in Kota Bharu.
Seasonal Strategies for Maximizing Profit
- Peak Season: Maximize revenue through premium pricing and potentially longer minimum stays. Ensure high availability.
- Low Season: Offer competitive pricing, special promotions (e.g., extended stay discounts), and flexible cancellation policies. Target off-season travelers like remote workers or budget-conscious guests.
- Shoulder Seasons: Implement dynamic pricing that balances peak and low rates. Target weekend travelers or specific events. Offer slightly more flexible terms than peak season.
- Regularly analyze your own performance against these Kota Bharu seasonality benchmarks and adjust your pricing and availability strategy accordingly.
Best Areas for Airbnb Investment in Kota Bharu (2026)
Exploring the top neighborhoods for short-term rentals in Kota Bharu? This section highlights key areas, outlining why they are attractive for hosts and guests, along with notable local attractions. Consider these locations based on your target guest profile and investment strategy.
| Neighborhood / Area | Why Host Here? (Target Guests & Appeal) | Key Attractions & Landmarks |
|---|---|---|
| Kampung Kraftangan | Cultural hub showcasing traditional crafts and local heritage. Attracts tourists interested in local art and culture, making it a good location for cultural Airbnb stays. | Kampung Kraftangan, Siti Khadijah Market, Kelantan State Museum, Batu Caves, Handicraft Village |
| Pantai Cahaya Bulan | Famous beach location known for its stunning sunsets and beach activities. Ideal for tourists looking to relax by the beach with various water sports and dining options available. | Pantai Cahaya Bulan Beach, Beachfront Restaurants, Fishing Village, Water Sports Activities, Sunset Viewing Spots |
| Kota Bharu City Centre | The vibrant heart of Kota Bharu with easy access to shopping, dining, and local attractions. Perfect for travelers wanting to be in the center of it all. | Kota Bharu Central Market, Siti Khadijah Market, Kota Bharu Mall, Bus Station, Local eateries |
| Kampung Durian Burung | A tranquil village area showcasing rural Kelantan. Great for those wanting an authentic local experience away from city life. | Rice Fields, Traditional Villages, Local Homestays, Nature Walks, Cultural Experiences |
| Jalan Langgar | Known for its historical landmarks and old-world charm. A good area for tourists interested in the history of Kota Bharu and its architecture. | Wakaf Siti Khadijah, Istana Jahar, Kadok Palace, Sultan Muhammad IV Stadium |
| Pasir Mas | Nearby town known for its local markets and food scene. It draws visitors looking to experience the local lifestyle and gastronomy. | Pasir Mas Market, Local Food Stalls, Traditional Crafts |
| Tumpat | A district known for its proximity to the Thai border and local cultural experiences. It attracts visitors interested in exploring nearby attractions. | Pengkalan Kubor, Cultural Festivals, Buddhist Temples |
| Gua Musang | A bit farther from Kota Bharu, known for its limestone caves and eco-tourism. Ideal for nature lovers and adventure seekers. | Gua Musang Caves, Nature Trails, Temenggor Lake |
Understanding Airbnb License Requirements & STR Laws in Kota Bharu (2026)
While Kota Bharu, Kelantan, Malaysia currently shows low STR regulations, specific Airbnb license requirements might still exist or change. Always verify the latest short term rental regulations and Airbnb license requirements directly with local government authorities for Kota Bharu to ensure full compliance before hosting.
(Source: AirROI data, 2026, based on 1% licensed listings)
Top Performing Airbnb Properties in Kota Bharu (2026)
Benchmark your potential! Explore examples of top-performing Airbnb properties in Kota Bharubased on Trailing Twelve Month (TTM) revenue. Analyze their characteristics, revenue, occupancy rate, and ADR to understand what drives success in this market.

Stylish Queen Comfort Near Siti Khadijah Market
Private Room • 1 bedroom
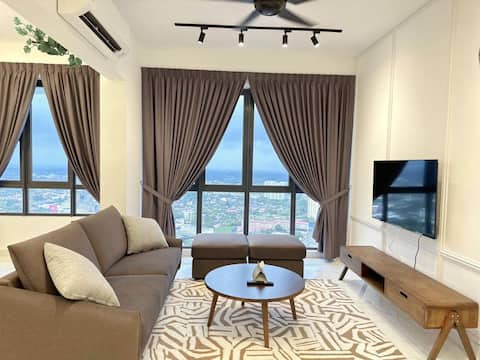
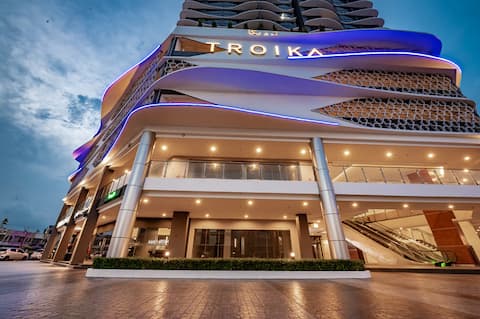
Troika Kota Bharu Penthouse L35
Entire Place • 3 bedrooms

Ruma Jalan Raja Dewa - Kota Bharu
Entire Place • 4 bedrooms

HF PCB Homestay Private Pool
Entire Place • 4 bedrooms
Netflix Two Bedroom Troika Kota Bharu Homestay 118
Entire Place • 2 bedrooms

Netflix Two Bedroom Troika Kota Bharu Homestay 182
Entire Place • 2 bedrooms
Note: Performance varies based on location, size, amenities, seasonality, and management quality. Data reflects the past 12 months.
Top Performing Airbnb Hosts in Kota Bharu (2026)
Learn from the best! This table showcases top-performing Airbnb hosts in Kota Bharu based on the number of properties managed and estimated total revenue over the past year. Analyze their scale and performance metrics.
| Host Name | Properties | Grossing Revenue | Stay Reviews | Avg Rating |
|---|---|---|---|---|
| Cheong | 36 | $143,326 | 609 | 4.81/5.0 |
| Ricky | 22 | $89,238 | 670 | 4.62/5.0 |
| Troika Kota Bharu Homestay | 5 | $51,088 | 248 | 4.69/5.0 |
| Kelmedic | 6 | $46,741 | 65 | 4.66/5.0 |
| Stephanie | 27 | $36,245 | 466 | 4.52/5.0 |
| Eternity | 3 | $20,025 | 416 | 4.89/5.0 |
| Nurul Syafikah | 10 | $17,913 | 352 | 4.66/5.0 |
| Fara | 4 | $16,684 | 109 | 4.96/5.0 |
| Zara | 1 | $16,226 | 1 | Not Rated |
| Syarif | 4 | $16,220 | 147 | 4.79/5.0 |
Analyzing the strategies of top hosts, such as their property selection, pricing, and guest communication, can offer valuable lessons for optimizing your own Airbnb operations in Kota Bharu.
Dive Deeper: Advanced Kota Bharu STR Market Data (2026)
Ready to unlock more insights? AirROI provides access to advanced metrics and comprehensive Airbnb data for Kota Bharu. Explore detailed analytics beyond this report to refine your investment strategy, optimize pricing, and maximize your vacation rental profits.
Explore Advanced MetricsKota Bharu Short-Term Rental Market Composition (2026): Property & Room Types
Room Type Distribution
Property Type Distribution
Market Composition Insights for Kota Bharu
- The Kota Bharu Airbnb market composition is heavily skewed towards Entire Home/Apt listings, which make up 91% of the 443 active rentals. This indicates strong guest preference for privacy and space.
- Looking at the property type distribution in Kota Bharu, Apartment/Condo properties are the most common (53.7%), reflecting the local real estate landscape.
- Houses represent a significant 37.2% portion, catering likely to families or larger groups.
- The presence of 7.7% Hotel/Boutique listings indicates integration with traditional hospitality.
- Smaller segments like others, outdoor/unique (combined 1.3%) offer potential for unique stay experiences.
Kota Bharu Airbnb Room Capacity Analysis (2026): Bedroom Distribution
Distribution of Listings by Number of Bedrooms
Room Capacity Insights for Kota Bharu
- The dominant room capacity in Kota Bharu is 1 bedroom listings, making up 28.7% of the market. This suggests a strong demand for properties suitable for couples or solo travelers.
- Together, 1 bedroom and 3 bedrooms properties represent 53.1% of the active Airbnb listings in Kota Bharu, indicating a high concentration in these sizes.
- A significant 39.1% of listings offer 3+ bedrooms, catering to larger groups and families seeking more space in Kota Bharu.
Kota Bharu Vacation Rental Guest Capacity Trends (2026)
Distribution of Listings by Guest Capacity
Guest Capacity Insights for Kota Bharu
- The most common guest capacity trend in Kota Bharu vacation rentals is listings accommodating 8+ guests (31.8%). This suggests the primary traveler segment is likely larger groups.
- Properties designed for 8+ guests and 4 guests dominate the Kota Bharu STR market, accounting for 52.3% of listings.
- 49.6% of properties accommodate 6+ guests, serving the market segment for larger families or group travel in Kota Bharu.
- On average, properties in Kota Bharu are equipped to host 5.4 guests.
Kota Bharu Airbnb Booking Patterns (2026): Available vs. Booked Days
Available Days Distribution
Booked Days Distribution
Booking Pattern Insights for Kota Bharu
- The most common availability pattern in Kota Bharu falls within the 271-366 days range, representing 85.1% of listings. This suggests many properties have significant open periods on their calendars.
- Approximately 99.3% of listings show high availability (181+ days open annually), indicating potential for increased bookings or specific owner usage patterns.
- For booked days, the 31-90 days range is most frequent in Kota Bharu (42%), reflecting common guest stay durations or potential owner blocking patterns.
- A notable 0.7% of properties secure long booking periods (181+ days booked per year), highlighting successful long-term rental strategies or significant owner usage.
Kota Bharu Airbnb Minimum Stay Requirements Analysis
Distribution of Listings by Minimum Night Requirement
1 Night
408 listings
92.1% of total
2 Nights
27 listings
6.1% of total
30+ Nights
8 listings
1.8% of total
Key Insights
- The most prevalent minimum stay requirement in Kota Bharu is 1 Night, adopted by 92.1% of listings. This highlights the market's preference for shorter, flexible bookings.
- A strong majority (98.2%) of the Kota Bharu Airbnb data shows acceptance of very short stays (1-2 nights), indicating a dynamic, high-turnover market.
- Dedicated monthly rentals (30+ nights) represent a small niche (1.8%), possibly an untapped area for hosts.
Recommendations
- Align with the market by considering a 1 Night minimum stay, as 92.1% of Kota Bharu hosts use this setting.
- Adjust minimum nights based on seasonality – potentially shorter during low season and longer during peak demand periods in Kota Bharu.
Kota Bharu Airbnb Cancellation Policy Trends Analysis (2026)
Flexible
265 listings
60.1% of total
Moderate
104 listings
23.6% of total
Firm
52 listings
11.8% of total
Strict
20 listings
4.5% of total
Cancellation Policy Insights for Kota Bharu
- The prevailing Airbnb cancellation policy trend in Kota Bharu is Flexible, used by 60.1% of listings.
- The market strongly favors guest-friendly terms, with 83.7% of listings offering Flexible or Moderate policies. This suggests guests in Kota Bharu may expect booking flexibility.
- Strict cancellation policies are quite rare (4.5%), potentially making listings with this policy less competitive unless justified by high demand or property type.
Recommendations for Hosts
- Consider adopting a Flexible policy to align with the 60.1% market standard in Kota Bharu.
- Given the high prevalence of Flexible policies (60.1%), offering this can enhance booking appeal, especially during shoulder seasons.
- Using a Strict policy might deter some guests, as only 4.5% of listings use it. Evaluate if potential revenue protection outweighs possible lower booking rates.
- Regularly review your cancellation policy against competitors and market demand shifts in Kota Bharu.
Kota Bharu STR Booking Lead Time Analysis (2026)
Average Booking Lead Time by Month
Booking Lead Time Insights for Kota Bharu
- The overall average booking lead time for vacation rentals in Kota Bharu is 30 days.
- Guests book furthest in advance for stays during March (average 53 days), likely coinciding with peak travel demand or local events.
- The shortest booking windows occur for stays in December (average 17 days), indicating more last-minute travel plans during this time.
- Seasonally, Spring (35 days avg.) sees the longest lead times, while Winter (21 days avg.) has the shortest, reflecting typical travel planning cycles.
Recommendations for Hosts
- Use the overall average lead time (30 days) as a baseline for your pricing and availability strategy in Kota Bharu.
- For March stays, consider implementing length-of-stay discounts or slightly higher rates for bookings made less than 53 days out to capitalize on advance planning.
- Target marketing efforts for the Spring season well in advance (at least 35 days) to capture early planners.
- Monitor your own booking lead times against these Kota Bharu averages to identify opportunities for dynamic pricing adjustments.
Popular & Essential Airbnb Amenities in Kota Bharu (2026)
Amenity Prevalence
Amenity Insights for Kota Bharu
- Essential amenities in Kota Bharu that guests expect include: Air conditioning, TV, Free parking on premises. Lacking these (any) could significantly impact bookings.
- Popular amenities like Iron, Wifi, Kitchen are common but not universal. Offering these can provide a competitive edge.
- Warning: Wifi is not universally provided but is considered essential globally. Ensure reliable Wifi is offered.
Recommendations for Hosts
- Ensure your listing includes all essential amenities for Kota Bharu: Air conditioning, TV, Free parking on premises.
- Prioritize adding missing essentials: Air conditioning, TV, Free parking on premises.
- Consider adding popular differentiators like Iron or Wifi to increase appeal.
- Highlight unique or less common amenities you offer (e.g., hot tub, dedicated workspace, EV charger) in your listing description and photos.
- Regularly check competitor amenities in Kota Bharu to stay competitive.
Kota Bharu Airbnb Guest Demographics & Profile Analysis (2026)
Guest Profile Summary for Kota Bharu
- The typical guest profile for Airbnb in Kota Bharu consists of primarily domestic travelers (87%), often arriving from nearby Kuala Lumpur, typically belonging to the Post-2000s (Gen Z/Alpha) group (50%), primarily speaking English or Malay.
- Domestic travelers account for 87.2% of guests.
- Key international markets include Malaysia (87.2%) and Singapore (2.2%).
- Top languages spoken are English (44.1%) followed by Malay (39.5%).
- A significant demographic segment is the Post-2000s (Gen Z/Alpha) group, representing 50% of guests.
Recommendations for Hosts
- Target domestic marketing efforts towards travelers from Kuala Lumpur and Selangor.
- Tailor amenities and listing descriptions to appeal to the dominant Post-2000s (Gen Z/Alpha) demographic (e.g., highlight fast WiFi, smart home features, local guides).
- Highlight unique local experiences or amenities relevant to the primary guest profile.
- Consider seasonal promotions aligned with peak travel times for key origin markets.
Nearby Short-Term Rental Market Comparison
How does the Kota Bharu Airbnb market stack up against its neighbors? Compare key performance metrics like average monthly revenue, ADR, and occupancy rates in surrounding areas to understand the broader regional STR landscape.
| Market | Active Properties | Monthly Revenue | Daily Rate | Avg. Occupancy |
|---|---|---|---|---|
| Pulau Perhentian Kecil | 10 | $1,354 | $101.42 | 60% |
| Kampung Rhu Muda | 10 | $719 | $75.08 | 32% |
| Besut | 10 | $615 | $100.83 | 45% |
| Kampung Seberang Takir Hulu | 12 | $521 | $65.59 | 25% |
| Gong Dato | 16 | $462 | $84.39 | 31% |
| Kampung Tanjung Angsa | 26 | $392 | $143.77 | 24% |
| Kampung Air Leleh | 19 | $350 | $69.30 | 21% |
| Kuala Terengganu | 366 | $347 | $73.96 | 21% |
| Betong | 31 | $319 | $73.18 | 16% |
| Kampung Seberang Takir | 17 | $307 | $65.80 | 22% |