Langkawi Airbnb Market Analysis 2026: Short Term Rental Data & Vacation Rental Statistics in Kedah, Malaysia
Is Airbnb profitable in Langkawi in 2026? Explore comprehensive Airbnb analytics for Langkawi, Kedah, Malaysia to uncover income potential. This 2026 STR market report for Langkawi, based on AirROI data from February 2025 to January 2026, reveals key trends in the niche market of 198 active listings.
Whether you're considering an Airbnb investment in Langkawi, optimizing your existing vacation rental, or exploring rental arbitrage opportunities, understanding the Langkawi Airbnb data is crucial. Leveraging the low regulation environment is key to maximizing your short term rental income potential. Let's dive into the specifics.
Key Langkawi Airbnb Performance Metrics Overview
Monthly Airbnb Revenue Variations & Income Potential in Langkawi (2026)
Understanding the monthly revenue variations for Airbnb listings in Langkawi is key to maximizing your short term rental income potential. Seasonality significantly impacts earnings. Our analysis, based on data from the past 12 months, shows that the peak revenue month for STRs in Langkawi is typically August, while November often presents the lowest earnings, highlighting opportunities for strategic pricing adjustments during shoulder and low seasons. Explore the typical Airbnb income in Langkawi across different performance tiers:
- Best-in-class properties (Top 10%) achieve $3,564+ monthly, often utilizing dynamic pricing and superior guest experiences.
- Strong performing properties (Top 25%) earn $1,748 or more, indicating effective management and desirable locations/amenities.
- Typical properties (Median) generate around $877 per month, representing the average market performance.
- Entry-level properties (Bottom 25%) see earnings around $425, often with potential for optimization.
Average Monthly Airbnb Earnings Trend in Langkawi
Langkawi Airbnb Occupancy Rate Trends (2026)
Maximize your bookings by understanding the Langkawi STR occupancy trends. Seasonal demand shifts significantly influence how often properties are booked. Typically, Decembersees the highest demand (peak season occupancy), while May experiences the lowest (low season). Effective strategies, like adjusting minimum stays or offering promotions, can boost occupancy during slower periods. Here's how different property tiers perform in Langkawi:
- Best-in-class properties (Top 10%) achieve 72%+ occupancy, indicating high desirability and potentially optimized availability.
- Strong performing properties (Top 25%) maintain 52% or higher occupancy, suggesting good market fit and guest satisfaction.
- Typical properties (Median) have an occupancy rate around 31%.
- Entry-level properties (Bottom 25%) average 16% occupancy, potentially facing higher vacancy.
Average Monthly Occupancy Rate Trend in Langkawi
Average Daily Rate (ADR) Airbnb Trends in Langkawi (2026)
Effective short term rental pricing strategy in Langkawi involves understanding monthly ADR fluctuations. The Average Daily Rate (ADR) for Airbnb in Langkawi typically peaks in December and dips lowest during April. Leveraging Airbnb dynamic pricing tools or strategies based on this seasonality can significantly boost revenue. Here's a look at the typical nightly rates achieved:
- Best-in-class properties (Top 10%) command rates of $257+ per night, often due to premium features or locations.
- Strong performing properties (Top 25%) achieve nightly rates of $149 or more.
- Typical properties (Median) charge around $81 per night.
- Entry-level properties (Bottom 25%) earn around $50 per night.
Average Daily Rate (ADR) Trend by Month in Langkawi
Get Live Langkawi Market Intelligence 👇

Explore Real-time Analytics
Airbnb Seasonality Analysis & Trends in Langkawi (2026)
Peak Season (August, December, July)
- Revenue averages $1,727 per month
- Occupancy rates average 41.3%
- Daily rates average $119
Shoulder Season
- Revenue averages $1,417 per month
- Occupancy maintains around 34.5%
- Daily rates hold near $119
Low Season (April, September, November)
- Revenue drops to average $1,330 per month
- Occupancy decreases to average 33.1%
- Daily rates adjust to average $118
Seasonality Insights for Langkawi
- The Airbnb seasonality in Langkawi shows moderate seasonality with distinct peak and low periods. While the sections above show seasonal averages, it's also insightful to look at the extremes:
- During the high season, the absolute peak month showcases Langkawi's highest earning potential, with monthly revenues capable of climbing to $1,824, occupancy reaching a high of 43.1%, and ADRs peaking at $128.
- Conversely, the slowest single month of the year, typically falling within the low season, marks the market's lowest point. In this month, revenue might dip to $1,305, occupancy could drop to 30.3%, and ADRs may adjust down to $113.
- Understanding both the seasonal averages and these monthly peaks and troughs in revenue, occupancy, and ADR is crucial for maximizing your Airbnb profit potential in Langkawi.
Seasonal Strategies for Maximizing Profit
- Peak Season: Maximize revenue through premium pricing and potentially longer minimum stays. Ensure high availability.
- Low Season: Offer competitive pricing, special promotions (e.g., extended stay discounts), and flexible cancellation policies. Target off-season travelers like remote workers or budget-conscious guests.
- Shoulder Seasons: Implement dynamic pricing that balances peak and low rates. Target weekend travelers or specific events. Offer slightly more flexible terms than peak season.
- Regularly analyze your own performance against these Langkawi seasonality benchmarks and adjust your pricing and availability strategy accordingly.
Best Areas for Airbnb Investment in Langkawi (2026)
Exploring the top neighborhoods for short-term rentals in Langkawi? This section highlights key areas, outlining why they are attractive for hosts and guests, along with notable local attractions. Consider these locations based on your target guest profile and investment strategy.
| Neighborhood / Area | Why Host Here? (Target Guests & Appeal) | Key Attractions & Landmarks |
|---|---|---|
| Pantai Cenang | The most popular beach in Langkawi, known for its stunning sunsets, vibrant nightlife, and a plethora of dining and entertainment options. Ideal for tourists seeking a lively beach atmosphere with numerous water sports. | Underwater World Langkawi, Langkawi Sky Bridge, Tanjung Rhu Beach, Cenang Mall, Cenang Street Night Market, Jet Ski Tours |
| Kuah Town | Langkawi's main town and a gateway for tourists, featuring a range of shopping options, dining, and cultural experiences. Great for visitors seeking convenience and local experiences. | Eagle Square, Langkawi Fair Shopping Mall, Taman Lagenda, Langkawi Night Market, Hotel and Spa options |
| Datai Bay | A luxurious area known for its high-end resorts and stunning natural beauty. Perfect for those looking for a serene and upscale retreat in a beautiful setting. | The Datai Langkawi Resort, Datai Bay Beach, Mangrove Tours, Nature walks, Lotus Cafe |
| Kilim Geoforest Park | A UNESCO-listed park featuring breathtaking mangroves, wildlife, and eco-tourism activities. A top spot for nature lovers and adventure seekers looking to explore Langkawi's natural beauty. | Mangrove Tours, Kilim River, Wildlife spotting, Kilim Geoforest Park Jet Ski, Penyu Island |
| Tanjung Rhu | Known for its quiet, secluded beaches and natural beauty, Tanjung Rhu is perfect for travelers looking for tranquility and picturesque landscapes. | Tanjung Rhu Beach, Pulau Lalang, Tanjung Rhu Resort, Sunset views, Kayaking |
| Langkawi Cable Car | An iconic attraction offering stunning panoramic views of Langkawi. Ideal for tourists looking for breathtaking sights and adventure. | Langkawi Cable Car, Sky Bridge, Oriental Village, Horse Riding, Zipline |
| Temurun Waterfall | A hidden gem in Langkawi, perfect for nature enthusiasts. Offers picturesque views, swimming opportunities, and hiking. | Temurun Waterfall, Trekking Trails, Swimming Spots, Natural scenery, Picnic areas |
| Pulau Payar Marine Park | An incredible destination for snorkeling and diving. Attracts those looking to explore marine life and enjoy water sports in a stunning setting. | Snorkeling, Diving, Marine life, Beach visits, Island hopping |
Understanding Airbnb License Requirements & STR Laws in Langkawi (2026)
While Langkawi, Kedah, Malaysia currently shows low STR regulations, specific Airbnb license requirements might still exist or change. Always verify the latest short term rental regulations and Airbnb license requirements directly with local government authorities for Langkawi to ensure full compliance before hosting.
(Source: AirROI data, 2026, finding no licensed listings among those analyzed)
Top Performing Airbnb Properties in Langkawi (2026)
Benchmark your potential! Explore examples of top-performing Airbnb properties in Langkawibased on Trailing Twelve Month (TTM) revenue. Analyze their characteristics, revenue, occupancy rate, and ADR to understand what drives success in this market.
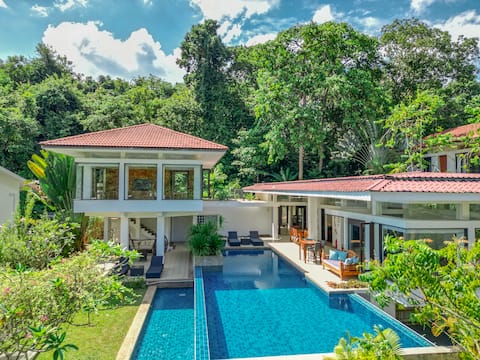
Villa 4 - Luxury Private Pool Villa
Entire Place • 4 bedrooms

2BR paddy field view villa with private pool
Entire Place • 2 bedrooms

Traditional Malay 2 Villas with Private Pool
Entire Place • 4 bedrooms

Villa Vista - Ultra-Luxury Private Pool Villa
Entire Place • 5 bedrooms
Bohoq Villa, Langkawi
Entire Place • 3 bedrooms
Villa 7 - Luxury Private Pool Villa,Jacuzzi, Sauna
Entire Place • 4 bedrooms
Note: Performance varies based on location, size, amenities, seasonality, and management quality. Data reflects the past 12 months.
Top Performing Airbnb Hosts in Langkawi (2026)
Learn from the best! This table showcases top-performing Airbnb hosts in Langkawi based on the number of properties managed and estimated total revenue over the past year. Analyze their scale and performance metrics.
| Host Name | Properties | Grossing Revenue | Stay Reviews | Avg Rating |
|---|---|---|---|---|
| Sami | 4 | $255,765 | 256 | 4.91/5.0 |
| Zervin | 11 | $222,410 | 554 | 4.79/5.0 |
| Anis | 9 | $153,992 | 1052 | 4.99/5.0 |
| Mazlan | 2 | $141,306 | 70 | 4.92/5.0 |
| Ara | 2 | $97,412 | 98 | 4.95/5.0 |
| Azrul | 5 | $96,065 | 1040 | 4.67/5.0 |
| Reena | 8 | $95,459 | 493 | 4.67/5.0 |
| Hajar | 4 | $79,734 | 643 | 4.86/5.0 |
| Anna | 9 | $78,106 | 188 | 4.84/5.0 |
| Gudrun & David | 5 | $70,474 | 189 | 4.80/5.0 |
Analyzing the strategies of top hosts, such as their property selection, pricing, and guest communication, can offer valuable lessons for optimizing your own Airbnb operations in Langkawi.
Dive Deeper: Advanced Langkawi STR Market Data (2026)
Ready to unlock more insights? AirROI provides access to advanced metrics and comprehensive Airbnb data for Langkawi. Explore detailed analytics beyond this report to refine your investment strategy, optimize pricing, and maximize your vacation rental profits.
Explore Advanced MetricsLangkawi Short-Term Rental Market Composition (2026): Property & Room Types
Room Type Distribution
Property Type Distribution
Market Composition Insights for Langkawi
- The Langkawi Airbnb market composition is heavily skewed towards Entire Home/Apt listings, which make up 88.9% of the 198 active rentals. This indicates strong guest preference for privacy and space.
- Looking at the property type distribution in Langkawi, House properties are the most common (65.7%), reflecting the local real estate landscape.
- Houses represent a significant 65.7% portion, catering likely to families or larger groups.
- The presence of 9.6% Hotel/Boutique listings indicates integration with traditional hospitality.
- Smaller segments like outdoor/unique, others, unique stays (combined 7.0%) offer potential for unique stay experiences.
Langkawi Airbnb Room Capacity Analysis (2026): Bedroom Distribution
Distribution of Listings by Number of Bedrooms
Room Capacity Insights for Langkawi
- The dominant room capacity in Langkawi is 3 bedrooms listings, making up 26.3% of the market. This suggests a strong demand for properties suitable for families or small groups.
- Together, 3 bedrooms and 1 bedroom properties represent 50.0% of the active Airbnb listings in Langkawi, indicating a high concentration in these sizes.
- A significant 54.6% of listings offer 3+ bedrooms, catering to larger groups and families seeking more space in Langkawi.
Langkawi Vacation Rental Guest Capacity Trends (2026)
Distribution of Listings by Guest Capacity
Guest Capacity Insights for Langkawi
- The most common guest capacity trend in Langkawi vacation rentals is listings accommodating 8+ guests (33.3%). This suggests the primary traveler segment is likely larger groups.
- Properties designed for 8+ guests and 6 guests dominate the Langkawi STR market, accounting for 54.5% of listings.
- 59.0% of properties accommodate 6+ guests, serving the market segment for larger families or group travel in Langkawi.
- On average, properties in Langkawi are equipped to host 5.4 guests.
Langkawi Airbnb Booking Patterns (2026): Available vs. Booked Days
Available Days Distribution
Booked Days Distribution
Booking Pattern Insights for Langkawi
- The most common availability pattern in Langkawi falls within the 271-366 days range, representing 60.6% of listings. This suggests many properties have significant open periods on their calendars.
- Approximately 90.9% of listings show high availability (181+ days open annually), indicating potential for increased bookings or specific owner usage patterns.
- For booked days, the 31-90 days range is most frequent in Langkawi (35.4%), reflecting common guest stay durations or potential owner blocking patterns.
- A notable 9.6% of properties secure long booking periods (181+ days booked per year), highlighting successful long-term rental strategies or significant owner usage.
Langkawi Airbnb Minimum Stay Requirements Analysis
Distribution of Listings by Minimum Night Requirement
1 Night
101 listings
51% of total
2 Nights
63 listings
31.8% of total
3 Nights
12 listings
6.1% of total
30+ Nights
22 listings
11.1% of total
Key Insights
- The most prevalent minimum stay requirement in Langkawi is 1 Night, adopted by 51% of listings. This highlights the market's preference for shorter, flexible bookings.
- A strong majority (82.8%) of the Langkawi Airbnb data shows acceptance of very short stays (1-2 nights), indicating a dynamic, high-turnover market.
- A significant segment (11.1%) caters to monthly stays (30+ nights) in Langkawi, pointing to opportunities in the extended-stay market.
Recommendations
- Align with the market by considering a 1 Night minimum stay, as 51% of Langkawi hosts use this setting.
- Explore offering discounts for stays of 30+ nights to attract the 11.1% of the market seeking extended stays.
- Adjust minimum nights based on seasonality – potentially shorter during low season and longer during peak demand periods in Langkawi.
Langkawi Airbnb Cancellation Policy Trends Analysis (2026)
Super Strict 30 Days
1 listings
0.5% of total
Limited
2 listings
1% of total
Flexible
37 listings
18.7% of total
Moderate
48 listings
24.2% of total
Firm
55 listings
27.8% of total
Strict
55 listings
27.8% of total
Cancellation Policy Insights for Langkawi
- The prevailing Airbnb cancellation policy trend in Langkawi is Firm, used by 27.8% of listings.
- A majority (55.6%) of hosts in Langkawi utilize Firm or Strict policies, indicating a market where hosts prioritize booking security.
Recommendations for Hosts
- Consider adopting a Firm policy to align with the 27.8% market standard in Langkawi.
- Regularly review your cancellation policy against competitors and market demand shifts in Langkawi.
Langkawi STR Booking Lead Time Analysis (2026)
Average Booking Lead Time by Month
Booking Lead Time Insights for Langkawi
- The overall average booking lead time for vacation rentals in Langkawi is 45 days.
- Guests book furthest in advance for stays during May (average 72 days), likely coinciding with peak travel demand or local events.
- The shortest booking windows occur for stays in June (average 29 days), indicating more last-minute travel plans during this time.
- Seasonally, Spring (53 days avg.) sees the longest lead times, while Summer (39 days avg.) has the shortest, reflecting typical travel planning cycles.
Recommendations for Hosts
- Use the overall average lead time (45 days) as a baseline for your pricing and availability strategy in Langkawi.
- For May stays, consider implementing length-of-stay discounts or slightly higher rates for bookings made less than 72 days out to capitalize on advance planning.
- Target marketing efforts for the Spring season well in advance (at least 53 days) to capture early planners.
- Monitor your own booking lead times against these Langkawi averages to identify opportunities for dynamic pricing adjustments.
Popular & Essential Airbnb Amenities in Langkawi (2026)
Amenity Prevalence
Amenity Insights for Langkawi
- Essential amenities in Langkawi that guests expect include: Air conditioning. Lacking these (this) could significantly impact bookings.
- Popular amenities like Free parking on premises, Wifi, TV are common but not universal. Offering these can provide a competitive edge.
- Warning: Wifi is not universally provided but is considered essential globally. Ensure reliable Wifi is offered.
Recommendations for Hosts
- Ensure your listing includes all essential amenities for Langkawi: Air conditioning.
- Prioritize adding missing essentials: Air conditioning.
- Consider adding popular differentiators like Free parking on premises or Wifi to increase appeal.
- Highlight unique or less common amenities you offer (e.g., hot tub, dedicated workspace, EV charger) in your listing description and photos.
- Regularly check competitor amenities in Langkawi to stay competitive.
Langkawi Airbnb Guest Demographics & Profile Analysis (2026)
Guest Profile Summary for Langkawi
- The typical guest profile for Airbnb in Langkawi consists of predominantly international visitors (71%), with top international origins including United Kingdom, typically belonging to the Post-2000s (Gen Z/Alpha) group (50%), primarily speaking English or Malay.
- Domestic travelers account for 29.0% of guests.
- Key international markets include Malaysia (29%) and United Kingdom (10.7%).
- Top languages spoken are English (44.2%) followed by Malay (11.1%).
- A significant demographic segment is the Post-2000s (Gen Z/Alpha) group, representing 50% of guests.
Recommendations for Hosts
- Focus marketing internationally, particularly towards travelers from United Kingdom.
- Tailor amenities and listing descriptions to appeal to the dominant Post-2000s (Gen Z/Alpha) demographic (e.g., highlight fast WiFi, smart home features, local guides).
- Highlight unique local experiences or amenities relevant to the primary guest profile.
- Consider seasonal promotions aligned with peak travel times for key origin markets.
Nearby Short-Term Rental Market Comparison
How does the Langkawi Airbnb market stack up against its neighbors? Compare key performance metrics like average monthly revenue, ADR, and occupancy rates in surrounding areas to understand the broader regional STR landscape.
| Market | Active Properties | Monthly Revenue | Daily Rate | Avg. Occupancy |
|---|---|---|---|---|
| Kamala | 1,132 | $2,133 | $278.29 | 42% |
| Kuala Teriang | 12 | $2,040 | $226.29 | 34% |
| Si Sunthon | 110 | $1,982 | $295.68 | 37% |
| Pa Tong | 151 | $1,731 | $235.44 | 41% |
| Choeng Thale | 1,853 | $1,726 | $261.66 | 39% |
| Tengah Island | 80 | $1,658 | $179.65 | 32% |
| Patong | 1,748 | $1,491 | $169.28 | 40% |
| Rawai | 2,100 | $1,487 | $223.67 | 40% |
| Karon | 990 | $1,463 | $180.33 | 42% |
| Haad Khlong Khong | 108 | $1,400 | $132.89 | 40% |