Alor Setar Airbnb Market Analysis 2026: Short Term Rental Data & Vacation Rental Statistics in Kedah, Malaysia
Is Airbnb profitable in Alor Setar in 2026? Explore comprehensive Airbnb analytics for Alor Setar, Kedah, Malaysia to uncover income potential. This 2026 STR market report for Alor Setar, based on AirROI data from February 2025 to January 2026, reveals key trends in the niche market of 92 active listings.
Whether you're considering an Airbnb investment in Alor Setar, optimizing your existing vacation rental, or exploring rental arbitrage opportunities, understanding the Alor Setar Airbnb data is crucial. Leveraging the low regulation environment is key to maximizing your short term rental income potential. Let's dive into the specifics.
Key Alor Setar Airbnb Performance Metrics Overview
Monthly Airbnb Revenue Variations & Income Potential in Alor Setar (2026)
Understanding the monthly revenue variations for Airbnb listings in Alor Setar is key to maximizing your short term rental income potential. Seasonality significantly impacts earnings. Our analysis, based on data from the past 12 months, shows that the peak revenue month for STRs in Alor Setar is typically September, while January often presents the lowest earnings, highlighting opportunities for strategic pricing adjustments during shoulder and low seasons. Explore the typical Airbnb income in Alor Setar across different performance tiers:
- Best-in-class properties (Top 10%) achieve $1,218+ monthly, often utilizing dynamic pricing and superior guest experiences.
- Strong performing properties (Top 25%) earn $676 or more, indicating effective management and desirable locations/amenities.
- Typical properties (Median) generate around $372 per month, representing the average market performance.
- Entry-level properties (Bottom 25%) see earnings around $211, often with potential for optimization.
Average Monthly Airbnb Earnings Trend in Alor Setar
Alor Setar Airbnb Occupancy Rate Trends (2026)
Maximize your bookings by understanding the Alor Setar STR occupancy trends. Seasonal demand shifts significantly influence how often properties are booked. Typically, Decembersees the highest demand (peak season occupancy), while January experiences the lowest (low season). Effective strategies, like adjusting minimum stays or offering promotions, can boost occupancy during slower periods. Here's how different property tiers perform in Alor Setar:
- Best-in-class properties (Top 10%) achieve 51%+ occupancy, indicating high desirability and potentially optimized availability.
- Strong performing properties (Top 25%) maintain 34% or higher occupancy, suggesting good market fit and guest satisfaction.
- Typical properties (Median) have an occupancy rate around 20%.
- Entry-level properties (Bottom 25%) average 11% occupancy, potentially facing higher vacancy.
Average Monthly Occupancy Rate Trend in Alor Setar
Average Daily Rate (ADR) Airbnb Trends in Alor Setar (2026)
Effective short term rental pricing strategy in Alor Setar involves understanding monthly ADR fluctuations. The Average Daily Rate (ADR) for Airbnb in Alor Setar typically peaks in July and dips lowest during January. Leveraging Airbnb dynamic pricing tools or strategies based on this seasonality can significantly boost revenue. Here's a look at the typical nightly rates achieved:
- Best-in-class properties (Top 10%) command rates of $124+ per night, often due to premium features or locations.
- Strong performing properties (Top 25%) achieve nightly rates of $87 or more.
- Typical properties (Median) charge around $62 per night.
- Entry-level properties (Bottom 25%) earn around $47 per night.
Average Daily Rate (ADR) Trend by Month in Alor Setar
Get Live Alor Setar Market Intelligence 👇

Explore Real-time Analytics
Airbnb Seasonality Analysis & Trends in Alor Setar (2026)
Peak Season (September, December, October)
- Revenue averages $691 per month
- Occupancy rates average 27.7%
- Daily rates average $75
Shoulder Season
- Revenue averages $548 per month
- Occupancy maintains around 25.9%
- Daily rates hold near $90
Low Season (January, March, May)
- Revenue drops to average $465 per month
- Occupancy decreases to average 20.7%
- Daily rates adjust to average $86
Seasonality Insights for Alor Setar
- The Airbnb seasonality in Alor Setar shows moderate seasonality with distinct peak and low periods. While the sections above show seasonal averages, it's also insightful to look at the extremes:
- During the high season, the absolute peak month showcases Alor Setar's highest earning potential, with monthly revenues capable of climbing to $733, occupancy reaching a high of 31.9%, and ADRs peaking at $98.
- Conversely, the slowest single month of the year, typically falling within the low season, marks the market's lowest point. In this month, revenue might dip to $418, occupancy could drop to 18.9%, and ADRs may adjust down to $73.
- Understanding both the seasonal averages and these monthly peaks and troughs in revenue, occupancy, and ADR is crucial for maximizing your Airbnb profit potential in Alor Setar.
Seasonal Strategies for Maximizing Profit
- Peak Season: Maximize revenue through premium pricing and potentially longer minimum stays. Ensure high availability.
- Low Season: Offer competitive pricing, special promotions (e.g., extended stay discounts), and flexible cancellation policies. Target off-season travelers like remote workers or budget-conscious guests.
- Shoulder Seasons: Implement dynamic pricing that balances peak and low rates. Target weekend travelers or specific events. Offer slightly more flexible terms than peak season.
- Regularly analyze your own performance against these Alor Setar seasonality benchmarks and adjust your pricing and availability strategy accordingly.
Best Areas for Airbnb Investment in Alor Setar (2026)
Exploring the top neighborhoods for short-term rentals in Alor Setar? This section highlights key areas, outlining why they are attractive for hosts and guests, along with notable local attractions. Consider these locations based on your target guest profile and investment strategy.
| Neighborhood / Area | Why Host Here? (Target Guests & Appeal) | Key Attractions & Landmarks |
|---|---|---|
| Kota Setar | The historical and cultural center of Alor Setar, attracting visitors for its heritage buildings and local cuisine. A prime location for both cultural tourists and locals. | Zahir Mosque, Alor Setar Tower, Kedah State Museum, Balai Besar, Menara Alor Setar |
| Kisap | Known for its proximity to local markets and the beautiful paddy fields, providing a unique rural experience. Ideal for guests looking to escape the city bustle. | Kedah Paddy Museum, Kisap Night Market, Traditional Malay Village |
| Langgar | A quiet suburb with local charm, perfect for families and those seeking a peaceful retreat. Great access to nature and traditional crafts. | Langgar Mosque, Local fruit orchards, Cultural craft workshops |
| Bandar Baharu | An emerging area with new developments and a mix of urban and rural life. Offers guests a glimpse of daily Malaysian life. | Bandar Baharu Market, Traditional Kelantanese Cuisine, Local street food stalls |
| Jitra | Located just north of Alor Setar, Jitra offers affordable accommodations and is close to major attractions like Putra Golf Club, appealing to budget travelers. | Putra Golf Club, Sungai Petani, Shopping malls |
| Pokok Sena | Known for its agricultural landscape and nearby recreational spots, it's perfect for nature lovers and eco-tourism. | Sungai Beriah, Taman Hutan Lipur Sungai Sedim |
| Guar Chempedak | A picturesque coastal village, often popular with beachgoers and seafood lovers. Provides a more laid-back experience. | Guar Chempedak Beach, Local seafood restaurants, Fishing spots |
| Alor Setar City Center | The bustling heart of the city with shopping malls, restaurants, and a vibrant nightlife. A prime location for business and leisure travelers alike. | Aman Central Mall, Huang's Chicken Rice, City Park, Kedah Royal Museum |
Understanding Airbnb License Requirements & STR Laws in Alor Setar (2026)
While Alor Setar, Kedah, Malaysia currently shows low STR regulations, specific Airbnb license requirements might still exist or change. Always verify the latest short term rental regulations and Airbnb license requirements directly with local government authorities for Alor Setar to ensure full compliance before hosting.
(Source: AirROI data, 2026, based on 1% licensed listings)
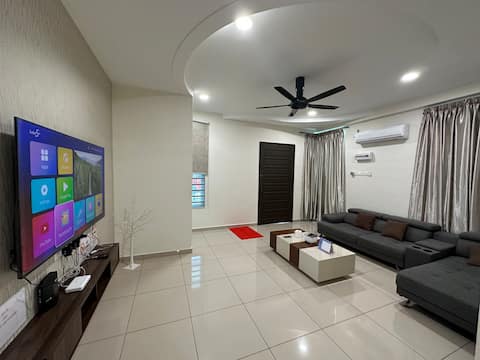
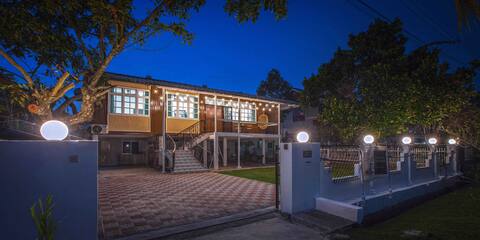
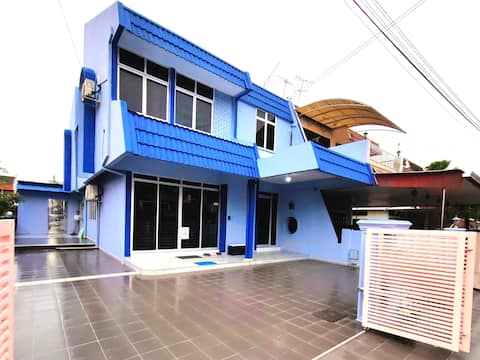
Top Performing Airbnb Properties in Alor Setar (2026)
Benchmark your potential! Explore examples of top-performing Airbnb properties in Alor Setarbased on Trailing Twelve Month (TTM) revenue. Analyze their characteristics, revenue, occupancy rate, and ADR to understand what drives success in this market.
J&X 76 Homestay Alor Setar Taman Seri Pagi
Entire Place • 5 bedrooms
Ghumah Chegu(wifi,fully aircond & water heater)
Entire Place • 4 bedrooms

Relax Inn 92 · Cozy 2-Storey Bungalow · Alor Setar
Entire Place • 5 bedrooms
ZZORA HOME near Aman Central Landed 5BR max 20pax
Entire Place • 5 bedrooms

BANGLO ALOR SETAR HOMESTAY
Entire Place • 6 bedrooms

New Renovate ZZORA HOME Near Keat Hwa 5BR max14pax
Entire Place • 5 bedrooms
Note: Performance varies based on location, size, amenities, seasonality, and management quality. Data reflects the past 12 months.
Top Performing Airbnb Hosts in Alor Setar (2026)
Learn from the best! This table showcases top-performing Airbnb hosts in Alor Setar based on the number of properties managed and estimated total revenue over the past year. Analyze their scale and performance metrics.
| Host Name | Properties | Grossing Revenue | Stay Reviews | Avg Rating |
|---|---|---|---|---|
| Angelina | 2 | $32,662 | 90 | 4.97/5.0 |
| BG Ooi | 1 | $24,991 | 72 | 5.00/5.0 |
| Hasna | 1 | $24,309 | 37 | 4.97/5.0 |
| Rex Ang | 4 | $24,148 | 92 | 4.88/5.0 |
| Norihan | 2 | $22,648 | 28 | 4.83/5.0 |
| Soo Lin | 1 | $21,231 | 75 | 5.00/5.0 |
| Je En | 2 | $14,763 | 112 | 4.58/5.0 |
| Xhin | 1 | $12,639 | 27 | 4.85/5.0 |
| Nirul Yus Miza | 1 | $10,897 | 12 | 5.00/5.0 |
| Junaidi | 1 | $10,388 | 12 | 5.00/5.0 |
Analyzing the strategies of top hosts, such as their property selection, pricing, and guest communication, can offer valuable lessons for optimizing your own Airbnb operations in Alor Setar.
Dive Deeper: Advanced Alor Setar STR Market Data (2026)
Ready to unlock more insights? AirROI provides access to advanced metrics and comprehensive Airbnb data for Alor Setar. Explore detailed analytics beyond this report to refine your investment strategy, optimize pricing, and maximize your vacation rental profits.
Explore Advanced MetricsAlor Setar Short-Term Rental Market Composition (2026): Property & Room Types
Room Type Distribution
Property Type Distribution
Market Composition Insights for Alor Setar
- The Alor Setar Airbnb market composition is heavily skewed towards Entire Home/Apt listings, which make up 88% of the 92 active rentals. This indicates strong guest preference for privacy and space.
- Looking at the property type distribution in Alor Setar, House properties are the most common (89.1%), reflecting the local real estate landscape.
- Houses represent a significant 89.1% portion, catering likely to families or larger groups.
- The presence of 5.4% Hotel/Boutique listings indicates integration with traditional hospitality.
- Smaller segments like apartment/condo, outdoor/unique (combined 5.4%) offer potential for unique stay experiences.
Alor Setar Airbnb Room Capacity Analysis (2026): Bedroom Distribution
Distribution of Listings by Number of Bedrooms
Room Capacity Insights for Alor Setar
- The dominant room capacity in Alor Setar is 3 bedrooms listings, making up 44.6% of the market. This suggests a strong demand for properties suitable for families or small groups.
- Together, 3 bedrooms and 4 bedrooms properties represent 70.7% of the active Airbnb listings in Alor Setar, indicating a high concentration in these sizes.
- A significant 87.0% of listings offer 3+ bedrooms, catering to larger groups and families seeking more space in Alor Setar.
Alor Setar Vacation Rental Guest Capacity Trends (2026)
Distribution of Listings by Guest Capacity
Guest Capacity Insights for Alor Setar
- The most common guest capacity trend in Alor Setar vacation rentals is listings accommodating 8+ guests (59.8%). This suggests the primary traveler segment is likely larger groups.
- Properties designed for 8+ guests and 6 guests dominate the Alor Setar STR market, accounting for 80.5% of listings.
- 85.9% of properties accommodate 6+ guests, serving the market segment for larger families or group travel in Alor Setar.
- On average, properties in Alor Setar are equipped to host 6.6 guests.
Alor Setar Airbnb Booking Patterns (2026): Available vs. Booked Days
Available Days Distribution
Booked Days Distribution
Booking Pattern Insights for Alor Setar
- The most common availability pattern in Alor Setar falls within the 271-366 days range, representing 77.2% of listings. This suggests many properties have significant open periods on their calendars.
- Approximately 98.9% of listings show high availability (181+ days open annually), indicating potential for increased bookings or specific owner usage patterns.
- For booked days, the 1-30 days range is most frequent in Alor Setar (37%), reflecting common guest stay durations or potential owner blocking patterns.
- A notable 2.2% of properties secure long booking periods (181+ days booked per year), highlighting successful long-term rental strategies or significant owner usage.
Alor Setar Airbnb Minimum Stay Requirements Analysis
Distribution of Listings by Minimum Night Requirement
1 Night
86 listings
93.5% of total
2 Nights
4 listings
4.3% of total
30+ Nights
2 listings
2.2% of total
Key Insights
- The most prevalent minimum stay requirement in Alor Setar is 1 Night, adopted by 93.5% of listings. This highlights the market's preference for shorter, flexible bookings.
- A strong majority (97.8%) of the Alor Setar Airbnb data shows acceptance of very short stays (1-2 nights), indicating a dynamic, high-turnover market.
- Dedicated monthly rentals (30+ nights) represent a small niche (2.2%), possibly an untapped area for hosts.
Recommendations
- Align with the market by considering a 1 Night minimum stay, as 93.5% of Alor Setar hosts use this setting.
- Adjust minimum nights based on seasonality – potentially shorter during low season and longer during peak demand periods in Alor Setar.
Alor Setar Airbnb Cancellation Policy Trends Analysis (2026)
Limited
1 listings
1.1% of total
Flexible
30 listings
32.6% of total
Moderate
19 listings
20.7% of total
Firm
31 listings
33.7% of total
Strict
11 listings
12% of total
Cancellation Policy Insights for Alor Setar
- The prevailing Airbnb cancellation policy trend in Alor Setar is Firm, used by 33.7% of listings.
- There's a relatively balanced mix between guest-friendly (53.3%) and stricter (45.7%) policies, offering choices for different guest needs.
Recommendations for Hosts
- Consider adopting a Firm policy to align with the 33.7% market standard in Alor Setar.
- Using a Strict policy might deter some guests, as only 12% of listings use it. Evaluate if potential revenue protection outweighs possible lower booking rates.
- Regularly review your cancellation policy against competitors and market demand shifts in Alor Setar.
Alor Setar STR Booking Lead Time Analysis (2026)
Average Booking Lead Time by Month
Booking Lead Time Insights for Alor Setar
- The overall average booking lead time for vacation rentals in Alor Setar is 35 days.
- Guests book furthest in advance for stays during October (average 49 days), likely coinciding with peak travel demand or local events.
- The shortest booking windows occur for stays in July (average 21 days), indicating more last-minute travel plans during this time.
- Seasonally, Fall (41 days avg.) sees the longest lead times, while Summer (22 days avg.) has the shortest, reflecting typical travel planning cycles.
Recommendations for Hosts
- Use the overall average lead time (35 days) as a baseline for your pricing and availability strategy in Alor Setar.
- For October stays, consider implementing length-of-stay discounts or slightly higher rates for bookings made less than 49 days out to capitalize on advance planning.
- Target marketing efforts for the Fall season well in advance (at least 41 days) to capture early planners.
- Monitor your own booking lead times against these Alor Setar averages to identify opportunities for dynamic pricing adjustments.
Popular & Essential Airbnb Amenities in Alor Setar (2026)
Amenity Prevalence
Amenity Insights for Alor Setar
- Essential amenities in Alor Setar that guests expect include: Air conditioning, TV. Lacking these (any) could significantly impact bookings.
- Popular amenities like Free parking on premises, Kitchen, Wifi are common but not universal. Offering these can provide a competitive edge.
- Warning: Wifi is not universally provided but is considered essential globally. Ensure reliable Wifi is offered.
Recommendations for Hosts
- Ensure your listing includes all essential amenities for Alor Setar: Air conditioning, TV.
- Prioritize adding missing essentials: TV.
- Consider adding popular differentiators like Free parking on premises or Kitchen to increase appeal.
- Highlight unique or less common amenities you offer (e.g., hot tub, dedicated workspace, EV charger) in your listing description and photos.
- Regularly check competitor amenities in Alor Setar to stay competitive.
Alor Setar Airbnb Guest Demographics & Profile Analysis (2026)
Guest Profile Summary for Alor Setar
- The typical guest profile for Airbnb in Alor Setar consists of primarily domestic travelers (88%), often arriving from nearby Kuala Lumpur, typically belonging to the Post-2000s (Gen Z/Alpha) group (50%), primarily speaking English or Malay.
- Domestic travelers account for 88.3% of guests.
- Key international markets include Malaysia (88.3%) and Singapore (6.3%).
- Top languages spoken are English (45.2%) followed by Malay (34.1%).
- A significant demographic segment is the Post-2000s (Gen Z/Alpha) group, representing 50% of guests.
Recommendations for Hosts
- Target domestic marketing efforts towards travelers from Kuala Lumpur and Selangor.
- Tailor amenities and listing descriptions to appeal to the dominant Post-2000s (Gen Z/Alpha) demographic (e.g., highlight fast WiFi, smart home features, local guides).
- Highlight unique local experiences or amenities relevant to the primary guest profile.
- Consider seasonal promotions aligned with peak travel times for key origin markets.
Nearby Short-Term Rental Market Comparison
How does the Alor Setar Airbnb market stack up against its neighbors? Compare key performance metrics like average monthly revenue, ADR, and occupancy rates in surrounding areas to understand the broader regional STR landscape.
| Market | Active Properties | Monthly Revenue | Daily Rate | Avg. Occupancy |
|---|---|---|---|---|
| Kuala Teriang | 12 | $2,040 | $226.29 | 34% |
| Tengah Island | 80 | $1,658 | $179.65 | 32% |
| Haad Khlong Khong | 108 | $1,400 | $132.89 | 40% |
| Ao Kantiang | 24 | $1,233 | $152.15 | 35% |
| Langkawi | 198 | $1,011 | $125.37 | 32% |
| Khlong Nin | 41 | $981 | $91.29 | 51% |
| Kampung Padang Gaong | 46 | $877 | $87.50 | 38% |
| Khlong Hae | 13 | $782 | $135.92 | 22% |
| Kuah | 317 | $748 | $87.94 | 31% |
| Sala Dan | 150 | $747 | $88.21 | 38% |