Kulai Airbnb Market Analysis 2026: Short Term Rental Data & Vacation Rental Statistics in Johor, Malaysia
Is Airbnb profitable in Kulai in 2026? Explore comprehensive Airbnb analytics for Kulai, Johor, Malaysia to uncover income potential. This 2026 STR market report for Kulai, based on AirROI data from February 2025 to January 2026, reveals key trends in the niche market of 122 active listings.
Whether you're considering an Airbnb investment in Kulai, optimizing your existing vacation rental, or exploring rental arbitrage opportunities, understanding the Kulai Airbnb data is crucial. Leveraging the low regulation environment is key to maximizing your short term rental income potential. Let's dive into the specifics.
Key Kulai Airbnb Performance Metrics Overview
Monthly Airbnb Revenue Variations & Income Potential in Kulai (2026)
Understanding the monthly revenue variations for Airbnb listings in Kulai is key to maximizing your short term rental income potential. Seasonality significantly impacts earnings. Our analysis, based on data from the past 12 months, shows that the peak revenue month for STRs in Kulai is typically December, while April often presents the lowest earnings, highlighting opportunities for strategic pricing adjustments during shoulder and low seasons. Explore the typical Airbnb income in Kulai across different performance tiers:
- Best-in-class properties (Top 10%) achieve $1,539+ monthly, often utilizing dynamic pricing and superior guest experiences.
- Strong performing properties (Top 25%) earn $943 or more, indicating effective management and desirable locations/amenities.
- Typical properties (Median) generate around $528 per month, representing the average market performance.
- Entry-level properties (Bottom 25%) see earnings around $245, often with potential for optimization.
Average Monthly Airbnb Earnings Trend in Kulai
Kulai Airbnb Occupancy Rate Trends (2026)
Maximize your bookings by understanding the Kulai STR occupancy trends. Seasonal demand shifts significantly influence how often properties are booked. Typically, Junesees the highest demand (peak season occupancy), while April experiences the lowest (low season). Effective strategies, like adjusting minimum stays or offering promotions, can boost occupancy during slower periods. Here's how different property tiers perform in Kulai:
- Best-in-class properties (Top 10%) achieve 61%+ occupancy, indicating high desirability and potentially optimized availability.
- Strong performing properties (Top 25%) maintain 42% or higher occupancy, suggesting good market fit and guest satisfaction.
- Typical properties (Median) have an occupancy rate around 23%.
- Entry-level properties (Bottom 25%) average 12% occupancy, potentially facing higher vacancy.
Average Monthly Occupancy Rate Trend in Kulai
Average Daily Rate (ADR) Airbnb Trends in Kulai (2026)
Effective short term rental pricing strategy in Kulai involves understanding monthly ADR fluctuations. The Average Daily Rate (ADR) for Airbnb in Kulai typically peaks in January and dips lowest during March. Leveraging Airbnb dynamic pricing tools or strategies based on this seasonality can significantly boost revenue. Here's a look at the typical nightly rates achieved:
- Best-in-class properties (Top 10%) command rates of $214+ per night, often due to premium features or locations.
- Strong performing properties (Top 25%) achieve nightly rates of $90 or more.
- Typical properties (Median) charge around $68 per night.
- Entry-level properties (Bottom 25%) earn around $51 per night.
Average Daily Rate (ADR) Trend by Month in Kulai
Get Live Kulai Market Intelligence 👇

Explore Real-time Analytics
Airbnb Seasonality Analysis & Trends in Kulai (2026)
Peak Season (December, January, February)
- Revenue averages $983 per month
- Occupancy rates average 29.9%
- Daily rates average $112
Shoulder Season
- Revenue averages $739 per month
- Occupancy maintains around 29.9%
- Daily rates hold near $98
Low Season (April, May, September)
- Revenue drops to average $577 per month
- Occupancy decreases to average 26.1%
- Daily rates adjust to average $94
Seasonality Insights for Kulai
- The Airbnb seasonality in Kulai shows highly seasonal trends requiring careful strategy. While the sections above show seasonal averages, it's also insightful to look at the extremes:
- During the high season, the absolute peak month showcases Kulai's highest earning potential, with monthly revenues capable of climbing to $1,182, occupancy reaching a high of 32.7%, and ADRs peaking at $125.
- Conversely, the slowest single month of the year, typically falling within the low season, marks the market's lowest point. In this month, revenue might dip to $541, occupancy could drop to 25.4%, and ADRs may adjust down to $92.
- Understanding both the seasonal averages and these monthly peaks and troughs in revenue, occupancy, and ADR is crucial for maximizing your Airbnb profit potential in Kulai.
Seasonal Strategies for Maximizing Profit
- Peak Season: Maximize revenue through premium pricing and potentially longer minimum stays. Ensure high availability.
- Low Season: Offer competitive pricing, special promotions (e.g., extended stay discounts), and flexible cancellation policies. Target off-season travelers like remote workers or budget-conscious guests.
- Shoulder Seasons: Implement dynamic pricing that balances peak and low rates. Target weekend travelers or specific events. Offer slightly more flexible terms than peak season.
- Regularly analyze your own performance against these Kulai seasonality benchmarks and adjust your pricing and availability strategy accordingly.
Best Areas for Airbnb Investment in Kulai (2026)
Exploring the top neighborhoods for short-term rentals in Kulai? This section highlights key areas, outlining why they are attractive for hosts and guests, along with notable local attractions. Consider these locations based on your target guest profile and investment strategy.
| Neighborhood / Area | Why Host Here? (Target Guests & Appeal) | Key Attractions & Landmarks |
|---|---|---|
| Bandar Kulai | The central district of Kulai, it's a bustling area with easy access to shopping, dining, and local attractions. Ideal for business travelers and tourists looking for convenience. | Kulai Mall, Batu Pahat Mall, JPO (Johor Premium Outlets), Kulai Night Market, Kulai Wet Market |
| Senai | Close to the Senai International Airport, this area is perfect for travelers needing quick access to flights and has various accommodations for short-term stays. | Senai International Airport, Batu Pahat Golf Club, Senai Business Park, Skudai Common Green, Eco Garden |
| Robina | A rapidly growing suburb in Kulai, Robina offers modern amenities and is a peaceful residential area, appealing to families and longer-term visitors. | Robina Park, Robina Heritage Trail, Kulai Public Library, local cafes and restaurants |
| Kulai Industrial Area | This area attracts business travelers due to its proximity to many factories and industries, perfect for corporate stays. | Kulai Industrial Park, Taman Perindustrian Cemerlang, local eateries and hawker centers |
| Taman Puteri | A popular residential area that is well-connected to main roads, this locale provides easy access to other parts of Johor and has various attractive housing options. | Taman Puteri Playground, local shopping centers, community parks, restaurants |
| Jaya One | A vibrant area with many cafes, shops, and entertainment options, attracting young professionals and families looking for a lively neighborhood atmosphere. | Jaya One Shopping Mall, entertainment hubs, community events |
| Johor Premium Outlets (JPO) | An outlet shopping destination that attracts tourists and shoppers, making it a lucrative spot for short-term rentals close to shopping attractions. | Johor Premium Outlets, various dining options, shopping experiences, local markets |
| Kulai Heritage Center | Rich in cultural history, this area attracts guests interested in local traditions and history, offering a unique perspective on the region. | Kulai Heritage Center, local museums, cultural festivals |
Understanding Airbnb License Requirements & STR Laws in Kulai (2026)
While Kulai, Johor, Malaysia currently shows low STR regulations, specific Airbnb license requirements might still exist or change. Always verify the latest short term rental regulations and Airbnb license requirements directly with local government authorities for Kulai to ensure full compliance before hosting.
(Source: AirROI data, 2026, finding no licensed listings among those analyzed)
Top Performing Airbnb Properties in Kulai (2026)
Benchmark your potential! Explore examples of top-performing Airbnb properties in Kulaibased on Trailing Twelve Month (TTM) revenue. Analyze their characteristics, revenue, occupancy rate, and ADR to understand what drives success in this market.

Euphony 17 Senai Swimming pool / Birthday / KTV /
Entire Place • 4 bedrooms
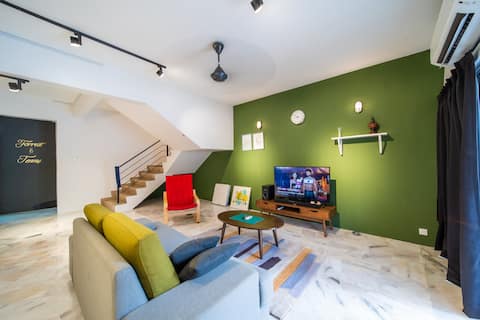
![[FULL]Cube on Hill Resort Villa Homestay in Johor](https://a0.muscache.com/im/pictures/hosting/Hosting-1181477265117165315/original/a425371e-3b0c-4496-bc7f-a4111106cae5.jpeg?im_w=480&im_format=avif)
[FULL]Cube on Hill Resort Villa Homestay in Johor
Entire Place • 4 bedrooms

Euphony18 @ Senai: Wedding / Birthday / KTV / BBQ
Entire Place • 4 bedrooms

CosyCityHub#3MIN(AEON)(JPO)(MIDDLE KULAI)(15pax)
Entire Place • 4 bedrooms
Homestay@ Senai Utama (Can sleep up to 34 pax)
Entire Place • 3 bedrooms
Kulai/3 mins to iPark&Aeon/JPO/Airport/8pax/Wifi
Entire Place • 4 bedrooms
Note: Performance varies based on location, size, amenities, seasonality, and management quality. Data reflects the past 12 months.
Top Performing Airbnb Hosts in Kulai (2026)
Learn from the best! This table showcases top-performing Airbnb hosts in Kulai based on the number of properties managed and estimated total revenue over the past year. Analyze their scale and performance metrics.
| Host Name | Properties | Grossing Revenue | Stay Reviews | Avg Rating |
|---|---|---|---|---|
| Miranda | 35 | $249,812 | 643 | 4.65/5.0 |
| Sky | 2 | $62,296 | 47 | 5.00/5.0 |
| CubeStay | 1 | $29,542 | 36 | 4.92/5.0 |
| Three Leaf | 7 | $28,294 | 88 | 4.35/5.0 |
| Joyous | 2 | $24,578 | 3 | Not Rated |
| Asr Homes | 2 | $23,006 | 31 | 3.83/5.0 |
| Hebat Homestay | 2 | $19,595 | 216 | 4.83/5.0 |
| Centre Home | 2 | $18,472 | 63 | 4.94/5.0 |
| Save The Date | 1 | $17,730 | 2 | Not Rated |
| Dreamhomestay | 5 | $17,556 | 93 | 4.54/5.0 |
Analyzing the strategies of top hosts, such as their property selection, pricing, and guest communication, can offer valuable lessons for optimizing your own Airbnb operations in Kulai.
Dive Deeper: Advanced Kulai STR Market Data (2026)
Ready to unlock more insights? AirROI provides access to advanced metrics and comprehensive Airbnb data for Kulai. Explore detailed analytics beyond this report to refine your investment strategy, optimize pricing, and maximize your vacation rental profits.
Explore Advanced MetricsKulai Short-Term Rental Market Composition (2026): Property & Room Types
Room Type Distribution
Property Type Distribution
Market Composition Insights for Kulai
- The Kulai Airbnb market composition is heavily skewed towards Entire Home/Apt listings, which make up 82% of the 122 active rentals. This indicates strong guest preference for privacy and space.
- Looking at the property type distribution in Kulai, House properties are the most common (52.5%), reflecting the local real estate landscape.
- Houses represent a significant 52.5% portion, catering likely to families or larger groups.
- The presence of 11.5% Hotel/Boutique listings indicates integration with traditional hospitality.
- Smaller segments like outdoor/unique, unique stays, others (combined 4.9%) offer potential for unique stay experiences.
Kulai Airbnb Room Capacity Analysis (2026): Bedroom Distribution
Distribution of Listings by Number of Bedrooms
Room Capacity Insights for Kulai
- The dominant room capacity in Kulai is 3 bedrooms listings, making up 27.9% of the market. This suggests a strong demand for properties suitable for families or small groups.
- Together, 3 bedrooms and 4 bedrooms properties represent 54.1% of the active Airbnb listings in Kulai, indicating a high concentration in these sizes.
- A significant 59.8% of listings offer 3+ bedrooms, catering to larger groups and families seeking more space in Kulai.
Kulai Vacation Rental Guest Capacity Trends (2026)
Distribution of Listings by Guest Capacity
Guest Capacity Insights for Kulai
- The most common guest capacity trend in Kulai vacation rentals is listings accommodating 8+ guests (55.7%). This suggests the primary traveler segment is likely larger groups.
- Properties designed for 8+ guests and 6 guests dominate the Kulai STR market, accounting for 71.3% of listings.
- 76.2% of properties accommodate 6+ guests, serving the market segment for larger families or group travel in Kulai.
- On average, properties in Kulai are equipped to host 6.3 guests.
Kulai Airbnb Booking Patterns (2026): Available vs. Booked Days
Available Days Distribution
Booked Days Distribution
Booking Pattern Insights for Kulai
- The most common availability pattern in Kulai falls within the 271-366 days range, representing 67.2% of listings. This suggests many properties have significant open periods on their calendars.
- Approximately 92.6% of listings show high availability (181+ days open annually), indicating potential for increased bookings or specific owner usage patterns.
- For booked days, the 31-90 days range is most frequent in Kulai (39.3%), reflecting common guest stay durations or potential owner blocking patterns.
- A notable 7.4% of properties secure long booking periods (181+ days booked per year), highlighting successful long-term rental strategies or significant owner usage.
Kulai Airbnb Minimum Stay Requirements Analysis
Distribution of Listings by Minimum Night Requirement
1 Night
117 listings
95.9% of total
2 Nights
2 listings
1.6% of total
30+ Nights
3 listings
2.5% of total
Key Insights
- The most prevalent minimum stay requirement in Kulai is 1 Night, adopted by 95.9% of listings. This highlights the market's preference for shorter, flexible bookings.
- A strong majority (97.5%) of the Kulai Airbnb data shows acceptance of very short stays (1-2 nights), indicating a dynamic, high-turnover market.
- Dedicated monthly rentals (30+ nights) represent a small niche (2.5%), possibly an untapped area for hosts.
Recommendations
- Align with the market by considering a 1 Night minimum stay, as 95.9% of Kulai hosts use this setting.
- Adjust minimum nights based on seasonality – potentially shorter during low season and longer during peak demand periods in Kulai.
Kulai Airbnb Cancellation Policy Trends Analysis (2026)
Limited
1 listings
0.8% of total
Flexible
26 listings
21.5% of total
Moderate
64 listings
52.9% of total
Firm
20 listings
16.5% of total
Strict
10 listings
8.3% of total
Cancellation Policy Insights for Kulai
- The prevailing Airbnb cancellation policy trend in Kulai is Moderate, used by 52.9% of listings.
- The market strongly favors guest-friendly terms, with 74.4% of listings offering Flexible or Moderate policies. This suggests guests in Kulai may expect booking flexibility.
- Strict cancellation policies are quite rare (8.3%), potentially making listings with this policy less competitive unless justified by high demand or property type.
Recommendations for Hosts
- Consider adopting a Moderate policy to align with the 52.9% market standard in Kulai.
- Using a Strict policy might deter some guests, as only 8.3% of listings use it. Evaluate if potential revenue protection outweighs possible lower booking rates.
- Regularly review your cancellation policy against competitors and market demand shifts in Kulai.
Kulai STR Booking Lead Time Analysis (2026)
Average Booking Lead Time by Month
Booking Lead Time Insights for Kulai
- The overall average booking lead time for vacation rentals in Kulai is 22 days.
- Guests book furthest in advance for stays during November (average 36 days), likely coinciding with peak travel demand or local events.
- The shortest booking windows occur for stays in August (average 15 days), indicating more last-minute travel plans during this time.
- Seasonally, Fall (30 days avg.) sees the longest lead times, while Spring (17 days avg.) has the shortest, reflecting typical travel planning cycles.
Recommendations for Hosts
- Use the overall average lead time (22 days) as a baseline for your pricing and availability strategy in Kulai.
- For November stays, consider implementing length-of-stay discounts or slightly higher rates for bookings made less than 36 days out to capitalize on advance planning.
- Target marketing efforts for the Fall season well in advance (at least 30 days) to capture early planners.
- Monitor your own booking lead times against these Kulai averages to identify opportunities for dynamic pricing adjustments.
Popular & Essential Airbnb Amenities in Kulai (2026)
Amenity Prevalence
Amenity Insights for Kulai
- Essential amenities in Kulai that guests expect include: Air conditioning, Wifi. Lacking these (any) could significantly impact bookings.
- Popular amenities like TV, Free parking on premises, Washer are common but not universal. Offering these can provide a competitive edge.
Recommendations for Hosts
- Ensure your listing includes all essential amenities for Kulai: Air conditioning, Wifi.
- Prioritize adding missing essentials: Air conditioning, Wifi.
- Consider adding popular differentiators like TV or Free parking on premises to increase appeal.
- Highlight unique or less common amenities you offer (e.g., hot tub, dedicated workspace, EV charger) in your listing description and photos.
- Regularly check competitor amenities in Kulai to stay competitive.
Kulai Airbnb Guest Demographics & Profile Analysis (2026)
Guest Profile Summary for Kulai
- The typical guest profile for Airbnb in Kulai consists of a mix of domestic (60%) and international guests, often arriving from nearby Kuala Lumpur, typically belonging to the Post-2000s (Gen Z/Alpha) group (50%), primarily speaking English or Malay.
- Domestic travelers account for 60.2% of guests.
- Key international markets include Malaysia (60.2%) and Singapore (34.9%).
- Top languages spoken are English (42%) followed by Malay (25.7%).
- A significant demographic segment is the Post-2000s (Gen Z/Alpha) group, representing 50% of guests.
Recommendations for Hosts
- Target domestic marketing efforts towards travelers from Kuala Lumpur and Selangor.
- Tailor amenities and listing descriptions to appeal to the dominant Post-2000s (Gen Z/Alpha) demographic (e.g., highlight fast WiFi, smart home features, local guides).
- Highlight unique local experiences or amenities relevant to the primary guest profile.
- Consider seasonal promotions aligned with peak travel times for key origin markets.
Nearby Short-Term Rental Market Comparison
How does the Kulai Airbnb market stack up against its neighbors? Compare key performance metrics like average monthly revenue, ADR, and occupancy rates in surrounding areas to understand the broader regional STR landscape.
| Market | Active Properties | Monthly Revenue | Daily Rate | Avg. Occupancy |
|---|---|---|---|---|
| Kuala Sungai Baru | 13 | $1,093 | $156.49 | 22% |
| Singapore | 937 | $954 | $181.86 | 28% |
| Pulau Sebang | 88 | $916 | $203.35 | 19% |
| Alor Gajah | 95 | $659 | $146.75 | 18% |
| Jasin | 40 | $608 | $123.36 | 18% |
| Johor Bahru | 4,630 | $562 | $79.55 | 29% |
| Kampung Bukit Payung | 10 | $539 | $164.67 | 20% |
| Hang Tuah Jaya Municipal Council | 60 | $532 | $121.53 | 17% |
| Bandar Penawar | 252 | $521 | $121.90 | 18% |
| Melaka | 32 | $520 | $112.64 | 17% |