Johor Bahru Airbnb Market Analysis 2026: Short Term Rental Data & Vacation Rental Statistics in Johor, Malaysia
Is Airbnb profitable in Johor Bahru in 2026? Explore comprehensive Airbnb analytics for Johor Bahru, Johor, Malaysia to uncover income potential. This 2026 STR market report for Johor Bahru, based on AirROI data from February 2025 to January 2026, reveals key trends in the bustling market of 4,630 active listings.
Whether you're considering an Airbnb investment in Johor Bahru, optimizing your existing vacation rental, or exploring rental arbitrage opportunities, understanding the Johor Bahru Airbnb data is crucial. Leveraging the low regulation environment is key to maximizing your short term rental income potential. Let's dive into the specifics.
Key Johor Bahru Airbnb Performance Metrics Overview
Monthly Airbnb Revenue Variations & Income Potential in Johor Bahru (2026)
Understanding the monthly revenue variations for Airbnb listings in Johor Bahru is key to maximizing your short term rental income potential. Seasonality significantly impacts earnings. Our analysis, based on data from the past 12 months, shows that the peak revenue month for STRs in Johor Bahru is typically December, while April often presents the lowest earnings, highlighting opportunities for strategic pricing adjustments during shoulder and low seasons. Explore the typical Airbnb income in Johor Bahru across different performance tiers:
- Best-in-class properties (Top 10%) achieve $1,590+ monthly, often utilizing dynamic pricing and superior guest experiences.
- Strong performing properties (Top 25%) earn $964 or more, indicating effective management and desirable locations/amenities.
- Typical properties (Median) generate around $524 per month, representing the average market performance.
- Entry-level properties (Bottom 25%) see earnings around $245, often with potential for optimization.
Average Monthly Airbnb Earnings Trend in Johor Bahru
Johor Bahru Airbnb Occupancy Rate Trends (2026)
Maximize your bookings by understanding the Johor Bahru STR occupancy trends. Seasonal demand shifts significantly influence how often properties are booked. Typically, Decembersees the highest demand (peak season occupancy), while May experiences the lowest (low season). Effective strategies, like adjusting minimum stays or offering promotions, can boost occupancy during slower periods. Here's how different property tiers perform in Johor Bahru:
- Best-in-class properties (Top 10%) achieve 64%+ occupancy, indicating high desirability and potentially optimized availability.
- Strong performing properties (Top 25%) maintain 45% or higher occupancy, suggesting good market fit and guest satisfaction.
- Typical properties (Median) have an occupancy rate around 27%.
- Entry-level properties (Bottom 25%) average 14% occupancy, potentially facing higher vacancy.
Average Monthly Occupancy Rate Trend in Johor Bahru
Average Daily Rate (ADR) Airbnb Trends in Johor Bahru (2026)
Effective short term rental pricing strategy in Johor Bahru involves understanding monthly ADR fluctuations. The Average Daily Rate (ADR) for Airbnb in Johor Bahru typically peaks in December and dips lowest during March. Leveraging Airbnb dynamic pricing tools or strategies based on this seasonality can significantly boost revenue. Here's a look at the typical nightly rates achieved:
- Best-in-class properties (Top 10%) command rates of $136+ per night, often due to premium features or locations.
- Strong performing properties (Top 25%) achieve nightly rates of $91 or more.
- Typical properties (Median) charge around $61 per night.
- Entry-level properties (Bottom 25%) earn around $41 per night.
Average Daily Rate (ADR) Trend by Month in Johor Bahru
Get Live Johor Bahru Market Intelligence 👇

Explore Real-time Analytics
Airbnb Seasonality Analysis & Trends in Johor Bahru (2026)
Peak Season (December, June, July)
- Revenue averages $972 per month
- Occupancy rates average 36.7%
- Daily rates average $82
Shoulder Season
- Revenue averages $752 per month
- Occupancy maintains around 30.5%
- Daily rates hold near $81
Low Season (February, April, May)
- Revenue drops to average $648 per month
- Occupancy decreases to average 27.2%
- Daily rates adjust to average $77
Seasonality Insights for Johor Bahru
- The Airbnb seasonality in Johor Bahru shows highly seasonal trends requiring careful strategy. While the sections above show seasonal averages, it's also insightful to look at the extremes:
- During the high season, the absolute peak month showcases Johor Bahru's highest earning potential, with monthly revenues capable of climbing to $1,192, occupancy reaching a high of 41.8%, and ADRs peaking at $89.
- Conversely, the slowest single month of the year, typically falling within the low season, marks the market's lowest point. In this month, revenue might dip to $631, occupancy could drop to 25.3%, and ADRs may adjust down to $76.
- Understanding both the seasonal averages and these monthly peaks and troughs in revenue, occupancy, and ADR is crucial for maximizing your Airbnb profit potential in Johor Bahru.
Seasonal Strategies for Maximizing Profit
- Peak Season: Maximize revenue through premium pricing and potentially longer minimum stays. Ensure high availability.
- Low Season: Offer competitive pricing, special promotions (e.g., extended stay discounts), and flexible cancellation policies. Target off-season travelers like remote workers or budget-conscious guests.
- Shoulder Seasons: Implement dynamic pricing that balances peak and low rates. Target weekend travelers or specific events. Offer slightly more flexible terms than peak season.
- Regularly analyze your own performance against these Johor Bahru seasonality benchmarks and adjust your pricing and availability strategy accordingly.
Best Areas for Airbnb Investment in Johor Bahru (2026)
Exploring the top neighborhoods for short-term rentals in Johor Bahru? This section highlights key areas, outlining why they are attractive for hosts and guests, along with notable local attractions. Consider these locations based on your target guest profile and investment strategy.
| Neighborhood / Area | Why Host Here? (Target Guests & Appeal) | Key Attractions & Landmarks |
|---|---|---|
| City Square Mall | A bustling commercial hub and shopping center attracting both locals and tourists. Its proximity to many hotels makes it ideal for short-term rentals. | City Square Mall, Johor Bahru Old Chinese Temple, Komtar JBCC, Sultan Ibrahim Building, Danga Bay |
| Legoland Malaysia | A major family-friendly attraction that draws visitors from all over Malaysia and Singapore. Perfect for hosting families and groups looking for convenience and fun. | Legoland Malaysia, Puteri Harbour, Hello Kitty Town, Sanrio Hello Kitty Town, Mawilla Beach |
| Johor Bahru Heritage District | Rich in history and culture, this area is popular among tourists interested in exploring local heritage and architecture. It offers unique charm and character. | Sultan Abu Bakar State Mosque, Royal Abu Bakar Museum, Johor Bahru Old Chinese Temple, Dataran Bandaraya Johor Bahru |
| Kempas | A residential area that is gaining popularity with visitors for its proximity to shopping outlets and amenities, making it suitable for longer stays. | Kempas Medical Centre, Johor Premium Outlets, Kempas Mall |
| Mount Pulai | A serene area known for its natural beauty, perfect for those wanting to escape the city while still being close enough to urban conveniences. | Mount Pulai Recreational Forest, Waterfalls, Hiking trails, Wildlife |
| Taman Pelangi | This suburb is popular for its vibrant community life and recreational options, appealing to both local and foreign visitors for short stays. | Taman Pelangi Food Street, Shopping centers, Local eateries |
| Puteri Harbour | A picturesque marina area that's family-friendly and offers various dining and entertainment options, attracting both tourists and locals. | Puteri Harbour, The Els Club Desaru Coast, Family-friendly attractions |
| Bukit Indah | A thriving township that has become increasingly popular for housing and short-term rentals, appealing to families and expatriates. | AEON Mall Bukit Indah, Crown Colony, Water parks, Local markets |
Understanding Airbnb License Requirements & STR Laws in Johor Bahru (2026)
While Johor Bahru, Johor, Malaysia currently shows low STR regulations, specific Airbnb license requirements might still exist or change. Always verify the latest short term rental regulations and Airbnb license requirements directly with local government authorities for Johor Bahru to ensure full compliance before hosting.
(Source: AirROI data, 2026, based on 0% licensed listings)
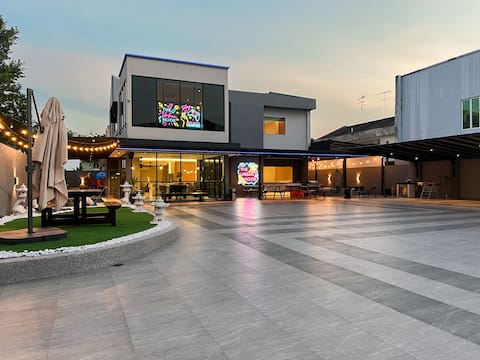
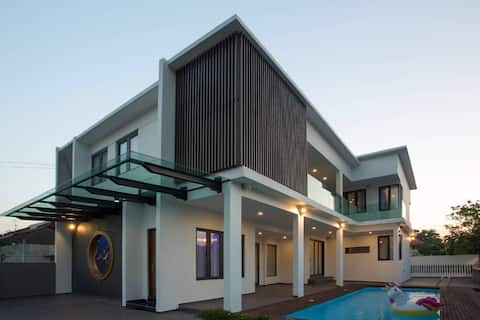
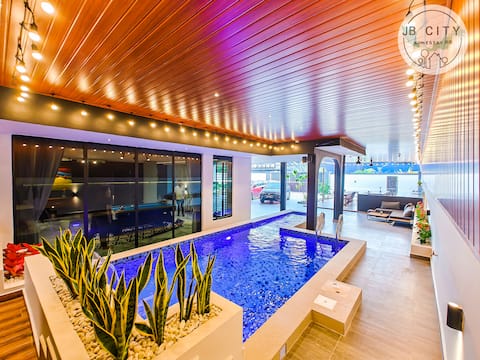
Top Performing Airbnb Properties in Johor Bahru (2026)
Benchmark your potential! Explore examples of top-performing Airbnb properties in Johor Bahrubased on Trailing Twelve Month (TTM) revenue. Analyze their characteristics, revenue, occupancy rate, and ADR to understand what drives success in this market.
JB town area Bungalow with swimming by Urban nook
Entire Place • 5 bedrooms
Reborn House Private Pool Homestay
Entire Place • 5 bedrooms

Skylight Villa Johor Bahru • Pool • Cinema • Ktv
Entire Place • 4 bedrooms
Grand Oasis Villa by RR JBcity
Entire Place • 6 bedrooms

JPP|Jiaotoujian Luxury Private KTV Room 120-inch TV BBQ Automatic Mahjong Machine Billiards PS4 Slee
Entire Place • 7 bedrooms

Starlight Villa Mount Austin • Pool • Karaoke
Entire Place • 4 bedrooms
Note: Performance varies based on location, size, amenities, seasonality, and management quality. Data reflects the past 12 months.
Top Performing Airbnb Hosts in Johor Bahru (2026)
Learn from the best! This table showcases top-performing Airbnb hosts in Johor Bahru based on the number of properties managed and estimated total revenue over the past year. Analyze their scale and performance metrics.
| Host Name | Properties | Grossing Revenue | Stay Reviews | Avg Rating |
|---|---|---|---|---|
| Anju | 249 | $3,682,399 | 10729 | 4.72/5.0 |
| Nest Home | 207 | $1,871,720 | 16163 | 4.81/5.0 |
| Stayrene | 169 | $1,513,884 | 4053 | 4.67/5.0 |
| Rentradise JBcity | 52 | $820,511 | 977 | 4.48/5.0 |
| Lions | 79 | $726,474 | 641 | 4.49/5.0 |
| See | 32 | $604,452 | 476 | 4.76/5.0 |
| Wilson | 75 | $583,285 | 12890 | 4.81/5.0 |
| Havona | 51 | $529,874 | 10730 | 4.73/5.0 |
| R9 HomeStay | 56 | $511,849 | 3382 | 4.59/5.0 |
| Ourstay | 79 | $462,681 | 1591 | 4.60/5.0 |
Analyzing the strategies of top hosts, such as their property selection, pricing, and guest communication, can offer valuable lessons for optimizing your own Airbnb operations in Johor Bahru.
Dive Deeper: Advanced Johor Bahru STR Market Data (2026)
Ready to unlock more insights? AirROI provides access to advanced metrics and comprehensive Airbnb data for Johor Bahru. Explore detailed analytics beyond this report to refine your investment strategy, optimize pricing, and maximize your vacation rental profits.
Explore Advanced MetricsJohor Bahru Short-Term Rental Market Composition (2026): Property & Room Types
Room Type Distribution
Property Type Distribution
Market Composition Insights for Johor Bahru
- The Johor Bahru Airbnb market composition is heavily skewed towards Entire Home/Apt listings, which make up 95.9% of the 4,630 active rentals. This indicates strong guest preference for privacy and space.
- Looking at the property type distribution in Johor Bahru, Apartment/Condo properties are the most common (91.6%), reflecting the local real estate landscape.
- Smaller segments like hotel/boutique, others, unique stays (combined 1.1%) offer potential for unique stay experiences.
Johor Bahru Airbnb Room Capacity Analysis (2026): Bedroom Distribution
Distribution of Listings by Number of Bedrooms
Room Capacity Insights for Johor Bahru
- The dominant room capacity in Johor Bahru is 2 bedrooms listings, making up 28.1% of the market. This suggests a strong demand for properties suitable for couples or solo travelers.
- Together, 2 bedrooms and 3 bedrooms properties represent 55.1% of the active Airbnb listings in Johor Bahru, indicating a high concentration in these sizes.
- A significant 35.5% of listings offer 3+ bedrooms, catering to larger groups and families seeking more space in Johor Bahru.
Johor Bahru Vacation Rental Guest Capacity Trends (2026)
Distribution of Listings by Guest Capacity
Guest Capacity Insights for Johor Bahru
- The most common guest capacity trend in Johor Bahru vacation rentals is listings accommodating 8+ guests (25.9%). This suggests the primary traveler segment is likely larger groups.
- Properties designed for 8+ guests and 4 guests dominate the Johor Bahru STR market, accounting for 47.1% of listings.
- 46.3% of properties accommodate 6+ guests, serving the market segment for larger families or group travel in Johor Bahru.
- On average, properties in Johor Bahru are equipped to host 5.1 guests.
Johor Bahru Airbnb Booking Patterns (2026): Available vs. Booked Days
Available Days Distribution
Booked Days Distribution
Booking Pattern Insights for Johor Bahru
- The most common availability pattern in Johor Bahru falls within the 271-366 days range, representing 64.4% of listings. This suggests many properties have significant open periods on their calendars.
- Approximately 92.3% of listings show high availability (181+ days open annually), indicating potential for increased bookings or specific owner usage patterns.
- For booked days, the 31-90 days range is most frequent in Johor Bahru (40.1%), reflecting common guest stay durations or potential owner blocking patterns.
- A notable 8.5% of properties secure long booking periods (181+ days booked per year), highlighting successful long-term rental strategies or significant owner usage.
Johor Bahru Airbnb Minimum Stay Requirements Analysis
Distribution of Listings by Minimum Night Requirement
1 Night
4448 listings
96.1% of total
2 Nights
72 listings
1.6% of total
3 Nights
5 listings
0.1% of total
4-6 Nights
8 listings
0.2% of total
7-29 Nights
11 listings
0.2% of total
30+ Nights
84 listings
1.8% of total
Key Insights
- The most prevalent minimum stay requirement in Johor Bahru is 1 Night, adopted by 96.1% of listings. This highlights the market's preference for shorter, flexible bookings.
- A strong majority (97.7%) of the Johor Bahru Airbnb data shows acceptance of very short stays (1-2 nights), indicating a dynamic, high-turnover market.
- Dedicated monthly rentals (30+ nights) represent a small niche (1.8%), possibly an untapped area for hosts.
Recommendations
- Align with the market by considering a 1 Night minimum stay, as 96.1% of Johor Bahru hosts use this setting.
- Adjust minimum nights based on seasonality – potentially shorter during low season and longer during peak demand periods in Johor Bahru.
Johor Bahru Airbnb Cancellation Policy Trends Analysis (2026)
Limited
34 listings
0.7% of total
Super Strict 30 Days
11 listings
0.2% of total
Flexible
1313 listings
28.4% of total
Moderate
2008 listings
43.4% of total
Firm
786 listings
17% of total
Strict
470 listings
10.2% of total
Cancellation Policy Insights for Johor Bahru
- The prevailing Airbnb cancellation policy trend in Johor Bahru is Moderate, used by 43.4% of listings.
- The market strongly favors guest-friendly terms, with 71.8% of listings offering Flexible or Moderate policies. This suggests guests in Johor Bahru may expect booking flexibility.
Recommendations for Hosts
- Consider adopting a Moderate policy to align with the 43.4% market standard in Johor Bahru.
- Using a Strict policy might deter some guests, as only 10.2% of listings use it. Evaluate if potential revenue protection outweighs possible lower booking rates.
- Regularly review your cancellation policy against competitors and market demand shifts in Johor Bahru.
Johor Bahru STR Booking Lead Time Analysis (2026)
Average Booking Lead Time by Month
Booking Lead Time Insights for Johor Bahru
- The overall average booking lead time for vacation rentals in Johor Bahru is 16 days.
- Guests book furthest in advance for stays during December (average 24 days), likely coinciding with peak travel demand or local events.
- The shortest booking windows occur for stays in May (average 12 days), indicating more last-minute travel plans during this time.
- Seasonally, Winter (19 days avg.) sees the longest lead times, while Spring (13 days avg.) has the shortest, reflecting typical travel planning cycles.
Recommendations for Hosts
- Use the overall average lead time (16 days) as a baseline for your pricing and availability strategy in Johor Bahru.
- Target marketing efforts for the Winter season well in advance (at least 19 days) to capture early planners.
- Monitor your own booking lead times against these Johor Bahru averages to identify opportunities for dynamic pricing adjustments.
Popular & Essential Airbnb Amenities in Johor Bahru (2026)
Amenity Prevalence
Amenity Insights for Johor Bahru
- Essential amenities in Johor Bahru that guests expect include: Air conditioning, Wifi, TV. Lacking these (any) could significantly impact bookings.
- Popular amenities like Free parking on premises, Hair dryer, Kitchen are common but not universal. Offering these can provide a competitive edge.
- A pool is a highly desired but not standard amenity, making it a key feature for attracting guests seeking leisure in Johor Bahru.
Recommendations for Hosts
- Ensure your listing includes all essential amenities for Johor Bahru: Air conditioning, Wifi, TV.
- Prioritize adding missing essentials: Air conditioning, Wifi, TV.
- Consider adding popular differentiators like Free parking on premises or Hair dryer to increase appeal.
- Highlight unique or less common amenities you offer (e.g., hot tub, dedicated workspace, EV charger) in your listing description and photos.
- Regularly check competitor amenities in Johor Bahru to stay competitive.
Johor Bahru Airbnb Guest Demographics & Profile Analysis (2026)
Guest Profile Summary for Johor Bahru
- The typical guest profile for Airbnb in Johor Bahru consists of predominantly international visitors (76%), with top international origins including Malaysia, typically belonging to the Post-2000s (Gen Z/Alpha) group (50%), primarily speaking English or Chinese.
- Domestic travelers account for 24.3% of guests.
- Key international markets include Singapore (66.9%) and Malaysia (24.3%).
- Top languages spoken are English (48%) followed by Chinese (24.4%).
- A significant demographic segment is the Post-2000s (Gen Z/Alpha) group, representing 50% of guests.
Recommendations for Hosts
- Focus marketing internationally, particularly towards travelers from Malaysia.
- Tailor amenities and listing descriptions to appeal to the dominant Post-2000s (Gen Z/Alpha) demographic (e.g., highlight fast WiFi, smart home features, local guides).
- Highlight unique local experiences or amenities relevant to the primary guest profile.
- Consider seasonal promotions aligned with peak travel times for key origin markets.
Nearby Short-Term Rental Market Comparison
How does the Johor Bahru Airbnb market stack up against its neighbors? Compare key performance metrics like average monthly revenue, ADR, and occupancy rates in surrounding areas to understand the broader regional STR landscape.
| Market | Active Properties | Monthly Revenue | Daily Rate | Avg. Occupancy |
|---|---|---|---|---|
| Kuala Sungai Baru | 13 | $1,093 | $156.49 | 22% |
| Singapore | 937 | $954 | $181.86 | 28% |
| Pulau Sebang | 88 | $916 | $203.35 | 19% |
| Alor Gajah | 95 | $659 | $146.75 | 18% |
| Jasin | 40 | $608 | $123.36 | 18% |
| Kampung Bukit Payung | 10 | $539 | $164.67 | 20% |
| Hang Tuah Jaya Municipal Council | 60 | $532 | $121.53 | 17% |
| Bandar Penawar | 252 | $521 | $121.90 | 18% |
| Kulai | 122 | $520 | $95.32 | 27% |
| Melaka | 32 | $520 | $112.64 | 17% |