Antananarivo Airbnb Market Analysis 2026: Short Term Rental Data & Vacation Rental Statistics in Analamanga, Madagascar
Is Airbnb profitable in Antananarivo in 2026? Explore comprehensive Airbnb analytics for Antananarivo, Analamanga, Madagascar to uncover income potential. This 2026 STR market report for Antananarivo, based on AirROI data from February 2025 to January 2026, reveals key trends in the niche market of 167 active listings.
Whether you're considering an Airbnb investment in Antananarivo, optimizing your existing vacation rental, or exploring rental arbitrage opportunities, understanding the Antananarivo Airbnb data is crucial. Leveraging the low regulation environment is key to maximizing your short term rental income potential. Let's dive into the specifics.
Key Antananarivo Airbnb Performance Metrics Overview
Monthly Airbnb Revenue Variations & Income Potential in Antananarivo (2026)
Understanding the monthly revenue variations for Airbnb listings in Antananarivo is key to maximizing your short term rental income potential. Seasonality significantly impacts earnings. Our analysis, based on data from the past 12 months, shows that the peak revenue month for STRs in Antananarivo is typically July, while November often presents the lowest earnings, highlighting opportunities for strategic pricing adjustments during shoulder and low seasons. Explore the typical Airbnb income in Antananarivo across different performance tiers:
- Best-in-class properties (Top 10%) achieve $1,272+ monthly, often utilizing dynamic pricing and superior guest experiences.
- Strong performing properties (Top 25%) earn $699 or more, indicating effective management and desirable locations/amenities.
- Typical properties (Median) generate around $351 per month, representing the average market performance.
- Entry-level properties (Bottom 25%) see earnings around $153, often with potential for optimization.
Average Monthly Airbnb Earnings Trend in Antananarivo
Antananarivo Airbnb Occupancy Rate Trends (2026)
Maximize your bookings by understanding the Antananarivo STR occupancy trends. Seasonal demand shifts significantly influence how often properties are booked. Typically, Julysees the highest demand (peak season occupancy), while November experiences the lowest (low season). Effective strategies, like adjusting minimum stays or offering promotions, can boost occupancy during slower periods. Here's how different property tiers perform in Antananarivo:
- Best-in-class properties (Top 10%) achieve 76%+ occupancy, indicating high desirability and potentially optimized availability.
- Strong performing properties (Top 25%) maintain 51% or higher occupancy, suggesting good market fit and guest satisfaction.
- Typical properties (Median) have an occupancy rate around 27%.
- Entry-level properties (Bottom 25%) average 13% occupancy, potentially facing higher vacancy.
Average Monthly Occupancy Rate Trend in Antananarivo
Average Daily Rate (ADR) Airbnb Trends in Antananarivo (2026)
Effective short term rental pricing strategy in Antananarivo involves understanding monthly ADR fluctuations. The Average Daily Rate (ADR) for Airbnb in Antananarivo typically peaks in September and dips lowest during March. Leveraging Airbnb dynamic pricing tools or strategies based on this seasonality can significantly boost revenue. Here's a look at the typical nightly rates achieved:
- Best-in-class properties (Top 10%) command rates of $94+ per night, often due to premium features or locations.
- Strong performing properties (Top 25%) achieve nightly rates of $64 or more.
- Typical properties (Median) charge around $39 per night.
- Entry-level properties (Bottom 25%) earn around $27 per night.
Average Daily Rate (ADR) Trend by Month in Antananarivo
Get Live Antananarivo Market Intelligence 👇

Explore Real-time Analytics
Airbnb Seasonality Analysis & Trends in Antananarivo (2026)
Peak Season (July, December, April)
- Revenue averages $577 per month
- Occupancy rates average 35.8%
- Daily rates average $52
Shoulder Season
- Revenue averages $550 per month
- Occupancy maintains around 34.6%
- Daily rates hold near $52
Low Season (February, October, November)
- Revenue drops to average $504 per month
- Occupancy decreases to average 33.4%
- Daily rates adjust to average $53
Seasonality Insights for Antananarivo
- The Airbnb seasonality in Antananarivo shows relatively stable year-round demand. While the sections above show seasonal averages, it's also insightful to look at the extremes:
- During the high season, the absolute peak month showcases Antananarivo's highest earning potential, with monthly revenues capable of climbing to $581, occupancy reaching a high of 37.9%, and ADRs peaking at $54.
- Conversely, the slowest single month of the year, typically falling within the low season, marks the market's lowest point. In this month, revenue might dip to $468, occupancy could drop to 29.1%, and ADRs may adjust down to $50.
- Understanding both the seasonal averages and these monthly peaks and troughs in revenue, occupancy, and ADR is crucial for maximizing your Airbnb profit potential in Antananarivo.
Seasonal Strategies for Maximizing Profit
- Peak Season: Maximize revenue through premium pricing and potentially longer minimum stays. Ensure high availability.
- Low Season: Offer competitive pricing, special promotions (e.g., extended stay discounts), and flexible cancellation policies. Target off-season travelers like remote workers or budget-conscious guests.
- Shoulder Seasons: Implement dynamic pricing that balances peak and low rates. Target weekend travelers or specific events. Offer slightly more flexible terms than peak season.
- Regularly analyze your own performance against these Antananarivo seasonality benchmarks and adjust your pricing and availability strategy accordingly.
Best Areas for Airbnb Investment in Antananarivo (2026)
Exploring the top neighborhoods for short-term rentals in Antananarivo? This section highlights key areas, outlining why they are attractive for hosts and guests, along with notable local attractions. Consider these locations based on your target guest profile and investment strategy.
| Neighborhood / Area | Why Host Here? (Target Guests & Appeal) | Key Attractions & Landmarks |
|---|---|---|
| Antananarivo City Center | The bustling heart of the capital, known for its historical sites, markets, and vibrant culture. A prime spot for travelers looking to experience local life and attractions. | Rova of Antananarivo, Analakely Market, Andafiavaratra Palace, Lemur Park, Ambohimanga |
| Isoraka | A charming area with a lively atmosphere, filled with cafes, restaurants, and shops. Popular with both tourists and locals, offering a unique blend of urban life and culture. | Pavé Karandry, Parc de l'Ankerana, The Royal Palace, Artisan Markets, Cultural Performances |
| Ivandry | A quiet residential neighborhood that offers a range of boutique accommodations and easy access to the city's business districts, making it attractive for longer stays. | Ivandry Golf Club, Local eateries, Ankorondrano market, Art galleries, Spas and wellness centers |
| Antananarivo Analakely | Known for its bustling marketplace and proximity to many attractions, this area is perfect for those who want to be close to the action and local culture. | Analakely Market, Independence Avenue, Karembola Avenue, Local cuisine spots, Nearby cultural festivals |
| Tsaralalàna | A cultural hub with museums and historical sites, this area draws visitors interested in Madagascar's rich heritage and local art scenes. | Museum of Art and Archaeology, Malagasy Arts Museum, Artisan workshops, Performance arts center, Historical buildings |
| Ambatobe | A peaceful suburban area offering a retreat from the urban bustle, popular with families and those seeking a quieter stay close to the city. | Ambatobe Park, Local parks and gardens, Shopping centers, Family-friendly restaurants, Cultural events |
| Antananarivo Ivato | Home to the international airport and some beautiful landscapes, this area is ideal for travelers arriving in Madagascar and for nature enthusiasts. | Ivato International Airport, Lemur Park, Scenic viewpoints, Hiking trails, Cultural encounters |
| Ankazomanga | A dynamic area that blends residential life with access to modern amenities, popular among expatriates and locals alike. | Local artisanal shops, Cafes and restaurants, Community events, Cultural showcases, Sports facilities |
Understanding Airbnb License Requirements & STR Laws in Antananarivo (2026)
While Antananarivo, Analamanga, Madagascar currently shows low STR regulations, specific Airbnb license requirements might still exist or change. Always verify the latest short term rental regulations and Airbnb license requirements directly with local government authorities for Antananarivo to ensure full compliance before hosting.
(Source: AirROI data, 2026, finding no licensed listings among those analyzed)
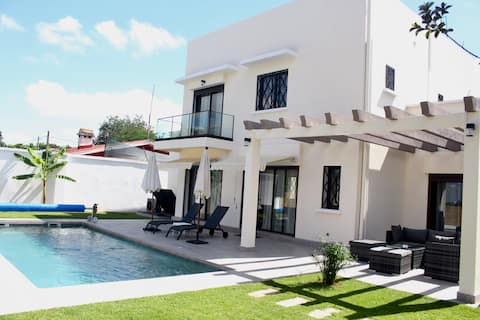
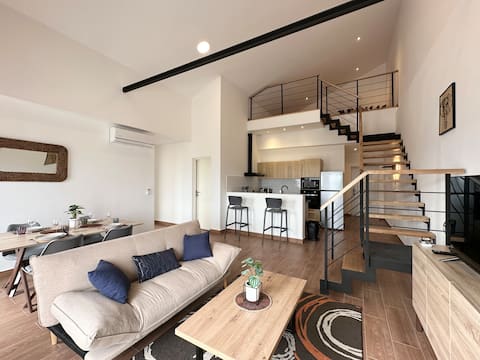
Top Performing Airbnb Properties in Antananarivo (2026)
Benchmark your potential! Explore examples of top-performing Airbnb properties in Antananarivobased on Trailing Twelve Month (TTM) revenue. Analyze their characteristics, revenue, occupancy rate, and ADR to understand what drives success in this market.

Raffia Home Antananarivo
Entire Place • 4 bedrooms
Villa Azalea Androhibe
Entire Place • 3 bedrooms

Luxury Oasis | 360 View, Pool & Business
Entire Place • 4 bedrooms

A penthouse apartment with a great view
Entire Place • 3 bedrooms

Spacious 4BR villa near services w/ big garden
Entire Place • 4 bedrooms
Apartment in Upper Town
Entire Place • 2 bedrooms
Note: Performance varies based on location, size, amenities, seasonality, and management quality. Data reflects the past 12 months.
Top Performing Airbnb Hosts in Antananarivo (2026)
Learn from the best! This table showcases top-performing Airbnb hosts in Antananarivo based on the number of properties managed and estimated total revenue over the past year. Analyze their scale and performance metrics.
| Host Name | Properties | Grossing Revenue | Stay Reviews | Avg Rating |
|---|---|---|---|---|
| Ny Hasy Et Mino | 7 | $39,583 | 64 | 4.61/5.0 |
| Jean Pascal | 14 | $32,216 | 48 | 4.95/5.0 |
| Jessica | 1 | $25,444 | 17 | 4.94/5.0 |
| Grand Appart | 7 | $24,673 | 22 | 4.67/5.0 |
| Thierry | 1 | $23,074 | 6 | 5.00/5.0 |
| Louisette Ony Nirina | 1 | $21,332 | 63 | 4.90/5.0 |
| Aimee | 2 | $21,268 | 33 | 4.81/5.0 |
| Haja & Dominique | 1 | $17,522 | 36 | 4.97/5.0 |
| Ianja | 1 | $17,217 | 40 | 4.93/5.0 |
| Itokiana Andry | 1 | $14,745 | 27 | 4.59/5.0 |
Analyzing the strategies of top hosts, such as their property selection, pricing, and guest communication, can offer valuable lessons for optimizing your own Airbnb operations in Antananarivo.
Dive Deeper: Advanced Antananarivo STR Market Data (2026)
Ready to unlock more insights? AirROI provides access to advanced metrics and comprehensive Airbnb data for Antananarivo. Explore detailed analytics beyond this report to refine your investment strategy, optimize pricing, and maximize your vacation rental profits.
Explore Advanced MetricsAntananarivo Short-Term Rental Market Composition (2026): Property & Room Types
Room Type Distribution
Property Type Distribution
Market Composition Insights for Antananarivo
- The Antananarivo Airbnb market composition is heavily skewed towards Entire Home/Apt listings, which make up 80.2% of the 167 active rentals. This indicates strong guest preference for privacy and space.
- Looking at the property type distribution in Antananarivo, Apartment/Condo properties are the most common (59.3%), reflecting the local real estate landscape.
- Houses represent a significant 24% portion, catering likely to families or larger groups.
- The presence of 15% Hotel/Boutique listings indicates integration with traditional hospitality.
- Smaller segments like others, outdoor/unique (combined 1.8%) offer potential for unique stay experiences.
Antananarivo Airbnb Room Capacity Analysis (2026): Bedroom Distribution
Distribution of Listings by Number of Bedrooms
Room Capacity Insights for Antananarivo
- The dominant room capacity in Antananarivo is 1 bedroom listings, making up 38.3% of the market. This suggests a strong demand for properties suitable for couples or solo travelers.
- Together, 1 bedroom and 2 bedrooms properties represent 64.6% of the active Airbnb listings in Antananarivo, indicating a high concentration in these sizes.
- A significant 24.0% of listings offer 3+ bedrooms, catering to larger groups and families seeking more space in Antananarivo.
Antananarivo Vacation Rental Guest Capacity Trends (2026)
Distribution of Listings by Guest Capacity
Guest Capacity Insights for Antananarivo
- The most common guest capacity trend in Antananarivo vacation rentals is listings accommodating 2 guests (36.5%). This suggests the primary traveler segment is likely couples or solo travelers.
- Properties designed for 2 guests and 4 guests dominate the Antananarivo STR market, accounting for 54.5% of listings.
- 22.2% of properties accommodate 6+ guests, serving the market segment for larger families or group travel in Antananarivo.
- On average, properties in Antananarivo are equipped to host 3.4 guests.
Antananarivo Airbnb Booking Patterns (2026): Available vs. Booked Days
Available Days Distribution
Booked Days Distribution
Booking Pattern Insights for Antananarivo
- The most common availability pattern in Antananarivo falls within the 271-366 days range, representing 68.9% of listings. This suggests many properties have significant open periods on their calendars.
- Approximately 91.1% of listings show high availability (181+ days open annually), indicating potential for increased bookings or specific owner usage patterns.
- For booked days, the 1-30 days range is most frequent in Antananarivo (32.9%), reflecting common guest stay durations or potential owner blocking patterns.
- A notable 9.6% of properties secure long booking periods (181+ days booked per year), highlighting successful long-term rental strategies or significant owner usage.
Antananarivo Airbnb Minimum Stay Requirements Analysis
Distribution of Listings by Minimum Night Requirement
1 Night
63 listings
37.7% of total
2 Nights
40 listings
24% of total
3 Nights
18 listings
10.8% of total
4-6 Nights
13 listings
7.8% of total
7-29 Nights
4 listings
2.4% of total
30+ Nights
29 listings
17.4% of total
Key Insights
- The most prevalent minimum stay requirement in Antananarivo is 1 Night, adopted by 37.7% of listings. This highlights the market's preference for shorter, flexible bookings.
- A strong majority (61.7%) of the Antananarivo Airbnb data shows acceptance of very short stays (1-2 nights), indicating a dynamic, high-turnover market.
- A significant segment (17.4%) caters to monthly stays (30+ nights) in Antananarivo, pointing to opportunities in the extended-stay market.
Recommendations
- Align with the market by considering a 1 Night minimum stay, as 37.7% of Antananarivo hosts use this setting.
- Explore offering discounts for stays of 30+ nights to attract the 17.4% of the market seeking extended stays.
- Adjust minimum nights based on seasonality – potentially shorter during low season and longer during peak demand periods in Antananarivo.
Antananarivo Airbnb Cancellation Policy Trends Analysis (2026)
Limited
2 listings
1.2% of total
Flexible
90 listings
54.2% of total
Moderate
47 listings
28.3% of total
Firm
23 listings
13.9% of total
Strict
4 listings
2.4% of total
Cancellation Policy Insights for Antananarivo
- The prevailing Airbnb cancellation policy trend in Antananarivo is Flexible, used by 54.2% of listings.
- The market strongly favors guest-friendly terms, with 82.5% of listings offering Flexible or Moderate policies. This suggests guests in Antananarivo may expect booking flexibility.
- Strict cancellation policies are quite rare (2.4%), potentially making listings with this policy less competitive unless justified by high demand or property type.
Recommendations for Hosts
- Consider adopting a Flexible policy to align with the 54.2% market standard in Antananarivo.
- Given the high prevalence of Flexible policies (54.2%), offering this can enhance booking appeal, especially during shoulder seasons.
- Using a Strict policy might deter some guests, as only 2.4% of listings use it. Evaluate if potential revenue protection outweighs possible lower booking rates.
- Regularly review your cancellation policy against competitors and market demand shifts in Antananarivo.
Antananarivo STR Booking Lead Time Analysis (2026)
Average Booking Lead Time by Month
Booking Lead Time Insights for Antananarivo
- The overall average booking lead time for vacation rentals in Antananarivo is 27 days.
- Guests book furthest in advance for stays during July (average 40 days), likely coinciding with peak travel demand or local events.
- The shortest booking windows occur for stays in March (average 16 days), indicating more last-minute travel plans during this time.
- Seasonally, Summer (35 days avg.) sees the longest lead times, while Winter (21 days avg.) has the shortest, reflecting typical travel planning cycles.
Recommendations for Hosts
- Use the overall average lead time (27 days) as a baseline for your pricing and availability strategy in Antananarivo.
- For July stays, consider implementing length-of-stay discounts or slightly higher rates for bookings made less than 40 days out to capitalize on advance planning.
- Target marketing efforts for the Summer season well in advance (at least 35 days) to capture early planners.
- Monitor your own booking lead times against these Antananarivo averages to identify opportunities for dynamic pricing adjustments.
Popular & Essential Airbnb Amenities in Antananarivo (2026)
Amenity Prevalence
Amenity Insights for Antananarivo
- Popular amenities like Wifi, Kitchen, TV are common but not universal. Offering these can provide a competitive edge.
- Warning: Wifi is not universally provided but is considered essential globally. Ensure reliable Wifi is offered.
Recommendations for Hosts
- Consider adding popular differentiators like Wifi or Kitchen to increase appeal.
- Highlight unique or less common amenities you offer (e.g., hot tub, dedicated workspace, EV charger) in your listing description and photos.
- Regularly check competitor amenities in Antananarivo to stay competitive.
Antananarivo Airbnb Guest Demographics & Profile Analysis (2026)
Guest Profile Summary for Antananarivo
- The typical guest profile for Airbnb in Antananarivo consists of predominantly international visitors (98%), with top international origins including United States, typically belonging to the Post-2000s (Gen Z/Alpha) group (50%), primarily speaking English or French.
- Domestic travelers account for 2.1% of guests.
- Key international markets include France (43.4%) and United States (12.6%).
- Top languages spoken are English (37.7%) followed by French (30.4%).
- A significant demographic segment is the Post-2000s (Gen Z/Alpha) group, representing 50% of guests.
Recommendations for Hosts
- Focus marketing internationally, particularly towards travelers from United States.
- Tailor amenities and listing descriptions to appeal to the dominant Post-2000s (Gen Z/Alpha) demographic (e.g., highlight fast WiFi, smart home features, local guides).
- Highlight unique local experiences or amenities relevant to the primary guest profile.
- Consider seasonal promotions aligned with peak travel times for key origin markets.
Nearby Short-Term Rental Market Comparison
How does the Antananarivo Airbnb market stack up against its neighbors? Compare key performance metrics like average monthly revenue, ADR, and occupancy rates in surrounding areas to understand the broader regional STR landscape.
| Market | Active Properties | Monthly Revenue | Daily Rate | Avg. Occupancy |
|---|---|---|---|---|
| Ambohidratrimo | 12 | $172 | $47.30 | 27% |
| Mandrosoa | 12 | $153 | $61.81 | 30% |
| Antsirabe | 10 | $147 | $52.79 | 17% |