Neringa Airbnb Market Analysis 2026: Short Term Rental Data & Vacation Rental Statistics in Klaipeda County, Lithuania
Is Airbnb profitable in Neringa in 2026? Explore comprehensive Airbnb analytics for Neringa, Klaipeda County, Lithuania to uncover income potential. This 2026 STR market report for Neringa, based on AirROI data from February 2025 to January 2026, reveals key trends in the market of 230 active listings.
Whether you're considering an Airbnb investment in Neringa, optimizing your existing vacation rental, or exploring rental arbitrage opportunities, understanding the Neringa Airbnb data is crucial. Leveraging the low regulation environment is key to maximizing your short term rental income potential. Let's dive into the specifics.
Key Neringa Airbnb Performance Metrics Overview
Monthly Airbnb Revenue Variations & Income Potential in Neringa (2026)
Understanding the monthly revenue variations for Airbnb listings in Neringa is key to maximizing your short term rental income potential. Seasonality significantly impacts earnings. Our analysis, based on data from the past 12 months, shows that the peak revenue month for STRs in Neringa is typically July, while January often presents the lowest earnings, highlighting opportunities for strategic pricing adjustments during shoulder and low seasons. Explore the typical Airbnb income in Neringa across different performance tiers:
- Best-in-class properties (Top 10%) achieve $2,041+ monthly, often utilizing dynamic pricing and superior guest experiences.
- Strong performing properties (Top 25%) earn $1,377 or more, indicating effective management and desirable locations/amenities.
- Typical properties (Median) generate around $777 per month, representing the average market performance.
- Entry-level properties (Bottom 25%) see earnings around $376, often with potential for optimization.
Average Monthly Airbnb Earnings Trend in Neringa
Neringa Airbnb Occupancy Rate Trends (2026)
Maximize your bookings by understanding the Neringa STR occupancy trends. Seasonal demand shifts significantly influence how often properties are booked. Typically, Julysees the highest demand (peak season occupancy), while January experiences the lowest (low season). Effective strategies, like adjusting minimum stays or offering promotions, can boost occupancy during slower periods. Here's how different property tiers perform in Neringa:
- Best-in-class properties (Top 10%) achieve 56%+ occupancy, indicating high desirability and potentially optimized availability.
- Strong performing properties (Top 25%) maintain 40% or higher occupancy, suggesting good market fit and guest satisfaction.
- Typical properties (Median) have an occupancy rate around 22%.
- Entry-level properties (Bottom 25%) average 11% occupancy, potentially facing higher vacancy.
Average Monthly Occupancy Rate Trend in Neringa
Average Daily Rate (ADR) Airbnb Trends in Neringa (2026)
Effective short term rental pricing strategy in Neringa involves understanding monthly ADR fluctuations. The Average Daily Rate (ADR) for Airbnb in Neringa typically peaks in July and dips lowest during March. Leveraging Airbnb dynamic pricing tools or strategies based on this seasonality can significantly boost revenue. Here's a look at the typical nightly rates achieved:
- Best-in-class properties (Top 10%) command rates of $204+ per night, often due to premium features or locations.
- Strong performing properties (Top 25%) achieve nightly rates of $146 or more.
- Typical properties (Median) charge around $108 per night.
- Entry-level properties (Bottom 25%) earn around $82 per night.
Average Daily Rate (ADR) Trend by Month in Neringa
Get Live Neringa Market Intelligence 👇

Explore Real-time Analytics
Airbnb Seasonality Analysis & Trends in Neringa (2026)
Peak Season (July, August, June)
- Revenue averages $1,923 per month
- Occupancy rates average 42.5%
- Daily rates average $141
Shoulder Season
- Revenue averages $774 per month
- Occupancy maintains around 24.7%
- Daily rates hold near $119
Low Season (January, February, November)
- Revenue drops to average $421 per month
- Occupancy decreases to average 16.3%
- Daily rates adjust to average $117
Seasonality Insights for Neringa
- The Airbnb seasonality in Neringa shows highly seasonal trends requiring careful strategy. While the sections above show seasonal averages, it's also insightful to look at the extremes:
- During the high season, the absolute peak month showcases Neringa's highest earning potential, with monthly revenues capable of climbing to $2,338, occupancy reaching a high of 49.5%, and ADRs peaking at $146.
- Conversely, the slowest single month of the year, typically falling within the low season, marks the market's lowest point. In this month, revenue might dip to $391, occupancy could drop to 13.1%, and ADRs may adjust down to $111.
- Understanding both the seasonal averages and these monthly peaks and troughs in revenue, occupancy, and ADR is crucial for maximizing your Airbnb profit potential in Neringa.
Seasonal Strategies for Maximizing Profit
- Peak Season: Maximize revenue through premium pricing and potentially longer minimum stays. Ensure high availability.
- Low Season: Offer competitive pricing, special promotions (e.g., extended stay discounts), and flexible cancellation policies. Target off-season travelers like remote workers or budget-conscious guests.
- Shoulder Seasons: Implement dynamic pricing that balances peak and low rates. Target weekend travelers or specific events. Offer slightly more flexible terms than peak season.
- Regularly analyze your own performance against these Neringa seasonality benchmarks and adjust your pricing and availability strategy accordingly.
Best Areas for Airbnb Investment in Neringa (2026)
Exploring the top neighborhoods for short-term rentals in Neringa? This section highlights key areas, outlining why they are attractive for hosts and guests, along with notable local attractions. Consider these locations based on your target guest profile and investment strategy.
| Neighborhood / Area | Why Host Here? (Target Guests & Appeal) | Key Attractions & Landmarks |
|---|---|---|
| Nida | Nida is a picturesque resort town known for its stunning sand dunes and beautiful beaches. It's popular among tourists for its natural beauty and unique cultural heritage, making it an ideal location for Airbnb hosts. | Curonian Spit, Nida Beach, Thomas Mann Museum, Nida Lighthouse, Ethnographic Fisherman's Museum, Sea Museum |
| Juodkrantė | Juodkrantė is a coastal village located on the Curonian Spit, known for its tranquil ambiance and scenic surroundings. Ideal for visitors seeking peace and nature, attracting tourists year-round. | Curonian Spit National Park, Rugelis Hill, Amber Bay, Witches' Walk, Juodkrantė Beach |
| Šventoji | Šventoji is a charming seaside resort known for its sandy beaches and family-friendly atmosphere. It combines nature and entertainment, attracting families and tourists looking for recreational activities. | Šventoji Beach, Fishing Village, Dunes of Šventoji, Local Markets, Bike Trails |
| Palanga | Palanga is the most famous seaside resort in Lithuania, known for its vibrant nightlife, long beaches, and beautiful pier. It's a hotspot for both summer tourists and travelers looking for activities. | Palanga Beach, Palanga Pier, Amber Museum, Botanical Park, Concert Hall |
| Klaipeda | Klaipeda, the only port city in Lithuania, offers a blend of urban experience and coastal charm. It is a great base for tourists exploring the region, making it attractive for Airbnb investments. | Klaipeda Old Town, Meridianas Ship, Lithuanian Sea Museum, Cultural Factory, Ferry to Curonian Spit |
| Žalgiris Park | Žalgiris Park is a natural retreat with beautiful landscapes and recreational opportunities. It's popular among tourists looking for nature experiences, hiking, and relaxation. | Žalgiris Park Trails, Lakes, Picnic Areas, Wildlife Watching |
| Russalka | Russalka is a quieter neighborhood known for its beautiful forested areas and proximity to the beach, perfect for those looking for a serene getaway. | Beach Access, Natural Reserves, Cycling Paths, Calm Environment |
| Neringa National Park | Home to vast nature reserves and unique ecosystems, this area attracts ecotourism and nature enthusiasts, providing ample opportunities for memorable stays. | Neringa Reserve, Dune Trails, Biking Routes, Nature Observations |
Understanding Airbnb License Requirements & STR Laws in Neringa (2026)
While Neringa, Klaipeda County, Lithuania currently shows low STR regulations, specific Airbnb license requirements might still exist or change. Always verify the latest short term rental regulations and Airbnb license requirements directly with local government authorities for Neringa to ensure full compliance before hosting.
(Source: AirROI data, 2026, finding no licensed listings among those analyzed)
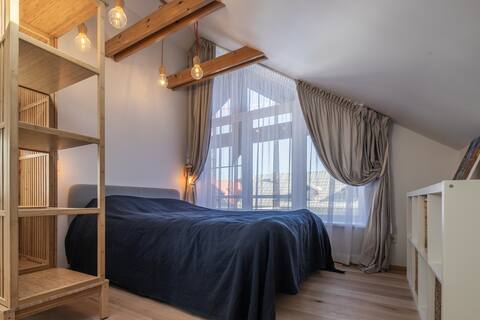
Top Performing Airbnb Properties in Neringa (2026)
Benchmark your potential! Explore examples of top-performing Airbnb properties in Neringabased on Trailing Twelve Month (TTM) revenue. Analyze their characteristics, revenue, occupancy rate, and ADR to understand what drives success in this market.

"Family Villa" house
Entire Place • 4 bedrooms

Molo Namai Nida
Entire Place • 2 bedrooms

★Studio & Sunrise •Nida•★ ⥣Self Check-In⥣
Entire Place • 1 bedroom

Hygge Nida
Entire Place • 2 bedrooms

NEW scandinavian style apartment in Nida
Entire Place • N/A
Nida Urbas Hill Apartments
Entire Place • 1 bedroom
Note: Performance varies based on location, size, amenities, seasonality, and management quality. Data reflects the past 12 months.
Top Performing Airbnb Hosts in Neringa (2026)
Learn from the best! This table showcases top-performing Airbnb hosts in Neringa based on the number of properties managed and estimated total revenue over the past year. Analyze their scale and performance metrics.
| Host Name | Properties | Grossing Revenue | Stay Reviews | Avg Rating |
|---|---|---|---|---|
| Arnas | 12 | $76,860 | 94 | 4.59/5.0 |
| Donaldas | 3 | $55,622 | 97 | 4.88/5.0 |
| Vila Preiloja | 5 | $51,987 | 99 | 4.97/5.0 |
| Cohost Lt | 4 | $44,709 | 57 | 4.77/5.0 |
| Justina | 3 | $39,050 | 380 | 4.87/5.0 |
| Rokas | 2 | $35,411 | 10 | 4.93/5.0 |
| Kornelija | 3 | $34,587 | 137 | 4.86/5.0 |
| Daiva | 1 | $28,100 | 8 | 4.75/5.0 |
| Butukas | 2 | $28,094 | 39 | 4.89/5.0 |
| Guboja | 4 | $26,078 | 182 | 4.53/5.0 |
Analyzing the strategies of top hosts, such as their property selection, pricing, and guest communication, can offer valuable lessons for optimizing your own Airbnb operations in Neringa.
Dive Deeper: Advanced Neringa STR Market Data (2026)
Ready to unlock more insights? AirROI provides access to advanced metrics and comprehensive Airbnb data for Neringa. Explore detailed analytics beyond this report to refine your investment strategy, optimize pricing, and maximize your vacation rental profits.
Explore Advanced MetricsNeringa Short-Term Rental Market Composition (2026): Property & Room Types
Room Type Distribution
Property Type Distribution
Market Composition Insights for Neringa
- The Neringa Airbnb market composition is heavily skewed towards Entire Home/Apt listings, which make up 85.7% of the 230 active rentals. This indicates strong guest preference for privacy and space.
- Looking at the property type distribution in Neringa, Apartment/Condo properties are the most common (78.3%), reflecting the local real estate landscape.
- The presence of 6.5% Hotel/Boutique listings indicates integration with traditional hospitality.
- Smaller segments like outdoor/unique, others (combined 2.6%) offer potential for unique stay experiences.
Neringa Airbnb Room Capacity Analysis (2026): Bedroom Distribution
Distribution of Listings by Number of Bedrooms
Room Capacity Insights for Neringa
- The dominant room capacity in Neringa is 1 bedroom listings, making up 51.7% of the market. This suggests a strong demand for properties suitable for couples or solo travelers.
- Together, 1 bedroom and 2 bedrooms properties represent 76.0% of the active Airbnb listings in Neringa, indicating a high concentration in these sizes.
- With over half the market (51.7%) consisting of studios or 1-bedroom units, Neringa is particularly well-suited for individuals or couples.
- Listings with 3+ bedrooms (5.6%) represent a smaller niche, potentially indicating an underserved market for larger group accommodations in Neringa.
Neringa Vacation Rental Guest Capacity Trends (2026)
Distribution of Listings by Guest Capacity
Guest Capacity Insights for Neringa
- The most common guest capacity trend in Neringa vacation rentals is listings accommodating 4 guests (37.4%). This suggests the primary traveler segment is likely small families or groups.
- Properties designed for 4 guests and 2 guests dominate the Neringa STR market, accounting for 57.4% of listings.
- 14.3% of properties accommodate 6+ guests, serving the market segment for larger families or group travel in Neringa.
- On average, properties in Neringa are equipped to host 3.7 guests.
Neringa Airbnb Booking Patterns (2026): Available vs. Booked Days
Available Days Distribution
Booked Days Distribution
Booking Pattern Insights for Neringa
- The most common availability pattern in Neringa falls within the 271-366 days range, representing 85.2% of listings. This suggests many properties have significant open periods on their calendars.
- Approximately 98.7% of listings show high availability (181+ days open annually), indicating potential for increased bookings or specific owner usage patterns.
- For booked days, the 31-90 days range is most frequent in Neringa (48.7%), reflecting common guest stay durations or potential owner blocking patterns.
- A notable 1.3% of properties secure long booking periods (181+ days booked per year), highlighting successful long-term rental strategies or significant owner usage.
Neringa Airbnb Minimum Stay Requirements Analysis
Distribution of Listings by Minimum Night Requirement
1 Night
26 listings
11.3% of total
2 Nights
49 listings
21.3% of total
3 Nights
23 listings
10% of total
4-6 Nights
40 listings
17.4% of total
7-29 Nights
2 listings
0.9% of total
30+ Nights
90 listings
39.1% of total
Key Insights
- The most prevalent minimum stay requirement in Neringa is 30+ Nights, adopted by 39.1% of listings. This highlights the market's preference for longer commitments.
- A significant segment (39.1%) caters to monthly stays (30+ nights) in Neringa, pointing to opportunities in the extended-stay market.
Recommendations
- Align with the market by considering a 30+ Nights minimum stay, as 39.1% of Neringa hosts use this setting.
- If feasible, allowing 1-night stays, especially midweek or during low season, could capture last-minute bookings, as only 11.3% currently do.
- Explore offering discounts for stays of 30+ nights to attract the 39.1% of the market seeking extended stays.
- Adjust minimum nights based on seasonality – potentially shorter during low season and longer during peak demand periods in Neringa.
Neringa Airbnb Cancellation Policy Trends Analysis (2026)
Limited
1 listings
0.4% of total
Flexible
33 listings
14.3% of total
Moderate
36 listings
15.7% of total
Firm
100 listings
43.5% of total
Strict
60 listings
26.1% of total
Cancellation Policy Insights for Neringa
- The prevailing Airbnb cancellation policy trend in Neringa is Firm, used by 43.5% of listings.
- A majority (69.6%) of hosts in Neringa utilize Firm or Strict policies, indicating a market where hosts prioritize booking security.
Recommendations for Hosts
- Consider adopting a Firm policy to align with the 43.5% market standard in Neringa.
- Regularly review your cancellation policy against competitors and market demand shifts in Neringa.
Neringa STR Booking Lead Time Analysis (2026)
Average Booking Lead Time by Month
Booking Lead Time Insights for Neringa
- The overall average booking lead time for vacation rentals in Neringa is 57 days.
- Guests book furthest in advance for stays during July (average 78 days), likely coinciding with peak travel demand or local events.
- The shortest booking windows occur for stays in February (average 19 days), indicating more last-minute travel plans during this time.
- Seasonally, Summer (69 days avg.) sees the longest lead times, while Winter (29 days avg.) has the shortest, reflecting typical travel planning cycles.
Recommendations for Hosts
- Use the overall average lead time (57 days) as a baseline for your pricing and availability strategy in Neringa.
- For July stays, consider implementing length-of-stay discounts or slightly higher rates for bookings made less than 78 days out to capitalize on advance planning.
- Target marketing efforts for the Summer season well in advance (at least 69 days) to capture early planners.
- Monitor your own booking lead times against these Neringa averages to identify opportunities for dynamic pricing adjustments.
Popular & Essential Airbnb Amenities in Neringa (2026)
Amenity Prevalence
Amenity Insights for Neringa
- Popular amenities like Wifi, Kitchen, TV are common but not universal. Offering these can provide a competitive edge.
- Warning: Wifi is not universally provided but is considered essential globally. Ensure reliable Wifi is offered.
Recommendations for Hosts
- Consider adding popular differentiators like Wifi or Kitchen to increase appeal.
- Highlight unique or less common amenities you offer (e.g., hot tub, dedicated workspace, EV charger) in your listing description and photos.
- Regularly check competitor amenities in Neringa to stay competitive.
Neringa Airbnb Guest Demographics & Profile Analysis (2026)
Guest Profile Summary for Neringa
- The typical guest profile for Airbnb in Neringa consists of a mix of domestic (51%) and international guests, often arriving from nearby Vilnius, typically belonging to the Post-2000s (Gen Z/Alpha) group (50%), primarily speaking English or Lithuanian.
- Domestic travelers account for 50.5% of guests.
- Key international markets include Lithuania (50.5%) and Germany (14.4%).
- Top languages spoken are English (44.5%) followed by Lithuanian (15.4%).
- A significant demographic segment is the Post-2000s (Gen Z/Alpha) group, representing 50% of guests.
Recommendations for Hosts
- Balance marketing efforts between domestic and international channels based on the guest mix.
- Tailor amenities and listing descriptions to appeal to the dominant Post-2000s (Gen Z/Alpha) demographic (e.g., highlight fast WiFi, smart home features, local guides).
- Highlight unique local experiences or amenities relevant to the primary guest profile.
- Consider seasonal promotions aligned with peak travel times for key origin markets.
Nearby Short-Term Rental Market Comparison
How does the Neringa Airbnb market stack up against its neighbors? Compare key performance metrics like average monthly revenue, ADR, and occupancy rates in surrounding areas to understand the broader regional STR landscape.
| Market | Active Properties | Monthly Revenue | Daily Rate | Avg. Occupancy |
|---|---|---|---|---|
| Vērgales pagasts | 17 | $1,027 | $117.67 | 37% |
| Nīcas pagasts | 45 | $851 | $128.42 | 32% |
| Svencelė | 20 | $580 | $151.27 | 26% |
| Jūrkalnes pagasts | 18 | $548 | $178.53 | 29% |
| gmina Lidzbark Warmiński | 17 | $547 | $145.34 | 26% |
| Klaipėda | 420 | $527 | $84.24 | 33% |
| Liepaja | 201 | $489 | $82.75 | 33% |
| Palanga | 824 | $475 | $115.22 | 28% |
| Liepāja | 52 | $469 | $81.34 | 37% |
| Pāvilosta | 28 | $464 | $105.20 | 31% |