Riga Airbnb Market Analysis 2026: Short Term Rental Data & Vacation Rental Statistics in Vidzeme, Latvia
Is Airbnb profitable in Riga in 2026? Explore comprehensive Airbnb analytics for Riga, Vidzeme, Latvia to uncover income potential. This 2026 STR market report for Riga, based on AirROI data from February 2025 to January 2026, reveals key trends in the bustling market of 2,178 active listings.
Whether you're considering an Airbnb investment in Riga, optimizing your existing vacation rental, or exploring rental arbitrage opportunities, understanding the Riga Airbnb data is crucial. Leveraging the low regulation environment is key to maximizing your short term rental income potential. Let's dive into the specifics.
Key Riga Airbnb Performance Metrics Overview
Monthly Airbnb Revenue Variations & Income Potential in Riga (2026)
Understanding the monthly revenue variations for Airbnb listings in Riga is key to maximizing your short term rental income potential. Seasonality significantly impacts earnings. Our analysis, based on data from the past 12 months, shows that the peak revenue month for STRs in Riga is typically August, while January often presents the lowest earnings, highlighting opportunities for strategic pricing adjustments during shoulder and low seasons. Explore the typical Airbnb income in Riga across different performance tiers:
- Best-in-class properties (Top 10%) achieve $2,542+ monthly, often utilizing dynamic pricing and superior guest experiences.
- Strong performing properties (Top 25%) earn $1,703 or more, indicating effective management and desirable locations/amenities.
- Typical properties (Median) generate around $1,037 per month, representing the average market performance.
- Entry-level properties (Bottom 25%) see earnings around $550, often with potential for optimization.
Average Monthly Airbnb Earnings Trend in Riga
Riga Airbnb Occupancy Rate Trends (2026)
Maximize your bookings by understanding the Riga STR occupancy trends. Seasonal demand shifts significantly influence how often properties are booked. Typically, Augustsees the highest demand (peak season occupancy), while January experiences the lowest (low season). Effective strategies, like adjusting minimum stays or offering promotions, can boost occupancy during slower periods. Here's how different property tiers perform in Riga:
- Best-in-class properties (Top 10%) achieve 84%+ occupancy, indicating high desirability and potentially optimized availability.
- Strong performing properties (Top 25%) maintain 70% or higher occupancy, suggesting good market fit and guest satisfaction.
- Typical properties (Median) have an occupancy rate around 48%.
- Entry-level properties (Bottom 25%) average 24% occupancy, potentially facing higher vacancy.
Average Monthly Occupancy Rate Trend in Riga
Average Daily Rate (ADR) Airbnb Trends in Riga (2026)
Effective short term rental pricing strategy in Riga involves understanding monthly ADR fluctuations. The Average Daily Rate (ADR) for Airbnb in Riga typically peaks in September and dips lowest during February. Leveraging Airbnb dynamic pricing tools or strategies based on this seasonality can significantly boost revenue. Here's a look at the typical nightly rates achieved:
- Best-in-class properties (Top 10%) command rates of $149+ per night, often due to premium features or locations.
- Strong performing properties (Top 25%) achieve nightly rates of $102 or more.
- Typical properties (Median) charge around $71 per night.
- Entry-level properties (Bottom 25%) earn around $51 per night.
Average Daily Rate (ADR) Trend by Month in Riga
Get Live Riga Market Intelligence 👇

Explore Real-time Analytics
Airbnb Seasonality Analysis & Trends in Riga (2026)
Peak Season (August, July, September)
- Revenue averages $1,871 per month
- Occupancy rates average 58.4%
- Daily rates average $99
Shoulder Season
- Revenue averages $1,231 per month
- Occupancy maintains around 46.4%
- Daily rates hold near $86
Low Season (January, February, March)
- Revenue drops to average $832 per month
- Occupancy decreases to average 39.4%
- Daily rates adjust to average $79
Seasonality Insights for Riga
- The Airbnb seasonality in Riga shows highly seasonal trends requiring careful strategy. While the sections above show seasonal averages, it's also insightful to look at the extremes:
- During the high season, the absolute peak month showcases Riga's highest earning potential, with monthly revenues capable of climbing to $2,054, occupancy reaching a high of 62.6%, and ADRs peaking at $101.
- Conversely, the slowest single month of the year, typically falling within the low season, marks the market's lowest point. In this month, revenue might dip to $750, occupancy could drop to 31.0%, and ADRs may adjust down to $77.
- Understanding both the seasonal averages and these monthly peaks and troughs in revenue, occupancy, and ADR is crucial for maximizing your Airbnb profit potential in Riga.
Seasonal Strategies for Maximizing Profit
- Peak Season: Maximize revenue through premium pricing and potentially longer minimum stays. Ensure high availability.
- Low Season: Offer competitive pricing, special promotions (e.g., extended stay discounts), and flexible cancellation policies. Target off-season travelers like remote workers or budget-conscious guests.
- Shoulder Seasons: Implement dynamic pricing that balances peak and low rates. Target weekend travelers or specific events. Offer slightly more flexible terms than peak season.
- Regularly analyze your own performance against these Riga seasonality benchmarks and adjust your pricing and availability strategy accordingly.
Best Areas for Airbnb Investment in Riga (2026)
Exploring the top neighborhoods for short-term rentals in Riga? This section highlights key areas, outlining why they are attractive for hosts and guests, along with notable local attractions. Consider these locations based on your target guest profile and investment strategy.
| Neighborhood / Area | Why Host Here? (Target Guests & Appeal) | Key Attractions & Landmarks |
|---|---|---|
| Old City (Vecrīga) | Historical core of Riga, known for its medieval architecture, cobblestone streets, and rich cultural heritage. Highly attractive to tourists looking to explore Riga's history and vibrant atmosphere. | House of the Blackheads, St. Peter's Church, Riga Cathedral, Freedom Monument, Bremen Town Musicians Statue |
| Jūrmala | A popular resort town nearby Riga, known for its beautiful sandy beaches and spa culture. Attracts families and wellness seekers for weekends and summer vacations. | Jūrmala Beach, Dune Park, Jūrmala City Museum, Dzintari Concert Hall, Livu Akvaparks |
| Central District | The vibrant heart of the city with a mix of traditional and modern architecture, numerous shops, restaurants, and cultural venues. Ideal for visitors who want to experience local life. | Central Market, Riga Opera House, Bastejkalna Park, Krišjānis Barons Street, Art Nouveau Museum |
| Miera Street | An up-and-coming area known for its bohemian vibe, art scene, and trendy cafes. Popular among younger travelers and locals alike seeking a unique experience. | Miera Street cafés, Art galleries, Street art, Riga's creative workshops, Vegan restaurants |
| Riga Port | An industrial yet culturally rich area that serves as a gateway for cruise travelers. Offers a unique perspective of Riga’s maritime history and is popular for waterfront activities. | Riga Sea Port, Riga Lighthouse, Museum of the History of Riga and Navigation, Ferry rides to Finland, Restaurants with a view |
| Pārdaugava | A residential area across the river from the Old City, known for its parks and riverside walks. Attracts visitors from the Old Town looking for a quieter experience yet close to city attractions. | Ķīpsala, Ziedondārzs Park, Riga's Floating Bridge, Daugava River Promenade, Historical architecture |
| Kazinskis District | A neighborhood undergoing revitalization with a blend of old Soviet-style buildings and new developments. Draws interest for long-term stays and those looking to explore local culture. | Local markets, Parks and green spaces, Cultural events, Diverse dining options, Community activities |
| Imanta | A suburban neighborhood in Riga known for its family-oriented atmosphere and access to nature. Popular with families and those looking for a quieter setting while being close to the city. | Parks and playgrounds, Imanta Beach, Shopping centers, Nature trails, Public transport to city center |
Understanding Airbnb License Requirements & STR Laws in Riga (2026)
While Riga, Vidzeme, Latvia currently shows low STR regulations, specific Airbnb license requirements might still exist or change. Always verify the latest short term rental regulations and Airbnb license requirements directly with local government authorities for Riga to ensure full compliance before hosting.
(Source: AirROI data, 2026, based on 0% licensed listings)
Top Performing Airbnb Properties in Riga (2026)
Benchmark your potential! Explore examples of top-performing Airbnb properties in Rigabased on Trailing Twelve Month (TTM) revenue. Analyze their characteristics, revenue, occupancy rate, and ADR to understand what drives success in this market.
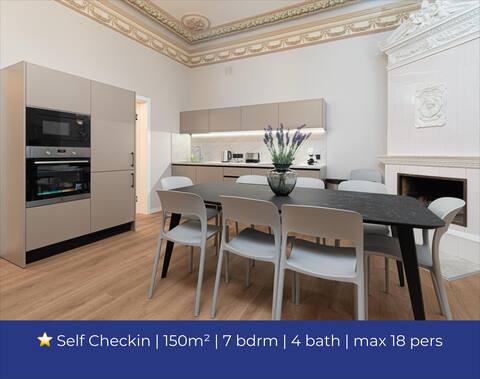
D⓷ Dzirnavu | by Dandelion Apartments & Suites
Entire Place • 7 bedrooms

Old Town Charm 5bedrm 178sqm 7 rooms appartment
Entire Place • 5 bedrooms

L⓸ Lacplesa | by Dandelion Apartments & Suites
Entire Place • 7 bedrooms
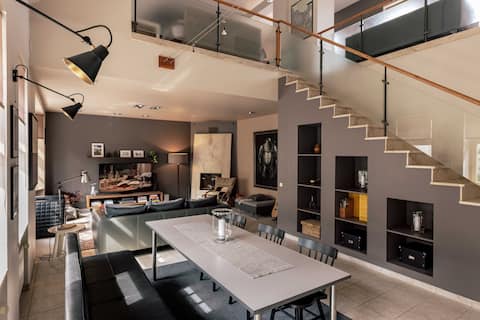
Spacious 2-story apt. w/ terrace - 280 m2
Entire Place • 3 bedrooms
4 BR apartment in Riga Old Town with View & AC
Entire Place • 3 bedrooms

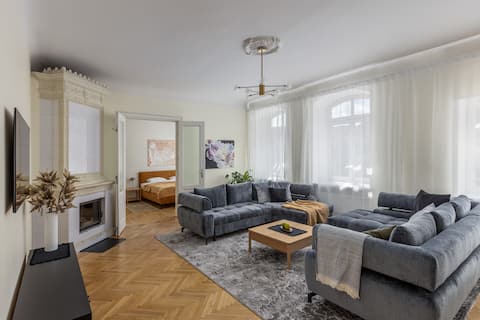
Birch Living: central & new 3-BR design apartment
Entire Place • 3 bedrooms
Note: Performance varies based on location, size, amenities, seasonality, and management quality. Data reflects the past 12 months.
Top Performing Airbnb Hosts in Riga (2026)
Learn from the best! This table showcases top-performing Airbnb hosts in Riga based on the number of properties managed and estimated total revenue over the past year. Analyze their scale and performance metrics.
| Host Name | Properties | Grossing Revenue | Stay Reviews | Avg Rating |
|---|---|---|---|---|
| Bnbverit | 170 | $2,681,720 | 9548 | 4.77/5.0 |
| Martin | 134 | $2,154,660 | 6625 | 4.93/5.0 |
| Igor | 42 | $1,226,396 | 3167 | 4.89/5.0 |
| Elias Satie | 28 | $690,930 | 769 | 4.83/5.0 |
| Oksana | 23 | $450,177 | 985 | 4.84/5.0 |
| Dmitrijs | 28 | $370,958 | 1062 | 4.80/5.0 |
| Bookinriga.Com | 39 | $361,412 | 1338 | 4.69/5.0 |
| Ieva | 8 | $336,609 | 772 | 4.95/5.0 |
| Marcis | 17 | $259,557 | 824 | 4.76/5.0 |
| Normunds | 9 | $221,688 | 232 | 4.70/5.0 |
Analyzing the strategies of top hosts, such as their property selection, pricing, and guest communication, can offer valuable lessons for optimizing your own Airbnb operations in Riga.
Dive Deeper: Advanced Riga STR Market Data (2026)
Ready to unlock more insights? AirROI provides access to advanced metrics and comprehensive Airbnb data for Riga. Explore detailed analytics beyond this report to refine your investment strategy, optimize pricing, and maximize your vacation rental profits.
Explore Advanced MetricsRiga Short-Term Rental Market Composition (2026): Property & Room Types
Room Type Distribution
Property Type Distribution
Market Composition Insights for Riga
- The Riga Airbnb market composition is heavily skewed towards Entire Home/Apt listings, which make up 93.6% of the 2,178 active rentals. This indicates strong guest preference for privacy and space.
- Looking at the property type distribution in Riga, Apartment/Condo properties are the most common (94.6%), reflecting the local real estate landscape.
- Smaller segments like hotel/boutique, house, outdoor/unique, others, unique stays (combined 5.4%) offer potential for unique stay experiences.
Riga Airbnb Room Capacity Analysis (2026): Bedroom Distribution
Distribution of Listings by Number of Bedrooms
Room Capacity Insights for Riga
- The dominant room capacity in Riga is 1 bedroom listings, making up 56.1% of the market. This suggests a strong demand for properties suitable for couples or solo travelers.
- Together, 1 bedroom and 2 bedrooms properties represent 74.1% of the active Airbnb listings in Riga, indicating a high concentration in these sizes.
- With over half the market (56.1%) consisting of studios or 1-bedroom units, Riga is particularly well-suited for individuals or couples.
- Listings with 3+ bedrooms (9.0%) represent a smaller niche, potentially indicating an underserved market for larger group accommodations in Riga.
Riga Vacation Rental Guest Capacity Trends (2026)
Distribution of Listings by Guest Capacity
Guest Capacity Insights for Riga
- The most common guest capacity trend in Riga vacation rentals is listings accommodating 2 guests (33.9%). This suggests the primary traveler segment is likely couples or solo travelers.
- Properties designed for 2 guests and 4 guests dominate the Riga STR market, accounting for 65.0% of listings.
- 17.0% of properties accommodate 6+ guests, serving the market segment for larger families or group travel in Riga.
- On average, properties in Riga are equipped to host 3.6 guests.
Riga Airbnb Booking Patterns (2026): Available vs. Booked Days
Available Days Distribution
Booked Days Distribution
Booking Pattern Insights for Riga
- The most common availability pattern in Riga falls within the 181-270 days range, representing 36.7% of listings. This suggests many properties have significant open periods on their calendars.
- Approximately 72.5% of listings show high availability (181+ days open annually), indicating potential for increased bookings or specific owner usage patterns.
- For booked days, the 91-180 days range is most frequent in Riga (36.5%), reflecting common guest stay durations or potential owner blocking patterns.
- A notable 28.8% of properties secure long booking periods (181+ days booked per year), highlighting successful long-term rental strategies or significant owner usage.
Riga Airbnb Minimum Stay Requirements Analysis
Distribution of Listings by Minimum Night Requirement
1 Night
623 listings
28.6% of total
2 Nights
507 listings
23.3% of total
3 Nights
145 listings
6.7% of total
4-6 Nights
80 listings
3.7% of total
7-29 Nights
27 listings
1.2% of total
30+ Nights
796 listings
36.5% of total
Key Insights
- The most prevalent minimum stay requirement in Riga is 30+ Nights, adopted by 36.5% of listings. This highlights the market's preference for longer commitments.
- A significant segment (36.5%) caters to monthly stays (30+ nights) in Riga, pointing to opportunities in the extended-stay market.
Recommendations
- Align with the market by considering a 30+ Nights minimum stay, as 36.5% of Riga hosts use this setting.
- If feasible, allowing 1-night stays, especially midweek or during low season, could capture last-minute bookings, as only 28.6% currently do.
- Explore offering discounts for stays of 30+ nights to attract the 36.5% of the market seeking extended stays.
- Adjust minimum nights based on seasonality – potentially shorter during low season and longer during peak demand periods in Riga.
Riga Airbnb Cancellation Policy Trends Analysis (2026)
Super Strict 30 Days
2 listings
0.1% of total
Limited
9 listings
0.4% of total
Super Strict 60 Days
8 listings
0.4% of total
Flexible
780 listings
35.8% of total
Moderate
842 listings
38.7% of total
Firm
427 listings
19.6% of total
Strict
110 listings
5.1% of total
Cancellation Policy Insights for Riga
- The prevailing Airbnb cancellation policy trend in Riga is Moderate, used by 38.7% of listings.
- The market strongly favors guest-friendly terms, with 74.5% of listings offering Flexible or Moderate policies. This suggests guests in Riga may expect booking flexibility.
- Strict cancellation policies are quite rare (5.1%), potentially making listings with this policy less competitive unless justified by high demand or property type.
Recommendations for Hosts
- Consider adopting a Moderate policy to align with the 38.7% market standard in Riga.
- Using a Strict policy might deter some guests, as only 5.1% of listings use it. Evaluate if potential revenue protection outweighs possible lower booking rates.
- Regularly review your cancellation policy against competitors and market demand shifts in Riga.
Riga STR Booking Lead Time Analysis (2026)
Average Booking Lead Time by Month
Booking Lead Time Insights for Riga
- The overall average booking lead time for vacation rentals in Riga is 41 days.
- Guests book furthest in advance for stays during August (average 55 days), likely coinciding with peak travel demand or local events.
- The shortest booking windows occur for stays in February (average 22 days), indicating more last-minute travel plans during this time.
- Seasonally, Summer (48 days avg.) sees the longest lead times, while Winter (30 days avg.) has the shortest, reflecting typical travel planning cycles.
Recommendations for Hosts
- Use the overall average lead time (41 days) as a baseline for your pricing and availability strategy in Riga.
- For August stays, consider implementing length-of-stay discounts or slightly higher rates for bookings made less than 55 days out to capitalize on advance planning.
- Target marketing efforts for the Summer season well in advance (at least 48 days) to capture early planners.
- Monitor your own booking lead times against these Riga averages to identify opportunities for dynamic pricing adjustments.
Popular & Essential Airbnb Amenities in Riga (2026)
Amenity Prevalence
Amenity Insights for Riga
- Essential amenities in Riga that guests expect include: Wifi, Kitchen. Lacking these (any) could significantly impact bookings.
- Popular amenities like Heating, Hair dryer, Hot water are common but not universal. Offering these can provide a competitive edge.
Recommendations for Hosts
- Ensure your listing includes all essential amenities for Riga: Wifi, Kitchen.
- Prioritize adding missing essentials: Wifi, Kitchen.
- Consider adding popular differentiators like Heating or Hair dryer to increase appeal.
- Highlight unique or less common amenities you offer (e.g., hot tub, dedicated workspace, EV charger) in your listing description and photos.
- Regularly check competitor amenities in Riga to stay competitive.
Riga Airbnb Guest Demographics & Profile Analysis (2026)
Guest Profile Summary for Riga
- The typical guest profile for Airbnb in Riga consists of predominantly international visitors (92%), with top international origins including Germany, typically belonging to the Post-2000s (Gen Z/Alpha) group (50%), primarily speaking English or Russian.
- Domestic travelers account for 8.0% of guests.
- Key international markets include United Kingdom (17.9%) and Germany (9.4%).
- Top languages spoken are English (40.8%) followed by Russian (9.2%).
- A significant demographic segment is the Post-2000s (Gen Z/Alpha) group, representing 50% of guests.
Recommendations for Hosts
- Focus marketing internationally, particularly towards travelers from Germany.
- Tailor amenities and listing descriptions to appeal to the dominant Post-2000s (Gen Z/Alpha) demographic (e.g., highlight fast WiFi, smart home features, local guides).
- Highlight unique local experiences or amenities relevant to the primary guest profile.
- Consider seasonal promotions aligned with peak travel times for key origin markets.
Nearby Short-Term Rental Market Comparison
How does the Riga Airbnb market stack up against its neighbors? Compare key performance metrics like average monthly revenue, ADR, and occupancy rates in surrounding areas to understand the broader regional STR landscape.
| Market | Active Properties | Monthly Revenue | Daily Rate | Avg. Occupancy |
|---|---|---|---|---|
| Salas pagasts | 12 | $1,796 | $153.49 | 41% |
| Vārzas | 11 | $1,793 | $146.74 | 42% |
| Līgatnes pagasts | 12 | $1,617 | $303.62 | 33% |
| Krimuldas pagasts | 15 | $1,317 | $218.71 | 27% |
| Drabešu pagasts | 31 | $1,237 | $175.64 | 28% |
| Tīnūžu pagasts | 14 | $1,177 | $133.56 | 32% |
| Garkalnes pagasts | 10 | $1,105 | $143.47 | 35% |
| Mārupes pagasts | 13 | $1,023 | $144.88 | 29% |
| Mērsraga pagasts | 14 | $1,005 | $134.96 | 36% |
| Engures pagasts | 75 | $903 | $122.12 | 32% |