Tsukuba Airbnb Market Analysis 2025: Short Term Rental Data & Vacation Rental Statistics in Ibaraki Prefecture, Japan
Is Airbnb profitable in Tsukuba in 2025? Explore comprehensive Airbnb analytics for Tsukuba, Ibaraki Prefecture, Japan to uncover income potential. This 2025 STR market report for Tsukuba, based on AirROI data from April 2024 to March 2025, reveals key trends in the niche market of 17 active listings.
Whether you're considering an Airbnb investment in Tsukuba, optimizing your existing vacation rental, or exploring rental arbitrage opportunities, understanding the Tsukuba Airbnb data is crucial. Navigating the high regulation landscape is key to maximizing your short term rental income potential. Let's dive into the specifics.
Key Tsukuba Airbnb Performance Metrics Overview
Monthly Airbnb Revenue Variations & Income Potential in Tsukuba (2025)
Understanding the monthly revenue variations for Airbnb listings in Tsukuba is key to maximizing your short term rental income potential. Seasonality significantly impacts earnings. Our analysis, based on data from the past 12 months, shows that the peak revenue month for STRs in Tsukuba is typically August, while October often presents the lowest earnings, highlighting opportunities for strategic pricing adjustments during shoulder and low seasons. Explore the typical Airbnb income in Tsukuba across different performance tiers:
- Best-in-class properties (Top 10%) achieve $4,188+ monthly, often utilizing dynamic pricing and superior guest experiences.
- Strong performing properties (Top 25%) earn $951 or more, indicating effective management and desirable locations/amenities.
- Typical properties (Median) generate around $595 per month, representing the average market performance.
- Entry-level properties (Bottom 25%) see earnings around $302, often with potential for optimization.
Average Monthly Airbnb Earnings Trend in Tsukuba
Tsukuba Airbnb Occupancy Rate Trends (2025)
Maximize your bookings by understanding the Tsukuba STR occupancy trends. Seasonal demand shifts significantly influence how often properties are booked. Typically, Augustsees the highest demand (peak season occupancy), while October experiences the lowest (low season). Effective strategies, like adjusting minimum stays or offering promotions, can boost occupancy during slower periods. Here's how different property tiers perform in Tsukuba:
- Best-in-class properties (Top 10%) achieve 78%+ occupancy, indicating high desirability and potentially optimized availability.
- Strong performing properties (Top 25%) maintain 61% or higher occupancy, suggesting good market fit and guest satisfaction.
- Typical properties (Median) have an occupancy rate around 40%.
- Entry-level properties (Bottom 25%) average 21% occupancy, potentially facing higher vacancy.
Average Monthly Occupancy Rate Trend in Tsukuba
Average Daily Rate (ADR) Airbnb Trends in Tsukuba (2025)
Effective short term rental pricing strategy in Tsukuba involves understanding monthly ADR fluctuations. The Average Daily Rate (ADR) for Airbnb in Tsukuba typically peaks in January and dips lowest during September. Leveraging Airbnb dynamic pricing tools or strategies based on this seasonality can significantly boost revenue. Here's a look at the typical nightly rates achieved:
- Best-in-class properties (Top 10%) command rates of $237+ per night, often due to premium features or locations.
- Strong performing properties (Top 25%) achieve nightly rates of $59 or more.
- Typical properties (Median) charge around $38 per night.
- Entry-level properties (Bottom 25%) earn around $33 per night.
Average Daily Rate (ADR) Trend by Month in Tsukuba
Get Live Tsukuba Market Intelligence 👇

Explore Real-time Analytics
Airbnb Seasonality Analysis & Trends in Tsukuba (2025)
Peak Season (August, April, May)
- Revenue averages $1,748 per month
- Occupancy rates average 44.2%
- Daily rates average $69
Shoulder Season
- Revenue averages $1,318 per month
- Occupancy maintains around 44.6%
- Daily rates hold near $72
Low Season (March, October, December)
- Revenue drops to average $885 per month
- Occupancy decreases to average 34.6%
- Daily rates adjust to average $73
Seasonality Insights for Tsukuba
- The Airbnb seasonality in Tsukuba shows highly seasonal trends requiring careful strategy. While the sections above show seasonal averages, it's also insightful to look at the extremes:
- During the high season, the absolute peak month showcases Tsukuba's highest earning potential, with monthly revenues capable of climbing to $1,844, occupancy reaching a high of 54.4%, and ADRs peaking at $75.
- Conversely, the slowest single month of the year, typically falling within the low season, marks the market's lowest point. In this month, revenue might dip to $804, occupancy could drop to 29.3%, and ADRs may adjust down to $69.
- Understanding both the seasonal averages and these monthly peaks and troughs in revenue, occupancy, and ADR is crucial for maximizing your Airbnb profit potential in Tsukuba.
Seasonal Strategies for Maximizing Profit
- Peak Season: Maximize revenue through premium pricing and potentially longer minimum stays. Ensure high availability.
- Low Season: Offer competitive pricing, special promotions (e.g., extended stay discounts), and flexible cancellation policies. Target off-season travelers like remote workers or budget-conscious guests.
- Shoulder Seasons: Implement dynamic pricing that balances peak and low rates. Target weekend travelers or specific events. Offer slightly more flexible terms than peak season.
- Regularly analyze your own performance against these Tsukuba seasonality benchmarks and adjust your pricing and availability strategy accordingly.
Best Areas for Airbnb Investment in Tsukuba (2025)
Exploring the top neighborhoods for short-term rentals in Tsukuba? This section highlights key areas, outlining why they are attractive for hosts and guests, along with notable local attractions. Consider these locations based on your target guest profile and investment strategy.
| Neighborhood / Area | Why Host Here? (Target Guests & Appeal) | Key Attractions & Landmarks |
|---|---|---|
| Tsukuba Science City | A hub of scientific research and technology with many universities and institutes. Ideal for guests visiting for conferences and educational purposes. | Tsukuba Space Center, National Museum of Nature and Science, Tsukuba Expo '85 Memorial Park, Akiyama Park, Tsukuba Botanical Garden |
| Odaiba Park | A beautiful park area great for picnics and family outings, with views of the waterfront and nearby attractions. Perfect for families and leisure travelers. | Odaiba Seaside Park, DiverCity Tokyo Plaza, Miraikan, Palette Town, VenusFort |
| Tsukuba Expo Memorial Park | A large park with historical significance and various recreational activities. Popular among locals and visitors alike for outdoor events. | Tsukuba Expo Memorial Center, Japanese Garden, Open-air museum, Cycling paths, Cherry blossom viewing places |
| Tsukuba Center Area | The central area of Tsukuba with shopping, dining, and entertainment. Offers convenience for travelers looking to explore the city and its amenities. | Tsukuba Center Shopping Mall, Tsukuba Culture and Sports Center, Tsukuba Community Theatre |
| University of Tsukuba Grounds | Home to one of Japan's leading universities. Attracts students and faculty, making it a good location for short-term stays. | University of Tsukuba Art Gallery, University Library, Sports facilities |
| Mount Tsukuba | A popular hiking destination known for its natural beauty and panoramic views. Attracts outdoor enthusiasts and nature lovers. | Mount Tsukuba Hiking Trail, Tsukubasan Shrine, Tsukuba Observatory, Shinrin Park |
| Tsuchiura River Walk | A scenic walk along the river, popular for jogging and leisurely strolls. Ideal for guests looking for outdoor activities. | Tsuchiura River, Cycle paths, Nature observation spots |
| Tsukuba Botanical Garden | A beautiful and tranquil botanical garden showcasing a variety of plants. Great for tourists looking for peaceful surroundings and educational experiences. | Japanese garden exhibit, Tropical plant house, Seasonal flower displays |
Understanding Airbnb License Requirements & STR Laws in Tsukuba (2025)
Yes, Tsukuba, Ibaraki Prefecture, Japan enforces high STR regulations. Obtaining a license and ensuring compliance is almost certainly required according to current 2025 STR laws. Always verify the latest short term rental regulations and Airbnb license requirements directly with local government authorities for Tsukuba to ensure full compliance before hosting.
(Source: AirROI data, 2025, based on 76% licensed listings)
Top Performing Airbnb Properties in Tsukuba (2025)
Benchmark your potential! Explore examples of top-performing Airbnb properties in Tsukubabased on Trailing Twelve Month (TTM) revenue. Analyze their characteristics, revenue, occupancy rate, and ADR to understand what drives success in this market.
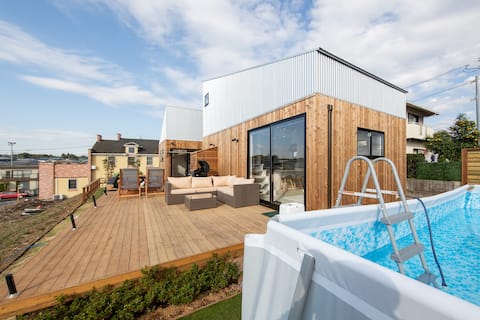
Tiny house with private sauna and Mirabus
Entire Place • 1 bedroom

Entire home "Antique Villa" (1 hour hideaway from the city center)
Entire Place • 3 bedrooms

Tsukuba Garden Single House.Enjoy the whole building. No361 *.Tech or family trip is the best
Entire Place • 4 bedrooms
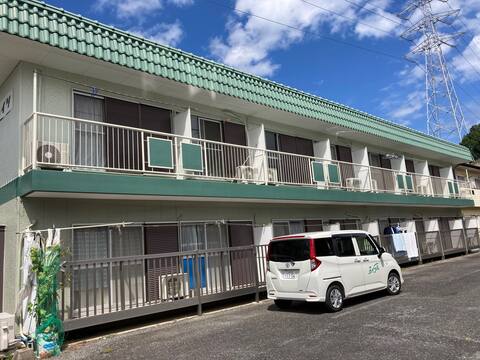
Free parking on premises, fully equipped with cooking utensils, 6 minutes from Tsukuba Station by Ts
Private Room • N/A
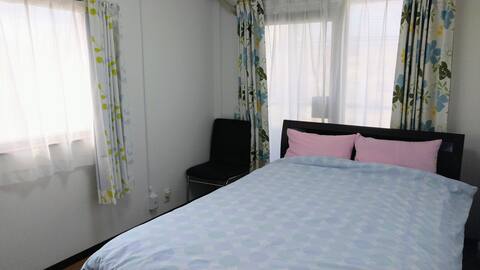
Open!無料WIFI リフォーム済みのお部屋
Entire Place • 1 bedroom

stand_tsukuba
Private Room • N/A
Note: Performance varies based on location, size, amenities, seasonality, and management quality. Data reflects the past 12 months.
Top Performing Airbnb Hosts in Tsukuba (2025)
Learn from the best! This table showcases top-performing Airbnb hosts in Tsukuba based on the number of properties managed and estimated total revenue over the past year. Analyze their scale and performance metrics.
| Host Name | Properties | Grossing Revenue | Stay Reviews | Avg Rating |
|---|---|---|---|---|
| 武正 | 1 | $56,174 | 363 | 4.83/5.0 |
| 杉山 | 1 | $47,925 | 23 | 4.83/5.0 |
| Qiao | 1 | $46,217 | 12 | 4.75/5.0 |
| 春日ハウス Kasuga House | 5 | $19,914 | 143 | 4.79/5.0 |
| 中山鈴子 | 4 | $15,379 | 94 | 4.66/5.0 |
| Host #154383684 | 2 | $9,762 | 163 | 4.75/5.0 |
| 学 | 1 | $9,428 | 65 | 4.88/5.0 |
| Machiko | 1 | $6,840 | 109 | 4.95/5.0 |
| 旧小林邸 | 1 | $1,124 | 52 | 4.88/5.0 |
Analyzing the strategies of top hosts, such as their property selection, pricing, and guest communication, can offer valuable lessons for optimizing your own Airbnb operations in Tsukuba.
Dive Deeper: Advanced Tsukuba STR Market Data (2025)
Ready to unlock more insights? AirROI provides access to advanced metrics and comprehensive Airbnb data for Tsukuba. Explore detailed analytics beyond this report to refine your investment strategy, optimize pricing, and maximize your vacation rental profits.
Explore Advanced MetricsTsukuba Short-Term Rental Market Composition (2025): Property & Room Types
Room Type Distribution
Property Type Distribution
Market Composition Insights for Tsukuba
- The Tsukuba Airbnb market composition is heavily skewed towards Private Room listings, which make up 70.6% of the 17 active rentals. This indicates strong guest preference for privacy and space.
- Looking at the property type distribution in Tsukuba, Apartment/Condo properties are the most common (47.1%), reflecting the local real estate landscape.
- Houses represent a significant 47.1% portion, catering likely to families or larger groups.
Tsukuba Airbnb Room Capacity Analysis (2025): Bedroom Distribution
Distribution of Listings by Number of Bedrooms
Room Capacity Insights for Tsukuba
- The dominant room capacity in Tsukuba is 1 bedroom listings, making up 47.1% of the market. This suggests a strong demand for properties suitable for couples or solo travelers.
- Together, 1 bedroom and 3 bedrooms properties represent 58.9% of the active Airbnb listings in Tsukuba, indicating a high concentration in these sizes.
Tsukuba Vacation Rental Guest Capacity Trends (2025)
Distribution of Listings by Guest Capacity
Guest Capacity Insights for Tsukuba
- The most common guest capacity trend in Tsukuba vacation rentals is listings accommodating 2 guests (17.6%). This suggests the primary traveler segment is likely couples or solo travelers.
- Properties designed for 2 guests and 8+ guests dominate the Tsukuba STR market, accounting for 29.4% of listings.
- 11.8% of properties accommodate 6+ guests, serving the market segment for larger families or group travel in Tsukuba.
- On average, properties in Tsukuba are equipped to host 2.2 guests.
Tsukuba Airbnb Booking Patterns (2025): Available vs. Booked Days
Available Days Distribution
Booked Days Distribution
Booking Pattern Insights for Tsukuba
- The most common availability pattern in Tsukuba falls within the 181-270 days range, representing 41.2% of listings. This suggests many properties have significant open periods on their calendars.
- Approximately 70.6% of listings show high availability (181+ days open annually), indicating potential for increased bookings or specific owner usage patterns.
- For booked days, the 91-180 days range is most frequent in Tsukuba (41.2%), reflecting common guest stay durations or potential owner blocking patterns.
- A notable 29.4% of properties secure long booking periods (181+ days booked per year), highlighting successful long-term rental strategies or significant owner usage.
Tsukuba Airbnb Minimum Stay Requirements Analysis
Distribution of Listings by Minimum Night Requirement
1 Night
15 listings
88.2% of total
2 Nights
2 listings
11.8% of total
Key Insights
- The most prevalent minimum stay requirement in Tsukuba is 1 Night, adopted by 88.2% of listings. This highlights the market's preference for shorter, flexible bookings.
- A strong majority (100.0%) of the Tsukuba Airbnb data shows acceptance of very short stays (1-2 nights), indicating a dynamic, high-turnover market.
Recommendations
- Align with the market by considering a 1 Night minimum stay, as 88.2% of Tsukuba hosts use this setting.
- Adjust minimum nights based on seasonality – potentially shorter during low season and longer during peak demand periods in Tsukuba.
Tsukuba Airbnb Cancellation Policy Trends Analysis (2025)
Flexible
1 listings
7.1% of total
Moderate
11 listings
78.6% of total
Strict
2 listings
14.3% of total
Cancellation Policy Insights for Tsukuba
- The prevailing Airbnb cancellation policy trend in Tsukuba is Moderate, used by 78.6% of listings.
- The market strongly favors guest-friendly terms, with 85.7% of listings offering Flexible or Moderate policies. This suggests guests in Tsukuba may expect booking flexibility.
Recommendations for Hosts
- Consider adopting a Moderate policy to align with the 78.6% market standard in Tsukuba.
- Using a Strict policy might deter some guests, as only 14.3% of listings use it. Evaluate if potential revenue protection outweighs possible lower booking rates.
- Regularly review your cancellation policy against competitors and market demand shifts in Tsukuba.
Tsukuba STR Booking Lead Time Analysis (2025)
Average Booking Lead Time by Month
Booking Lead Time Insights for Tsukuba
- The overall average booking lead time for vacation rentals in Tsukuba is 47 days.
- Guests book furthest in advance for stays during June (average 90 days), likely coinciding with peak travel demand or local events.
- The shortest booking windows occur for stays in January (average 20 days), indicating more last-minute travel plans during this time.
- Seasonally, Summer (84 days avg.) sees the longest lead times, while Winter (25 days avg.) has the shortest, reflecting typical travel planning cycles.
Recommendations for Hosts
- Use the overall average lead time (47 days) as a baseline for your pricing and availability strategy in Tsukuba.
- For June stays, consider implementing length-of-stay discounts or slightly higher rates for bookings made less than 90 days out to capitalize on advance planning.
- Target marketing efforts for the Summer season well in advance (at least 84 days) to capture early planners.
- Monitor your own booking lead times against these Tsukuba averages to identify opportunities for dynamic pricing adjustments.
Popular & Essential Airbnb Amenities in Tsukuba (2025)
Amenity Prevalence
Amenity Insights for Tsukuba
- Essential amenities in Tsukuba that guests expect include: Bed linens, Hangers, Shampoo, Hot water, Washer, Refrigerator, Smoke alarm. Lacking these (any) could significantly impact bookings.
- Popular amenities like Kitchen, Bathtub, Free parking on premises are common but not universal. Offering these can provide a competitive edge.
Recommendations for Hosts
- Ensure your listing includes all essential amenities for Tsukuba: Bed linens, Hangers, Shampoo, Hot water, Washer, Refrigerator, Smoke alarm.
- Consider adding popular differentiators like Kitchen or Bathtub to increase appeal.
- Highlight unique or less common amenities you offer (e.g., hot tub, dedicated workspace, EV charger) in your listing description and photos.
- Regularly check competitor amenities in Tsukuba to stay competitive.
Tsukuba Airbnb Guest Demographics & Profile Analysis (2025)
Guest Profile Summary for Tsukuba
- The typical guest profile for Airbnb in Tsukuba consists of a mix of domestic (59%) and international guests, often arriving from nearby Tsukuba, typically belonging to the Post-2000s (Gen Z/Alpha) group (50%), primarily speaking English or Japanese.
- Domestic travelers account for 59.0% of guests.
- Key international markets include Japan (59%) and France (6.7%).
- Top languages spoken are English (34.6%) followed by Japanese (34.6%).
- A significant demographic segment is the Post-2000s (Gen Z/Alpha) group, representing 50% of guests.
Recommendations for Hosts
- Balance marketing efforts between domestic and international channels based on the guest mix.
- Tailor amenities and listing descriptions to appeal to the dominant Post-2000s (Gen Z/Alpha) demographic (e.g., highlight fast WiFi, smart home features, local guides).
- Highlight unique local experiences or amenities relevant to the primary guest profile.
- Consider seasonal promotions aligned with peak travel times for key origin markets.
Nearby Short-Term Rental Market Comparison
How does the Tsukuba Airbnb market stack up against its neighbors? Compare key performance metrics like average monthly revenue, ADR, and occupancy rates in surrounding areas to understand the broader regional STR landscape.
| Market | Active Properties | Monthly Revenue | Daily Rate | Avg. Occupancy |
|---|---|---|---|---|
| Hakone | 269 | $4,754 | $284.79 | 54% |
| Kamogawa | 28 | $4,315 | $315.54 | 40% |
| Atami | 131 | $4,016 | $321.77 | 40% |
| Miura | 17 | $3,954 | $432.64 | 39% |
| Hokota | 15 | $3,676 | $240.16 | 49% |
| Ichinomiya | 89 | $3,556 | $248.53 | 37% |
| Nasu | 118 | $3,326 | $325.46 | 39% |
| Katsuura | 22 | $3,307 | $251.64 | 37% |
| Kashima | 20 | $3,170 | $210.43 | 38% |
| Futtsu | 21 | $4,765 | $425.29 | 35% |