West End Airbnb Market Analysis 2026: Short Term Rental Data & Vacation Rental Statistics in Westmoreland, Jamaica
Is Airbnb profitable in West End in 2026? Explore comprehensive Airbnb analytics for West End, Westmoreland, Jamaica to uncover income potential. This 2026 STR market report for West End, based on AirROI data from February 2025 to January 2026, reveals key trends in the niche market of 21 active listings.
Whether you're considering an Airbnb investment in West End, optimizing your existing vacation rental, or exploring rental arbitrage opportunities, understanding the West End Airbnb data is crucial. Leveraging the low regulation environment is key to maximizing your short term rental income potential. Let's dive into the specifics.
Key West End Airbnb Performance Metrics Overview
Monthly Airbnb Revenue Variations & Income Potential in West End (2026)
Understanding the monthly revenue variations for Airbnb listings in West End is key to maximizing your short term rental income potential. Seasonality significantly impacts earnings. Our analysis, based on data from the past 12 months, shows that the peak revenue month for STRs in West End is typically February, while November often presents the lowest earnings, highlighting opportunities for strategic pricing adjustments during shoulder and low seasons. Explore the typical Airbnb income in West End across different performance tiers:
- Best-in-class properties (Top 10%) achieve $6,388+ monthly, often utilizing dynamic pricing and superior guest experiences.
- Strong performing properties (Top 25%) earn $2,100 or more, indicating effective management and desirable locations/amenities.
- Typical properties (Median) generate around $847 per month, representing the average market performance.
- Entry-level properties (Bottom 25%) see earnings around $379, often with potential for optimization.
Average Monthly Airbnb Earnings Trend in West End
West End Airbnb Occupancy Rate Trends (2026)
Maximize your bookings by understanding the West End STR occupancy trends. Seasonal demand shifts significantly influence how often properties are booked. Typically, Februarysees the highest demand (peak season occupancy), while June experiences the lowest (low season). Effective strategies, like adjusting minimum stays or offering promotions, can boost occupancy during slower periods. Here's how different property tiers perform in West End:
- Best-in-class properties (Top 10%) achieve 58%+ occupancy, indicating high desirability and potentially optimized availability.
- Strong performing properties (Top 25%) maintain 39% or higher occupancy, suggesting good market fit and guest satisfaction.
- Typical properties (Median) have an occupancy rate around 23%.
- Entry-level properties (Bottom 25%) average 11% occupancy, potentially facing higher vacancy.
Average Monthly Occupancy Rate Trend in West End
Average Daily Rate (ADR) Airbnb Trends in West End (2026)
Effective short term rental pricing strategy in West End involves understanding monthly ADR fluctuations. The Average Daily Rate (ADR) for Airbnb in West End typically peaks in December and dips lowest during August. Leveraging Airbnb dynamic pricing tools or strategies based on this seasonality can significantly boost revenue. Here's a look at the typical nightly rates achieved:
- Best-in-class properties (Top 10%) command rates of $359+ per night, often due to premium features or locations.
- Strong performing properties (Top 25%) achieve nightly rates of $117 or more.
- Typical properties (Median) charge around $81 per night.
- Entry-level properties (Bottom 25%) earn around $55 per night.
Average Daily Rate (ADR) Trend by Month in West End
Get Live West End Market Intelligence 👇

Explore Real-time Analytics
Airbnb Seasonality Analysis & Trends in West End (2026)
Peak Season (February, September, March)
- Revenue averages $3,112 per month
- Occupancy rates average 41.6%
- Daily rates average $149
Shoulder Season
- Revenue averages $1,797 per month
- Occupancy maintains around 24.8%
- Daily rates hold near $147
Low Season (August, November, December)
- Revenue drops to average $1,469 per month
- Occupancy decreases to average 21.1%
- Daily rates adjust to average $148
Seasonality Insights for West End
- The Airbnb seasonality in West End shows highly seasonal trends requiring careful strategy. While the sections above show seasonal averages, it's also insightful to look at the extremes:
- During the high season, the absolute peak month showcases West End's highest earning potential, with monthly revenues capable of climbing to $3,546, occupancy reaching a high of 56.9%, and ADRs peaking at $153.
- Conversely, the slowest single month of the year, typically falling within the low season, marks the market's lowest point. In this month, revenue might dip to $1,366, occupancy could drop to 14.3%, and ADRs may adjust down to $141.
- Understanding both the seasonal averages and these monthly peaks and troughs in revenue, occupancy, and ADR is crucial for maximizing your Airbnb profit potential in West End.
Seasonal Strategies for Maximizing Profit
- Peak Season: Maximize revenue through premium pricing and potentially longer minimum stays. Ensure high availability.
- Low Season: Offer competitive pricing, special promotions (e.g., extended stay discounts), and flexible cancellation policies. Target off-season travelers like remote workers or budget-conscious guests.
- Shoulder Seasons: Implement dynamic pricing that balances peak and low rates. Target weekend travelers or specific events. Offer slightly more flexible terms than peak season.
- Regularly analyze your own performance against these West End seasonality benchmarks and adjust your pricing and availability strategy accordingly.
Best Areas for Airbnb Investment in West End (2026)
Exploring the top neighborhoods for short-term rentals in West End? This section highlights key areas, outlining why they are attractive for hosts and guests, along with notable local attractions. Consider these locations based on your target guest profile and investment strategy.
| Neighborhood / Area | Why Host Here? (Target Guests & Appeal) | Key Attractions & Landmarks |
|---|---|---|
| Negril | Known for its stunning Seven Mile Beach and vibrant nightlife, Negril is a popular destination for tourists seeking relaxation and entertainment. The area's laid-back vibe attracts a diverse crowd looking for both adventure and leisure. | Seven Mile Beach, Negril Cliffs, Rick's Cafe, The Booby Cay, Kensington Great House |
| Montego Bay | A bustling resort town with beautiful beaches and a lively atmosphere, Montego Bay is ideal for investors looking for a destination with a rich mix of culture, shopping, and beachfront activities. | Doctor's Cave Beach, Rose Hall Great House, Hip Strip, Martha Brae River, Montego Bay Marine Park |
| Ocho Rios | Home to stunning waterfalls and lush landscapes, Ocho Rios is a tourist hotspot that offers access to natural attractions, making it appealing for those looking to attract nature lovers and adventure seekers. | Dunn's River Falls, Mystic Mountain, Ocho Rios Beach, Dolphin Cove, Island Gully Falls |
| Port Antonio | A serene and less commercialized area known for its natural beauty, Port Antonio attracts tourists looking for an organic Jamaican experience with beautiful beaches and lush scenery. | Frenchman's Cove, Blue Lagoon, Rafting on the Rio Grande, Port Antonio Marina, Winnifred Beach |
| Treasure Beach | This peaceful fishing village provides a tranquil getaway with its unspoiled beaches and local charm. It's ideal for sustainable tourism and attracting eco-conscious travelers. | Treasure Beach, Pelican Bar, Billy's Bay, Great Pedro Bay, Frenchman's Bay |
| Lucea | Lucea is an up-and-coming area known for its historic charm and proximity to beautiful beaches. It's ideal for those looking for a less crowded option with potential growth. | Half Moon Beach, Heard's Pond, Lucea Fort, Local markets, Beautiful coastal views |
| Runaway Bay | A family-friendly destination with beautiful beaches and abundant excursions, Runaway Bay is great for hosting families and groups looking for relaxation and adventure. | Runaway Bay Beach, Green Grotto Caves, Flavours Beach, Four Rivers Eco-park, Bamboo Beach Club |
| Falmouth | Rich in culture and history, Falmouth is a vibrant port town that attracts cruise ship visitors. Its charming Georgian architecture and local markets offer a unique experience for tourists. | Historic Falmouth, Falmouth Cruise Port, Glistening Waters, Burwood Beach, Royal Caribbean's Falmouth Port |
Understanding Airbnb License Requirements & STR Laws in West End (2026)
While West End, Westmoreland, Jamaica currently shows low STR regulations, specific Airbnb license requirements might still exist or change. Always verify the latest short term rental regulations and Airbnb license requirements directly with local government authorities for West End to ensure full compliance before hosting.
(Source: AirROI data, 2026, finding no licensed listings among those analyzed)
Top Performing Airbnb Properties in West End (2026)
Benchmark your potential! Explore examples of top-performing Airbnb properties in West Endbased on Trailing Twelve Month (TTM) revenue. Analyze their characteristics, revenue, occupancy rate, and ADR to understand what drives success in this market.
Amazing OceanFront Cabin, Negril, perfect 4 groups
Entire Place • 5 bedrooms
Lovely 9 Br Cottage in Negril
Entire Place • 9 bedrooms

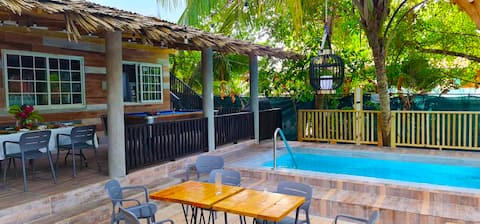
Gorgeous 4Br Apt with Pool & BBQ
Entire Place • 4 bedrooms
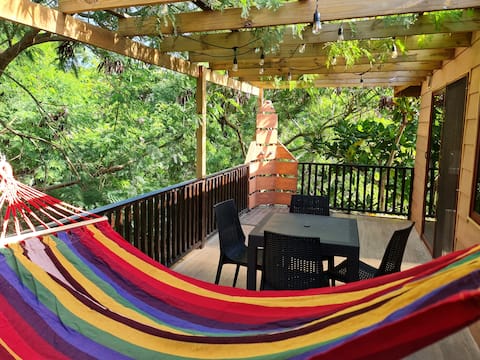
Ocean View 2 Br in Trees on the Cliffs, fast WIFI
Entire Place • 3 bedrooms
Cozy 1Br Negril Cabin with breathtaking Ocean View
Entire Place • 1 bedroom

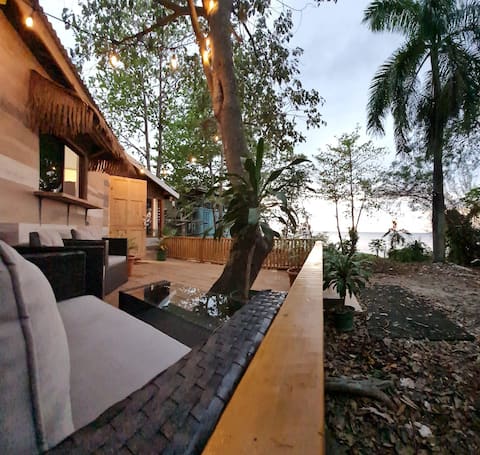
11 mins > 7 Mile Beach•Dolphins+Sunsets•Pool+Deck
Entire Place • 1 bedroom
Note: Performance varies based on location, size, amenities, seasonality, and management quality. Data reflects the past 12 months.
Top Performing Airbnb Hosts in West End (2026)
Learn from the best! This table showcases top-performing Airbnb hosts in West End based on the number of properties managed and estimated total revenue over the past year. Analyze their scale and performance metrics.
| Host Name | Properties | Grossing Revenue | Stay Reviews | Avg Rating |
|---|---|---|---|---|
| Carey | 6 | $248,990 | 231 | 4.79/5.0 |
| Janet | 3 | $23,887 | 122 | 4.64/5.0 |
| Elias | 1 | $10,634 | 1 | Not Rated |
| Yvonne | 1 | $7,128 | 3 | 4.33/5.0 |
| Georgia Ann’s | 2 | $6,143 | 15 | 4.93/5.0 |
| Claudia | 1 | $4,686 | 9 | 4.78/5.0 |
| Angela | 1 | $4,313 | 26 | 4.38/5.0 |
| Khimaja | 1 | $4,296 | 57 | 4.51/5.0 |
| John | 1 | $2,265 | 3 | 4.67/5.0 |
| Penny W/ Manager Rasta Freddy | 1 | $1,893 | 28 | 4.79/5.0 |
Analyzing the strategies of top hosts, such as their property selection, pricing, and guest communication, can offer valuable lessons for optimizing your own Airbnb operations in West End.
Dive Deeper: Advanced West End STR Market Data (2026)
Ready to unlock more insights? AirROI provides access to advanced metrics and comprehensive Airbnb data for West End. Explore detailed analytics beyond this report to refine your investment strategy, optimize pricing, and maximize your vacation rental profits.
Explore Advanced MetricsWest End Short-Term Rental Market Composition (2026): Property & Room Types
Room Type Distribution
Property Type Distribution
Market Composition Insights for West End
- The West End Airbnb market composition is heavily skewed towards Entire Home/Apt listings, which make up 66.7% of the 21 active rentals. This indicates strong guest preference for privacy and space.
- However, a notable 33.3% share for Private Rooms suggests opportunities for budget-conscious travelers or hosts renting out spare rooms.
- Looking at the property type distribution in West End, Apartment/Condo properties are the most common (33.3%), reflecting the local real estate landscape.
- Houses represent a significant 28.6% portion, catering likely to families or larger groups.
- The presence of 19% Hotel/Boutique listings indicates integration with traditional hospitality.
- Smaller segments like others (combined 4.8%) offer potential for unique stay experiences.
West End Airbnb Room Capacity Analysis (2026): Bedroom Distribution
Distribution of Listings by Number of Bedrooms
Room Capacity Insights for West End
- The dominant room capacity in West End is 1 bedroom listings, making up 47.6% of the market. This suggests a strong demand for properties suitable for couples or solo travelers.
- Together, 1 bedroom and 5+ bedrooms properties represent 57.1% of the active Airbnb listings in West End, indicating a high concentration in these sizes.
West End Vacation Rental Guest Capacity Trends (2026)
Distribution of Listings by Guest Capacity
Guest Capacity Insights for West End
- The most common guest capacity trend in West End vacation rentals is listings accommodating 2 guests (47.6%). This suggests the primary traveler segment is likely couples or solo travelers.
- Properties designed for 2 guests and 8+ guests dominate the West End STR market, accounting for 66.6% of listings.
- A significant 47.6% of listings cater specifically to 1-2 guests, highlighting strong demand from couples and solo travelers in West End.
- 23.8% of properties accommodate 6+ guests, serving the market segment for larger families or group travel in West End.
- On average, properties in West End are equipped to host 3.1 guests.
West End Airbnb Booking Patterns (2026): Available vs. Booked Days
Available Days Distribution
Booked Days Distribution
Booking Pattern Insights for West End
- The most common availability pattern in West End falls within the 271-366 days range, representing 76.2% of listings. This suggests many properties have significant open periods on their calendars.
- Approximately 100.0% of listings show high availability (181+ days open annually), indicating potential for increased bookings or specific owner usage patterns.
- For booked days, the 31-90 days range is most frequent in West End (52.4%), reflecting common guest stay durations or potential owner blocking patterns.
West End Airbnb Minimum Stay Requirements Analysis
Distribution of Listings by Minimum Night Requirement
1 Night
11 listings
52.4% of total
2 Nights
5 listings
23.8% of total
3 Nights
1 listings
4.8% of total
4-6 Nights
1 listings
4.8% of total
30+ Nights
3 listings
14.3% of total
Key Insights
- The most prevalent minimum stay requirement in West End is 1 Night, adopted by 52.4% of listings. This highlights the market's preference for shorter, flexible bookings.
- A strong majority (76.2%) of the West End Airbnb data shows acceptance of very short stays (1-2 nights), indicating a dynamic, high-turnover market.
- A significant segment (14.3%) caters to monthly stays (30+ nights) in West End, pointing to opportunities in the extended-stay market.
Recommendations
- Align with the market by considering a 1 Night minimum stay, as 52.4% of West End hosts use this setting.
- Explore offering discounts for stays of 30+ nights to attract the 14.3% of the market seeking extended stays.
- Adjust minimum nights based on seasonality – potentially shorter during low season and longer during peak demand periods in West End.
West End Airbnb Cancellation Policy Trends Analysis (2026)
Flexible
8 listings
38.1% of total
Moderate
10 listings
47.6% of total
Firm
3 listings
14.3% of total
Cancellation Policy Insights for West End
- The prevailing Airbnb cancellation policy trend in West End is Moderate, used by 47.6% of listings.
- The market strongly favors guest-friendly terms, with 85.7% of listings offering Flexible or Moderate policies. This suggests guests in West End may expect booking flexibility.
Recommendations for Hosts
- Consider adopting a Moderate policy to align with the 47.6% market standard in West End.
- Regularly review your cancellation policy against competitors and market demand shifts in West End.
West End STR Booking Lead Time Analysis (2026)
Average Booking Lead Time by Month
Booking Lead Time Insights for West End
- The overall average booking lead time for vacation rentals in West End is 52 days.
- Guests book furthest in advance for stays during December (average 73 days), likely coinciding with peak travel demand or local events.
- The shortest booking windows occur for stays in September (average 26 days), indicating more last-minute travel plans during this time.
- Seasonally, Winter (68 days avg.) sees the longest lead times, while Fall (29 days avg.) has the shortest, reflecting typical travel planning cycles.
Recommendations for Hosts
- Use the overall average lead time (52 days) as a baseline for your pricing and availability strategy in West End.
- For December stays, consider implementing length-of-stay discounts or slightly higher rates for bookings made less than 73 days out to capitalize on advance planning.
- Target marketing efforts for the Winter season well in advance (at least 68 days) to capture early planners.
- Monitor your own booking lead times against these West End averages to identify opportunities for dynamic pricing adjustments.
Popular & Essential Airbnb Amenities in West End (2026)
Amenity Prevalence
Amenity Insights for West End
- Popular amenities like Free parking on premises, TV, Patio or balcony are common but not universal. Offering these can provide a competitive edge.
- Warning: Wifi is not universally provided but is considered essential globally. Ensure reliable Wifi is offered.
Recommendations for Hosts
- Consider adding popular differentiators like Free parking on premises or TV to increase appeal.
- Highlight unique or less common amenities you offer (e.g., hot tub, dedicated workspace, EV charger) in your listing description and photos.
- Regularly check competitor amenities in West End to stay competitive.
West End Airbnb Guest Demographics & Profile Analysis (2026)
Guest Profile Summary for West End
- The typical guest profile for Airbnb in West End consists of predominantly international visitors (85%), with top international origins including Canada, typically belonging to the Post-2000s (Gen Z/Alpha) group (50%), primarily speaking English or Spanish.
- Domestic travelers account for 15.2% of guests.
- Key international markets include United States (48.5%) and Canada (16.7%).
- Top languages spoken are English (53.3%) followed by Spanish (18.3%).
- A significant demographic segment is the Post-2000s (Gen Z/Alpha) group, representing 50% of guests.
Recommendations for Hosts
- Focus marketing internationally, particularly towards travelers from Canada.
- Tailor amenities and listing descriptions to appeal to the dominant Post-2000s (Gen Z/Alpha) demographic (e.g., highlight fast WiFi, smart home features, local guides).
- Highlight unique local experiences or amenities relevant to the primary guest profile.
- Consider seasonal promotions aligned with peak travel times for key origin markets.
Nearby Short-Term Rental Market Comparison
How does the West End Airbnb market stack up against its neighbors? Compare key performance metrics like average monthly revenue, ADR, and occupancy rates in surrounding areas to understand the broader regional STR landscape.
| Market | Active Properties | Monthly Revenue | Daily Rate | Avg. Occupancy |
|---|---|---|---|---|
| Barrett Town | 12 | $5,328 | $312.58 | 52% |
| Unity Hall | 23 | $3,160 | $381.74 | 30% |
| Mount Zion | 31 | $3,102 | $507.23 | 33% |
| Duncans | 27 | $2,770 | $476.01 | 29% |
| Davis Cove | 15 | $2,279 | $311.23 | 24% |
| Bruces Hill | 13 | $2,165 | $857.82 | 22% |
| St. James Parish | 60 | $2,161 | $406.48 | 30% |
| Reading | 56 | $1,944 | $209.41 | 39% |
| Culloden | 13 | $1,907 | $405.25 | 30% |
| Trelawny Parish | 10 | $1,854 | $241.94 | 31% |