Belmont Airbnb Market Analysis 2025: Short Term Rental Data & Vacation Rental Statistics in Westmoreland, Jamaica
Is Airbnb profitable in Belmont in 2025? Explore comprehensive Airbnb analytics for Belmont, Westmoreland, Jamaica to uncover income potential. This 2025 STR market report for Belmont, based on AirROI data from November 2024 to October 2025, reveals key trends in the niche market of 19 active listings.
Whether you're considering an Airbnb investment in Belmont, optimizing your existing vacation rental, or exploring rental arbitrage opportunities, understanding the Belmont Airbnb data is crucial. Leveraging the low regulation environment is key to maximizing your short term rental income potential. Let's dive into the specifics.
Key Belmont Airbnb Performance Metrics Overview
Monthly Airbnb Revenue Variations & Income Potential in Belmont (2025)
Understanding the monthly revenue variations for Airbnb listings in Belmont is key to maximizing your short term rental income potential. Seasonality significantly impacts earnings. Our analysis, based on data from the past 12 months, shows that the peak revenue month for STRs in Belmont is typically August, while November often presents the lowest earnings, highlighting opportunities for strategic pricing adjustments during shoulder and low seasons. Explore the typical Airbnb income in Belmont across different performance tiers:
- Best-in-class properties (Top 10%) achieve $5,280+ monthly, often utilizing dynamic pricing and superior guest experiences.
- Strong performing properties (Top 25%) earn $1,839 or more, indicating effective management and desirable locations/amenities.
- Typical properties (Median) generate around $918 per month, representing the average market performance.
- Entry-level properties (Bottom 25%) see earnings around $305, often with potential for optimization.
Average Monthly Airbnb Earnings Trend in Belmont
Belmont Airbnb Occupancy Rate Trends (2025)
Maximize your bookings by understanding the Belmont STR occupancy trends. Seasonal demand shifts significantly influence how often properties are booked. Typically, Julysees the highest demand (peak season occupancy), while November experiences the lowest (low season). Effective strategies, like adjusting minimum stays or offering promotions, can boost occupancy during slower periods. Here's how different property tiers perform in Belmont:
- Best-in-class properties (Top 10%) achieve 62%+ occupancy, indicating high desirability and potentially optimized availability.
- Strong performing properties (Top 25%) maintain 47% or higher occupancy, suggesting good market fit and guest satisfaction.
- Typical properties (Median) have an occupancy rate around 25%.
- Entry-level properties (Bottom 25%) average 14% occupancy, potentially facing higher vacancy.
Average Monthly Occupancy Rate Trend in Belmont
Average Daily Rate (ADR) Airbnb Trends in Belmont (2025)
Effective short term rental pricing strategy in Belmont involves understanding monthly ADR fluctuations. The Average Daily Rate (ADR) for Airbnb in Belmont typically peaks in May and dips lowest during August. Leveraging Airbnb dynamic pricing tools or strategies based on this seasonality can significantly boost revenue. Here's a look at the typical nightly rates achieved:
- Best-in-class properties (Top 10%) command rates of $229+ per night, often due to premium features or locations.
- Strong performing properties (Top 25%) achieve nightly rates of $138 or more.
- Typical properties (Median) charge around $72 per night.
- Entry-level properties (Bottom 25%) earn around $52 per night.
Average Daily Rate (ADR) Trend by Month in Belmont
Get Live Belmont Market Intelligence 👇

Explore Real-time Analytics
Airbnb Seasonality Analysis & Trends in Belmont (2025)
Peak Season (August, July, June)
- Revenue averages $2,487 per month
- Occupancy rates average 38.3%
- Daily rates average $103
Shoulder Season
- Revenue averages $1,698 per month
- Occupancy maintains around 32.6%
- Daily rates hold near $112
Low Season (March, October, November)
- Revenue drops to average $998 per month
- Occupancy decreases to average 23.8%
- Daily rates adjust to average $109
Seasonality Insights for Belmont
- The Airbnb seasonality in Belmont shows highly seasonal trends requiring careful strategy. While the sections above show seasonal averages, it's also insightful to look at the extremes:
- During the high season, the absolute peak month showcases Belmont's highest earning potential, with monthly revenues capable of climbing to $2,698, occupancy reaching a high of 40.1%, and ADRs peaking at $115.
- Conversely, the slowest single month of the year, typically falling within the low season, marks the market's lowest point. In this month, revenue might dip to $866, occupancy could drop to 18.8%, and ADRs may adjust down to $102.
- Understanding both the seasonal averages and these monthly peaks and troughs in revenue, occupancy, and ADR is crucial for maximizing your Airbnb profit potential in Belmont.
Seasonal Strategies for Maximizing Profit
- Peak Season: Maximize revenue through premium pricing and potentially longer minimum stays. Ensure high availability.
- Low Season: Offer competitive pricing, special promotions (e.g., extended stay discounts), and flexible cancellation policies. Target off-season travelers like remote workers or budget-conscious guests.
- Shoulder Seasons: Implement dynamic pricing that balances peak and low rates. Target weekend travelers or specific events. Offer slightly more flexible terms than peak season.
- Regularly analyze your own performance against these Belmont seasonality benchmarks and adjust your pricing and availability strategy accordingly.
Best Areas for Airbnb Investment in Belmont (2025)
Exploring the top neighborhoods for short-term rentals in Belmont? This section highlights key areas, outlining why they are attractive for hosts and guests, along with notable local attractions. Consider these locations based on your target guest profile and investment strategy.
| Neighborhood / Area | Why Host Here? (Target Guests & Appeal) | Key Attractions & Landmarks |
|---|---|---|
| Negril | Known for its stunning beaches and vibrant nightlife, Negril is a popular destination for tourists seeking relaxation and adventure. It's famous for its Seven Mile Beach and laid-back atmosphere. | Seven Mile Beach, Rick's Cafe, Negril Lighthouse, Bloody Bay, Long Bay, Kushee Beach |
| Montego Bay | A bustling tourist hub with luxury resorts, Montego Bay offers a wide range of attractions for visitors. It's known for its beaches, historical sites, and lively atmosphere. | Doctor's Cave Beach, Rose Hall Great House, Montego Bay Marine Park, Hip Strip, The Sam Sharpe Square, Cornwall Beach |
| Ocho Rios | Popular for cruise ship tourism, Ocho Rios offers beautiful beaches and attractions like Dunn's River Falls. It's great for visitors searching for both relaxation and adventure activities. | Dunn's River Falls, Mystic Mountain, Ocho Rios Bay Beach, Fern Gully, Reggae Beach, Whitter Village |
| Port Antonio | Known for its natural beauty and less commercialized atmosphere, Port Antonio attracts those looking for adventure and tranquility amid lush landscapes and stunning coastlines. | Blue Lagoon, Frenchman's Cove Beach, The Blue Mountains, Rafting on the Rio Grande, Portland Parish Church, Cannon Beach |
| Kingston | The capital city of Jamaica, Kingston is rich in culture and history, featuring museums, music scenes, and vibrant nightlife. It attracts a diverse crowd interested in Jamaican culture. | Bob Marley Museum, National Gallery of Jamaica, Devon House, Hope Botanical Gardens, Port Royal, Emancipation Park |
| Treasure Beach | A great location for ecotourism, Treasure Beach is known for its friendly atmosphere and is popular among those seeking a peaceful getaway away from the tourist crowds. | Treasure Beach, Pelican Bar, Black River Safari, Luminous Lagoon, Great Pedro Bay, Parrotee Bay |
| Runaway Bay | Offering a blend of relaxation and adventure activities, Runaway Bay is surrounded by beautiful beaches and historical sites. It's ideal for tourists looking for a convenient base for exploring Jamaica. | Runaway Bay Beach, Green Grotto Caves, Flavours Beach, Chukka Caribbean Adventures, Columbus Park, Royal Palm Reserve |
| Falmouth | Falmouth is a historic town with restored Georgian architecture, offering both cultural experiences and access to nearby attractions like the beaches and greenery of Trelawny Parish. | Falmouth's Historic Town Centre, Glistening Waters Lagoon, Burwood Beach, Tharp's Beach, Martha Brae River, Water Square |
Understanding Airbnb License Requirements & STR Laws in Belmont (2025)
While Belmont, Westmoreland, Jamaica currently shows low STR regulations, specific Airbnb license requirements might still exist or change. Always verify the latest short term rental regulations and Airbnb license requirements directly with local government authorities for Belmont to ensure full compliance before hosting.
(Source: AirROI data, 2025, finding no licensed listings among those analyzed)
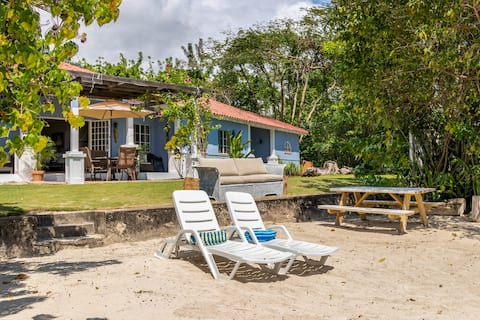
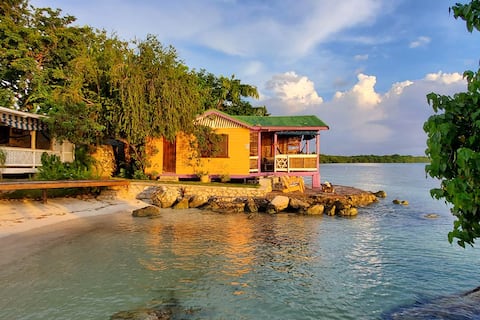
Top Performing Airbnb Properties in Belmont (2025)
Benchmark your potential! Explore examples of top-performing Airbnb properties in Belmontbased on Trailing Twelve Month (TTM) revenue. Analyze their characteristics, revenue, occupancy rate, and ADR to understand what drives success in this market.
Bel Cove Villa
Entire Place • 3 bedrooms
Horizon Cottage - Sea Ranch, Belmont Jamaica
Entire Place • 1 bedroom

Horizon Cottage - Rasta Ranch, Belmont Jamaica
Entire Place • 1 bedroom

Papaya Hill "Cloud 7" Natural Cottage, Belmont
Entire Place • 1 bedroom

Horizon's Justine's Harvey Suite
Entire Place • 1 bedroom

Kaya Cottage - 2 bedroom cottage by the seaside
Entire Place • 2 bedrooms
Note: Performance varies based on location, size, amenities, seasonality, and management quality. Data reflects the past 12 months.
Top Performing Airbnb Hosts in Belmont (2025)
Learn from the best! This table showcases top-performing Airbnb hosts in Belmont based on the number of properties managed and estimated total revenue over the past year. Analyze their scale and performance metrics.
| Host Name | Properties | Grossing Revenue | Stay Reviews | Avg Rating |
|---|---|---|---|---|
| Brannon | 1 | $88,847 | 110 | 4.80/5.0 |
| Nicole From Tiverton House, LL | 3 | $56,713 | 159 | 4.98/5.0 |
| Gisela | 2 | $15,241 | 100 | 4.93/5.0 |
| Carlene | 4 | $8,705 | 50 | 4.82/5.0 |
| Heather | 1 | $7,267 | 17 | 4.82/5.0 |
| Lydia | 3 | $4,725 | 155 | 4.77/5.0 |
| Newton | 3 | $4,143 | 20 | 4.85/5.0 |
| Sophia And Marcus | 1 | $3,768 | 1 | Not Rated |
| Hillary | 1 | $986 | 27 | 4.48/5.0 |
Analyzing the strategies of top hosts, such as their property selection, pricing, and guest communication, can offer valuable lessons for optimizing your own Airbnb operations in Belmont.
Dive Deeper: Advanced Belmont STR Market Data (2025)
Ready to unlock more insights? AirROI provides access to advanced metrics and comprehensive Airbnb data for Belmont. Explore detailed analytics beyond this report to refine your investment strategy, optimize pricing, and maximize your vacation rental profits.
Explore Advanced MetricsBelmont Short-Term Rental Market Composition (2025): Property & Room Types
Room Type Distribution
Property Type Distribution
Market Composition Insights for Belmont
- The Belmont Airbnb market composition is heavily skewed towards Private Room listings, which make up 57.9% of the 19 active rentals. This indicates strong guest preference for privacy and space.
- Looking at the property type distribution in Belmont, House properties are the most common (57.9%), reflecting the local real estate landscape.
- Houses represent a significant 57.9% portion, catering likely to families or larger groups.
- The presence of 26.3% Hotel/Boutique listings indicates integration with traditional hospitality.
Belmont Airbnb Room Capacity Analysis (2025): Bedroom Distribution
Distribution of Listings by Number of Bedrooms
Room Capacity Insights for Belmont
- The dominant room capacity in Belmont is 1 bedroom listings, making up 68.4% of the market. This suggests a strong demand for properties suitable for couples or solo travelers.
- Together, 1 bedroom and 3 bedrooms properties represent 78.9% of the active Airbnb listings in Belmont, indicating a high concentration in these sizes.
- With over half the market (68.4%) consisting of studios or 1-bedroom units, Belmont is particularly well-suited for individuals or couples.
Belmont Vacation Rental Guest Capacity Trends (2025)
Distribution of Listings by Guest Capacity
Guest Capacity Insights for Belmont
- The most common guest capacity trend in Belmont vacation rentals is listings accommodating 2 guests (57.9%). This suggests the primary traveler segment is likely couples or solo travelers.
- Properties designed for 2 guests and 4 guests dominate the Belmont STR market, accounting for 68.4% of listings.
- A significant 57.9% of listings cater specifically to 1-2 guests, highlighting strong demand from couples and solo travelers in Belmont.
- 10.6% of properties accommodate 6+ guests, serving the market segment for larger families or group travel in Belmont.
- On average, properties in Belmont are equipped to host 2.4 guests.
Belmont Airbnb Booking Patterns (2025): Available vs. Booked Days
Available Days Distribution
Booked Days Distribution
Booking Pattern Insights for Belmont
- The most common availability pattern in Belmont falls within the 271-366 days range, representing 78.9% of listings. This suggests many properties have significant open periods on their calendars.
- Approximately 89.4% of listings show high availability (181+ days open annually), indicating potential for increased bookings or specific owner usage patterns.
- For booked days, the 1-30 days range is most frequent in Belmont (42.1%), reflecting common guest stay durations or potential owner blocking patterns.
- A notable 10.5% of properties secure long booking periods (181+ days booked per year), highlighting successful long-term rental strategies or significant owner usage.
Belmont Airbnb Minimum Stay Requirements Analysis
Distribution of Listings by Minimum Night Requirement
1 Night
11 listings
57.9% of total
2 Nights
4 listings
21.1% of total
30+ Nights
4 listings
21.1% of total
Key Insights
- The most prevalent minimum stay requirement in Belmont is 1 Night, adopted by 57.9% of listings. This highlights the market's preference for shorter, flexible bookings.
- A strong majority (79.0%) of the Belmont Airbnb data shows acceptance of very short stays (1-2 nights), indicating a dynamic, high-turnover market.
- A significant segment (21.1%) caters to monthly stays (30+ nights) in Belmont, pointing to opportunities in the extended-stay market.
Recommendations
- Align with the market by considering a 1 Night minimum stay, as 57.9% of Belmont hosts use this setting.
- Explore offering discounts for stays of 30+ nights to attract the 21.1% of the market seeking extended stays.
- Adjust minimum nights based on seasonality – potentially shorter during low season and longer during peak demand periods in Belmont.
Belmont Airbnb Cancellation Policy Trends Analysis (2025)
Flexible
2 listings
10.5% of total
Moderate
7 listings
36.8% of total
Firm
6 listings
31.6% of total
Strict
4 listings
21.1% of total
Cancellation Policy Insights for Belmont
- The prevailing Airbnb cancellation policy trend in Belmont is Moderate, used by 36.8% of listings.
- A majority (52.7%) of hosts in Belmont utilize Firm or Strict policies, indicating a market where hosts prioritize booking security.
Recommendations for Hosts
- Consider adopting a Moderate policy to align with the 36.8% market standard in Belmont.
- Regularly review your cancellation policy against competitors and market demand shifts in Belmont.
Belmont STR Booking Lead Time Analysis (2025)
Average Booking Lead Time by Month
Booking Lead Time Insights for Belmont
- The overall average booking lead time for vacation rentals in Belmont is 46 days.
- Guests book furthest in advance for stays during January (average 89 days), likely coinciding with peak travel demand or local events.
- The shortest booking windows occur for stays in May (average 14 days), indicating more last-minute travel plans during this time.
- Seasonally, Winter (72 days avg.) sees the longest lead times, while Spring (39 days avg.) has the shortest, reflecting typical travel planning cycles.
Recommendations for Hosts
- Use the overall average lead time (46 days) as a baseline for your pricing and availability strategy in Belmont.
- For January stays, consider implementing length-of-stay discounts or slightly higher rates for bookings made less than 89 days out to capitalize on advance planning.
- During May, focus on last-minute booking availability and promotions, as guests book with very short notice (14 days avg.).
- Target marketing efforts for the Winter season well in advance (at least 72 days) to capture early planners.
- Monitor your own booking lead times against these Belmont averages to identify opportunities for dynamic pricing adjustments.
Popular & Essential Airbnb Amenities in Belmont (2025)
Amenity Prevalence
Amenity Insights for Belmont
- Popular amenities like Dishes and silverware, Wifi, Essentials are common but not universal. Offering these can provide a competitive edge.
- Warning: Wifi is not universally provided but is considered essential globally. Ensure reliable Wifi is offered.
Recommendations for Hosts
- Consider adding popular differentiators like Dishes and silverware or Wifi to increase appeal.
- Highlight unique or less common amenities you offer (e.g., hot tub, dedicated workspace, EV charger) in your listing description and photos.
- Regularly check competitor amenities in Belmont to stay competitive.
Belmont Airbnb Guest Demographics & Profile Analysis (2025)
Guest Profile Summary for Belmont
- The typical guest profile for Airbnb in Belmont consists of predominantly international visitors (98%), with top international origins including Germany, typically belonging to the Post-2000s (Gen Z/Alpha) group (50%), primarily speaking English or German.
- Domestic travelers account for 1.9% of guests.
- Key international markets include United States (34.6%) and Germany (13.5%).
- Top languages spoken are English (44.1%) followed by German (13.6%).
- A significant demographic segment is the Post-2000s (Gen Z/Alpha) group, representing 50% of guests.
Recommendations for Hosts
- Focus marketing internationally, particularly towards travelers from Germany.
- Tailor amenities and listing descriptions to appeal to the dominant Post-2000s (Gen Z/Alpha) demographic (e.g., highlight fast WiFi, smart home features, local guides).
- Highlight unique local experiences or amenities relevant to the primary guest profile.
- Consider seasonal promotions aligned with peak travel times for key origin markets.
Nearby Short-Term Rental Market Comparison
How does the Belmont Airbnb market stack up against its neighbors? Compare key performance metrics like average monthly revenue, ADR, and occupancy rates in surrounding areas to understand the broader regional STR landscape.
| Market | Active Properties | Monthly Revenue | Daily Rate | Avg. Occupancy |
|---|---|---|---|---|
| Barrett Town | 13 | $5,262 | $299.27 | 49% |
| Mount Zion | 31 | $4,101 | $412.96 | 35% |
| Ocho Rios | 18 | $3,661 | $413.02 | 30% |
| Duncans | 23 | $3,630 | $583.29 | 32% |
| West Bay | 31 | $3,574 | $398.00 | 43% |
| Unity Hall | 27 | $3,323 | $360.79 | 29% |
| Davis Cove | 16 | $2,828 | $303.22 | 29% |
| Reading | 47 | $2,611 | $236.47 | 41% |
| Bruces Hill | 16 | $2,307 | $663.98 | 21% |
| Treasure Beach | 139 | $2,294 | $325.87 | 30% |