Hellshire Airbnb Market Analysis 2026: Short Term Rental Data & Vacation Rental Statistics in Saint Catherine, Jamaica
Is Airbnb profitable in Hellshire in 2026? Explore comprehensive Airbnb analytics for Hellshire, Saint Catherine, Jamaica to uncover income potential. This 2026 STR market report for Hellshire, based on AirROI data from February 2025 to January 2026, reveals key trends in the niche market of 32 active listings.
Whether you're considering an Airbnb investment in Hellshire, optimizing your existing vacation rental, or exploring rental arbitrage opportunities, understanding the Hellshire Airbnb data is crucial. Leveraging the low regulation environment is key to maximizing your short term rental income potential. Let's dive into the specifics.
Key Hellshire Airbnb Performance Metrics Overview
Monthly Airbnb Revenue Variations & Income Potential in Hellshire (2026)
Understanding the monthly revenue variations for Airbnb listings in Hellshire is key to maximizing your short term rental income potential. Seasonality significantly impacts earnings. Our analysis, based on data from the past 12 months, shows that the peak revenue month for STRs in Hellshire is typically August, while June often presents the lowest earnings, highlighting opportunities for strategic pricing adjustments during shoulder and low seasons. Explore the typical Airbnb income in Hellshire across different performance tiers:
- Best-in-class properties (Top 10%) achieve $3,369+ monthly, often utilizing dynamic pricing and superior guest experiences.
- Strong performing properties (Top 25%) earn $1,555 or more, indicating effective management and desirable locations/amenities.
- Typical properties (Median) generate around $645 per month, representing the average market performance.
- Entry-level properties (Bottom 25%) see earnings around $308, often with potential for optimization.
Average Monthly Airbnb Earnings Trend in Hellshire
Hellshire Airbnb Occupancy Rate Trends (2026)
Maximize your bookings by understanding the Hellshire STR occupancy trends. Seasonal demand shifts significantly influence how often properties are booked. Typically, Februarysees the highest demand (peak season occupancy), while September experiences the lowest (low season). Effective strategies, like adjusting minimum stays or offering promotions, can boost occupancy during slower periods. Here's how different property tiers perform in Hellshire:
- Best-in-class properties (Top 10%) achieve 62%+ occupancy, indicating high desirability and potentially optimized availability.
- Strong performing properties (Top 25%) maintain 45% or higher occupancy, suggesting good market fit and guest satisfaction.
- Typical properties (Median) have an occupancy rate around 25%.
- Entry-level properties (Bottom 25%) average 12% occupancy, potentially facing higher vacancy.
Average Monthly Occupancy Rate Trend in Hellshire
Average Daily Rate (ADR) Airbnb Trends in Hellshire (2026)
Effective short term rental pricing strategy in Hellshire involves understanding monthly ADR fluctuations. The Average Daily Rate (ADR) for Airbnb in Hellshire typically peaks in December and dips lowest during February. Leveraging Airbnb dynamic pricing tools or strategies based on this seasonality can significantly boost revenue. Here's a look at the typical nightly rates achieved:
- Best-in-class properties (Top 10%) command rates of $248+ per night, often due to premium features or locations.
- Strong performing properties (Top 25%) achieve nightly rates of $103 or more.
- Typical properties (Median) charge around $77 per night.
- Entry-level properties (Bottom 25%) earn around $63 per night.
Average Daily Rate (ADR) Trend by Month in Hellshire
Get Live Hellshire Market Intelligence 👇

Explore Real-time Analytics
Airbnb Seasonality Analysis & Trends in Hellshire (2026)
Peak Season (August, July, February)
- Revenue averages $1,575 per month
- Occupancy rates average 37.2%
- Daily rates average $107
Shoulder Season
- Revenue averages $1,271 per month
- Occupancy maintains around 30.0%
- Daily rates hold near $114
Low Season (May, June, October)
- Revenue drops to average $994 per month
- Occupancy decreases to average 24.3%
- Daily rates adjust to average $111
Seasonality Insights for Hellshire
- The Airbnb seasonality in Hellshire shows moderate seasonality with distinct peak and low periods. While the sections above show seasonal averages, it's also insightful to look at the extremes:
- During the high season, the absolute peak month showcases Hellshire's highest earning potential, with monthly revenues capable of climbing to $1,673, occupancy reaching a high of 38.9%, and ADRs peaking at $122.
- Conversely, the slowest single month of the year, typically falling within the low season, marks the market's lowest point. In this month, revenue might dip to $955, occupancy could drop to 19.7%, and ADRs may adjust down to $102.
- Understanding both the seasonal averages and these monthly peaks and troughs in revenue, occupancy, and ADR is crucial for maximizing your Airbnb profit potential in Hellshire.
Seasonal Strategies for Maximizing Profit
- Peak Season: Maximize revenue through premium pricing and potentially longer minimum stays. Ensure high availability.
- Low Season: Offer competitive pricing, special promotions (e.g., extended stay discounts), and flexible cancellation policies. Target off-season travelers like remote workers or budget-conscious guests.
- Shoulder Seasons: Implement dynamic pricing that balances peak and low rates. Target weekend travelers or specific events. Offer slightly more flexible terms than peak season.
- Regularly analyze your own performance against these Hellshire seasonality benchmarks and adjust your pricing and availability strategy accordingly.
Best Areas for Airbnb Investment in Hellshire (2026)
Exploring the top neighborhoods for short-term rentals in Hellshire? This section highlights key areas, outlining why they are attractive for hosts and guests, along with notable local attractions. Consider these locations based on your target guest profile and investment strategy.
| Neighborhood / Area | Why Host Here? (Target Guests & Appeal) | Key Attractions & Landmarks |
|---|---|---|
| Hellshire Beach | Famous for its beautiful beaches and crystal clear waters, Hellshire Beach attracts both locals and tourists looking for a relaxing beach experience. Known for beachside vendors and water activities. | Hellshire Beach, Local Fish Fry, Portmore Mall, Fort Clarence Beach, Water Sports Activities |
| Caymanas Estates | A serene residential community that offers easy access to both the beach and the bustling Portmore area, ideal for families and those seeking tranquility. | Caymanas Golf Club, Local Parks, Community Events, Shopping Areas |
| Portmore | A vibrant town just a short distance from Hellshire, Portmore offers a mix of urban amenities and waterfront enjoyment. It's growing in popularity among tourists due to its attractions and local culture. | Portmore Town Centre, The Spanish Town Market, Local Nightlife, Waterfront Dining |
| Brighton Beach | Less crowded than Hellshire, Brighton Beach provides a more laid-back atmosphere with beautiful views and is a great place for relaxation. | Brighton Beach, Local Restaurants, Shade Tree Park |
| Dunn's River Falls | A bit further out, but a major tourist attraction in Jamaica. Many visitors stay close to nearby areas while visiting the falls. | Dunn's River Falls, Ocho Rios Beaches, Shopping in Ocho Rios |
| Spanish Town | Rich in history with colonial architecture, it offers a unique cultural experience further inland and attracts history buffs and cultural tourists. | Historic Sites, Local Markets, Cultural Events |
| Treasure Beach | Known for its scenic beauty and relaxed vibe, it’s popular among those looking for a unique getaway experience, though it's a bit further away from Hellshire. | Treasure Beach, Local Artisans, Boat Tours, Natural Springs |
| Mandeville | A charming town in the hills, often sought out for its cooler climate. It appeals to tourists looking for a different perspective of Jamaica. | Mandeville Market, Outdoor Parks, Local Festivals |
Understanding Airbnb License Requirements & STR Laws in Hellshire (2026)
While Hellshire, Saint Catherine, Jamaica currently shows low STR regulations, specific Airbnb license requirements might still exist or change. Always verify the latest short term rental regulations and Airbnb license requirements directly with local government authorities for Hellshire to ensure full compliance before hosting.
(Source: AirROI data, 2026, finding no licensed listings among those analyzed)
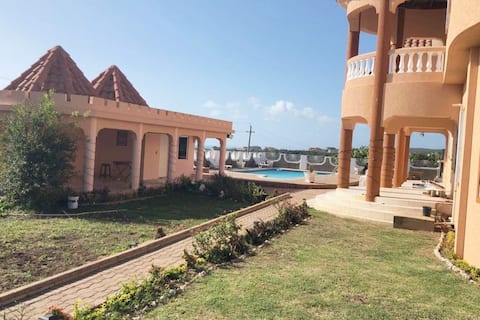
Top Performing Airbnb Properties in Hellshire (2026)
Benchmark your potential! Explore examples of top-performing Airbnb properties in Hellshirebased on Trailing Twelve Month (TTM) revenue. Analyze their characteristics, revenue, occupancy rate, and ADR to understand what drives success in this market.
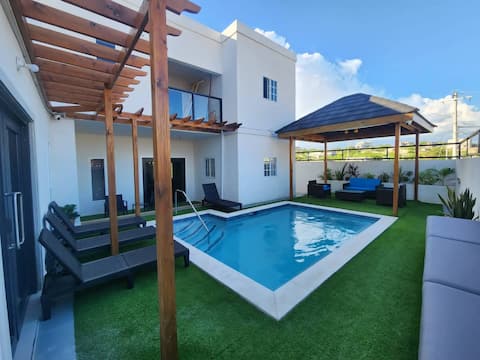
Sandhill's Private Pool and Gym, Luxxe 2 Bed Villa
Entire Place • 2 bedrooms

Luxurious 6 bed villa w/own pool
Entire Place • 6 bedrooms

Hellshire D'Villa Quite Area
Entire Place • 5 bedrooms
Destiny Haven
Entire Place • 3 bedrooms
Panorama Seaview Villa with Pool (Entire House)
Entire Place • 6 bedrooms

Hellshire king and Queen beds
Entire Place • 2 bedrooms
Note: Performance varies based on location, size, amenities, seasonality, and management quality. Data reflects the past 12 months.
Top Performing Airbnb Hosts in Hellshire (2026)
Learn from the best! This table showcases top-performing Airbnb hosts in Hellshire based on the number of properties managed and estimated total revenue over the past year. Analyze their scale and performance metrics.
| Host Name | Properties | Grossing Revenue | Stay Reviews | Avg Rating |
|---|---|---|---|---|
| Tanny | 2 | $106,243 | 33 | 5.00/5.0 |
| Devon | 1 | $29,090 | 24 | 4.50/5.0 |
| Melanie | 1 | $26,854 | 30 | 4.97/5.0 |
| Ryan | 2 | $19,095 | 7 | 3.40/5.0 |
| Robert | 2 | $18,041 | 169 | 4.78/5.0 |
| Alicia | 5 | $14,819 | 49 | 4.56/5.0 |
| Camille | 1 | $11,995 | 60 | 4.77/5.0 |
| Patrick | 1 | $8,869 | 41 | 4.76/5.0 |
| Kevaughn | 4 | $7,778 | 156 | 4.62/5.0 |
| Setpha | 3 | $7,194 | 34 | 4.92/5.0 |
Analyzing the strategies of top hosts, such as their property selection, pricing, and guest communication, can offer valuable lessons for optimizing your own Airbnb operations in Hellshire.
Dive Deeper: Advanced Hellshire STR Market Data (2026)
Ready to unlock more insights? AirROI provides access to advanced metrics and comprehensive Airbnb data for Hellshire. Explore detailed analytics beyond this report to refine your investment strategy, optimize pricing, and maximize your vacation rental profits.
Explore Advanced MetricsHellshire Short-Term Rental Market Composition (2026): Property & Room Types
Room Type Distribution
Property Type Distribution
Market Composition Insights for Hellshire
- The Hellshire Airbnb market composition is heavily skewed towards Entire Home/Apt listings, which make up 78.1% of the 32 active rentals. This indicates strong guest preference for privacy and space.
- Looking at the property type distribution in Hellshire, House properties are the most common (78.1%), reflecting the local real estate landscape.
- Houses represent a significant 78.1% portion, catering likely to families or larger groups.
- The presence of 12.5% Hotel/Boutique listings indicates integration with traditional hospitality.
Hellshire Airbnb Room Capacity Analysis (2026): Bedroom Distribution
Distribution of Listings by Number of Bedrooms
Room Capacity Insights for Hellshire
- The dominant room capacity in Hellshire is 2 bedrooms listings, making up 40.6% of the market. This suggests a strong demand for properties suitable for couples or solo travelers.
- Together, 2 bedrooms and 1 bedroom properties represent 62.5% of the active Airbnb listings in Hellshire, indicating a high concentration in these sizes.
- A significant 34.4% of listings offer 3+ bedrooms, catering to larger groups and families seeking more space in Hellshire.
Hellshire Vacation Rental Guest Capacity Trends (2026)
Distribution of Listings by Guest Capacity
Guest Capacity Insights for Hellshire
- The most common guest capacity trend in Hellshire vacation rentals is listings accommodating 4 guests (31.3%). This suggests the primary traveler segment is likely small families or groups.
- Properties designed for 4 guests and 6 guests dominate the Hellshire STR market, accounting for 43.8% of listings.
- 21.9% of properties accommodate 6+ guests, serving the market segment for larger families or group travel in Hellshire.
- On average, properties in Hellshire are equipped to host 3.7 guests.
Hellshire Airbnb Booking Patterns (2026): Available vs. Booked Days
Available Days Distribution
Booked Days Distribution
Booking Pattern Insights for Hellshire
- The most common availability pattern in Hellshire falls within the 271-366 days range, representing 75% of listings. This suggests many properties have significant open periods on their calendars.
- Approximately 93.8% of listings show high availability (181+ days open annually), indicating potential for increased bookings or specific owner usage patterns.
- For booked days, the 31-90 days range is most frequent in Hellshire (43.8%), reflecting common guest stay durations or potential owner blocking patterns.
- A notable 6.3% of properties secure long booking periods (181+ days booked per year), highlighting successful long-term rental strategies or significant owner usage.
Hellshire Airbnb Minimum Stay Requirements Analysis
Distribution of Listings by Minimum Night Requirement
1 Night
4 listings
12.5% of total
2 Nights
5 listings
15.6% of total
3 Nights
7 listings
21.9% of total
4-6 Nights
4 listings
12.5% of total
30+ Nights
12 listings
37.5% of total
Key Insights
- The most prevalent minimum stay requirement in Hellshire is 30+ Nights, adopted by 37.5% of listings. This highlights the market's preference for longer commitments.
- A significant segment (37.5%) caters to monthly stays (30+ nights) in Hellshire, pointing to opportunities in the extended-stay market.
Recommendations
- Align with the market by considering a 30+ Nights minimum stay, as 37.5% of Hellshire hosts use this setting.
- If feasible, allowing 1-night stays, especially midweek or during low season, could capture last-minute bookings, as only 12.5% currently do.
- Explore offering discounts for stays of 30+ nights to attract the 37.5% of the market seeking extended stays.
- Adjust minimum nights based on seasonality – potentially shorter during low season and longer during peak demand periods in Hellshire.
Hellshire Airbnb Cancellation Policy Trends Analysis (2026)
Flexible
9 listings
28.1% of total
Moderate
9 listings
28.1% of total
Firm
8 listings
25% of total
Strict
6 listings
18.8% of total
Cancellation Policy Insights for Hellshire
- The prevailing Airbnb cancellation policy trend in Hellshire is Flexible, used by 28.1% of listings.
- There's a relatively balanced mix between guest-friendly (56.2%) and stricter (43.8%) policies, offering choices for different guest needs.
Recommendations for Hosts
- Consider adopting a Flexible policy to align with the 28.1% market standard in Hellshire.
- Regularly review your cancellation policy against competitors and market demand shifts in Hellshire.
Hellshire STR Booking Lead Time Analysis (2026)
Average Booking Lead Time by Month
Booking Lead Time Insights for Hellshire
- The overall average booking lead time for vacation rentals in Hellshire is 20 days.
- Guests book furthest in advance for stays during December (average 38 days), likely coinciding with peak travel demand or local events.
- The shortest booking windows occur for stays in September (average 6 days), indicating more last-minute travel plans during this time.
- Seasonally, Winter (25 days avg.) sees the longest lead times, while Fall (15 days avg.) has the shortest, reflecting typical travel planning cycles.
Recommendations for Hosts
- Use the overall average lead time (20 days) as a baseline for your pricing and availability strategy in Hellshire.
- For December stays, consider implementing length-of-stay discounts or slightly higher rates for bookings made less than 38 days out to capitalize on advance planning.
- During September, focus on last-minute booking availability and promotions, as guests book with very short notice (6 days avg.).
- Target marketing efforts for the Winter season well in advance (at least 25 days) to capture early planners.
- Monitor your own booking lead times against these Hellshire averages to identify opportunities for dynamic pricing adjustments.
Popular & Essential Airbnb Amenities in Hellshire (2026)
Amenity Prevalence
Amenity Insights for Hellshire
- Essential amenities in Hellshire that guests expect include: Wifi, TV, Air conditioning, Free parking on premises. Lacking these (any) could significantly impact bookings.
- Popular amenities like Kitchen, Iron, Essentials are common but not universal. Offering these can provide a competitive edge.
Recommendations for Hosts
- Ensure your listing includes all essential amenities for Hellshire: Wifi, TV, Air conditioning, Free parking on premises.
- Prioritize adding missing essentials: TV, Air conditioning, Free parking on premises.
- Consider adding popular differentiators like Kitchen or Iron to increase appeal.
- Highlight unique or less common amenities you offer (e.g., hot tub, dedicated workspace, EV charger) in your listing description and photos.
- Regularly check competitor amenities in Hellshire to stay competitive.
Hellshire Airbnb Guest Demographics & Profile Analysis (2026)
Guest Profile Summary for Hellshire
- The typical guest profile for Airbnb in Hellshire consists of predominantly international visitors (93%), with top international origins including Canada, typically belonging to the Post-2000s (Gen Z/Alpha) group (50%), primarily speaking English or Italian.
- Domestic travelers account for 6.7% of guests.
- Key international markets include United States (68.9%) and Canada (13.3%).
- Top languages spoken are English (66.7%) followed by Italian (7.4%).
- A significant demographic segment is the Post-2000s (Gen Z/Alpha) group, representing 50% of guests.
Recommendations for Hosts
- Focus marketing internationally, particularly towards travelers from Canada.
- Tailor amenities and listing descriptions to appeal to the dominant Post-2000s (Gen Z/Alpha) demographic (e.g., highlight fast WiFi, smart home features, local guides).
- Highlight unique local experiences or amenities relevant to the primary guest profile.
- Consider seasonal promotions aligned with peak travel times for key origin markets.
Nearby Short-Term Rental Market Comparison
How does the Hellshire Airbnb market stack up against its neighbors? Compare key performance metrics like average monthly revenue, ADR, and occupancy rates in surrounding areas to understand the broader regional STR landscape.
| Market | Active Properties | Monthly Revenue | Daily Rate | Avg. Occupancy |
|---|---|---|---|---|
| Barrett Town | 12 | $5,328 | $312.58 | 52% |
| Unity Hall | 23 | $3,160 | $381.74 | 30% |
| Mount Zion | 31 | $3,102 | $507.23 | 33% |
| Duncans | 27 | $2,770 | $476.01 | 29% |
| Boscobel | 37 | $2,196 | $321.29 | 29% |
| Bruces Hill | 13 | $2,165 | $857.82 | 22% |
| St. James Parish | 60 | $2,161 | $406.48 | 30% |
| Drapers | 47 | $1,963 | $403.04 | 26% |
| Reading | 56 | $1,944 | $209.41 | 39% |
| Culloden | 13 | $1,907 | $405.25 | 30% |