Drax Hall Airbnb Market Analysis 2026: Short Term Rental Data & Vacation Rental Statistics in Saint Ann, Jamaica
Is Airbnb profitable in Drax Hall in 2026? Explore comprehensive Airbnb analytics for Drax Hall, Saint Ann, Jamaica to uncover income potential. This 2026 STR market report for Drax Hall, based on AirROI data from February 2025 to January 2026, reveals key trends in the market of 332 active listings.
Whether you're considering an Airbnb investment in Drax Hall, optimizing your existing vacation rental, or exploring rental arbitrage opportunities, understanding the Drax Hall Airbnb data is crucial. Leveraging the low regulation environment is key to maximizing your short term rental income potential. Let's dive into the specifics.
Key Drax Hall Airbnb Performance Metrics Overview
Monthly Airbnb Revenue Variations & Income Potential in Drax Hall (2026)
Understanding the monthly revenue variations for Airbnb listings in Drax Hall is key to maximizing your short term rental income potential. Seasonality significantly impacts earnings. Our analysis, based on data from the past 12 months, shows that the peak revenue month for STRs in Drax Hall is typically April, while January often presents the lowest earnings, highlighting opportunities for strategic pricing adjustments during shoulder and low seasons. Explore the typical Airbnb income in Drax Hall across different performance tiers:
- Best-in-class properties (Top 10%) achieve $4,807+ monthly, often utilizing dynamic pricing and superior guest experiences.
- Strong performing properties (Top 25%) earn $2,822 or more, indicating effective management and desirable locations/amenities.
- Typical properties (Median) generate around $1,473 per month, representing the average market performance.
- Entry-level properties (Bottom 25%) see earnings around $724, often with potential for optimization.
Average Monthly Airbnb Earnings Trend in Drax Hall
Drax Hall Airbnb Occupancy Rate Trends (2026)
Maximize your bookings by understanding the Drax Hall STR occupancy trends. Seasonal demand shifts significantly influence how often properties are booked. Typically, Julysees the highest demand (peak season occupancy), while January experiences the lowest (low season). Effective strategies, like adjusting minimum stays or offering promotions, can boost occupancy during slower periods. Here's how different property tiers perform in Drax Hall:
- Best-in-class properties (Top 10%) achieve 63%+ occupancy, indicating high desirability and potentially optimized availability.
- Strong performing properties (Top 25%) maintain 43% or higher occupancy, suggesting good market fit and guest satisfaction.
- Typical properties (Median) have an occupancy rate around 26%.
- Entry-level properties (Bottom 25%) average 14% occupancy, potentially facing higher vacancy.
Average Monthly Occupancy Rate Trend in Drax Hall
Average Daily Rate (ADR) Airbnb Trends in Drax Hall (2026)
Effective short term rental pricing strategy in Drax Hall involves understanding monthly ADR fluctuations. The Average Daily Rate (ADR) for Airbnb in Drax Hall typically peaks in August and dips lowest during November. Leveraging Airbnb dynamic pricing tools or strategies based on this seasonality can significantly boost revenue. Here's a look at the typical nightly rates achieved:
- Best-in-class properties (Top 10%) command rates of $495+ per night, often due to premium features or locations.
- Strong performing properties (Top 25%) achieve nightly rates of $323 or more.
- Typical properties (Median) charge around $182 per night.
- Entry-level properties (Bottom 25%) earn around $120 per night.
Average Daily Rate (ADR) Trend by Month in Drax Hall
Get Live Drax Hall Market Intelligence 👇

Explore Real-time Analytics
Airbnb Seasonality Analysis & Trends in Drax Hall (2026)
Peak Season (April, December, August)
- Revenue averages $3,053 per month
- Occupancy rates average 34.2%
- Daily rates average $308
Shoulder Season
- Revenue averages $2,543 per month
- Occupancy maintains around 31.4%
- Daily rates hold near $306
Low Season (January, May, September)
- Revenue drops to average $1,872 per month
- Occupancy decreases to average 24.8%
- Daily rates adjust to average $305
Seasonality Insights for Drax Hall
- The Airbnb seasonality in Drax Hall shows moderate seasonality with distinct peak and low periods. While the sections above show seasonal averages, it's also insightful to look at the extremes:
- During the high season, the absolute peak month showcases Drax Hall's highest earning potential, with monthly revenues capable of climbing to $3,081, occupancy reaching a high of 37.2%, and ADRs peaking at $313.
- Conversely, the slowest single month of the year, typically falling within the low season, marks the market's lowest point. In this month, revenue might dip to $1,700, occupancy could drop to 21.3%, and ADRs may adjust down to $302.
- Understanding both the seasonal averages and these monthly peaks and troughs in revenue, occupancy, and ADR is crucial for maximizing your Airbnb profit potential in Drax Hall.
Seasonal Strategies for Maximizing Profit
- Peak Season: Maximize revenue through premium pricing and potentially longer minimum stays. Ensure high availability.
- Low Season: Offer competitive pricing, special promotions (e.g., extended stay discounts), and flexible cancellation policies. Target off-season travelers like remote workers or budget-conscious guests.
- Shoulder Seasons: Implement dynamic pricing that balances peak and low rates. Target weekend travelers or specific events. Offer slightly more flexible terms than peak season.
- Regularly analyze your own performance against these Drax Hall seasonality benchmarks and adjust your pricing and availability strategy accordingly.
Best Areas for Airbnb Investment in Drax Hall (2026)
Exploring the top neighborhoods for short-term rentals in Drax Hall? This section highlights key areas, outlining why they are attractive for hosts and guests, along with notable local attractions. Consider these locations based on your target guest profile and investment strategy.
| Neighborhood / Area | Why Host Here? (Target Guests & Appeal) | Key Attractions & Landmarks |
|---|---|---|
| Ocho Rios | Popular tourist destination known for beautiful beaches, waterfalls, and adventure activities. Ideal for tourists looking for a Caribbean getaway with plenty of attractions nearby. | Dunn's River Falls, Mystic Mountain, Ocho Rios Bay Beach, Reggae Beach, White River Rafting |
| Runaway Bay | Quieter area compared to Ocho Rios, perfect for families and couples seeking relaxation. Offers beautiful beaches and local attractions. | Bamboo Beach Club, Runaway Bay Beach, Green Grotto Caves, Puerto Seco Beach |
| Montego Bay | Famous for its beaches, resorts, and vibrant nightlife. A top choice for travelers looking for a lively atmosphere and luxury accommodations. | Doctors Cave Beach, Martha Brae River, Hip Strip, Rose Hall Great House |
| Falmouth | Historic town known for colonial architecture and close proximity to attractions. Attracts tourists interested in history and culture. | Falmouth Historic District, Glistening Waters Lagoon, Wilderness Adventure Tours |
| Negril | Well-known for its stunning Seven Mile Beach and laid-back atmosphere. Great spot for tourists seeking relaxation and water activities. | Seven Mile Beach, Negril Cliffs, Rick's Cafe, Bloody Bay |
| Port Antonio | Less touristy, known for natural beauty and lush landscapes. Appeals to travelers looking for adventure and eco-tourism. | Blue Lagoon, Frenchman's Cove, Rio Grande Rafting |
| Treasure Beach | Famous for its relaxed vibe and beautiful coastline. Perfect for visitors looking for tranquility and scenic views. | Treasure Beach, Jack Sprat Beach, Pelican Bar |
| Saint Ann's Bay | Centrally located in Saint Ann, offering access to both beaches and inland attractions. Ideal for tourists wanting to explore the northern coast. | Puerto Seco Beach, Harmony Hall Art Gallery, Turtle River Park |
Understanding Airbnb License Requirements & STR Laws in Drax Hall (2026)
While Drax Hall, Saint Ann, Jamaica currently shows low STR regulations, specific Airbnb license requirements might still exist or change. Always verify the latest short term rental regulations and Airbnb license requirements directly with local government authorities for Drax Hall to ensure full compliance before hosting.
(Source: AirROI data, 2026, finding no licensed listings among those analyzed)
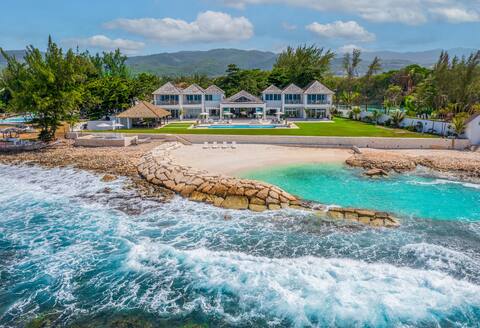
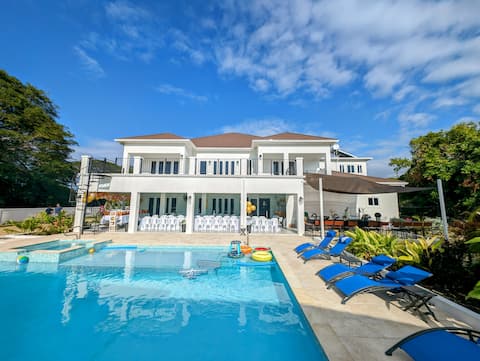
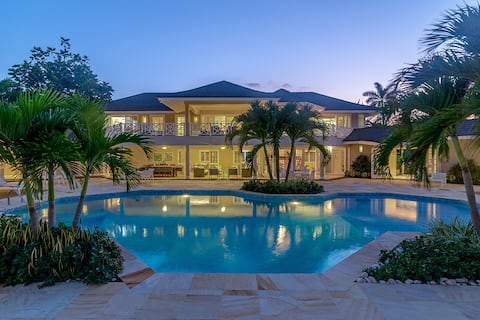
Top Performing Airbnb Properties in Drax Hall (2026)
Benchmark your potential! Explore examples of top-performing Airbnb properties in Drax Hallbased on Trailing Twelve Month (TTM) revenue. Analyze their characteristics, revenue, occupancy rate, and ADR to understand what drives success in this market.
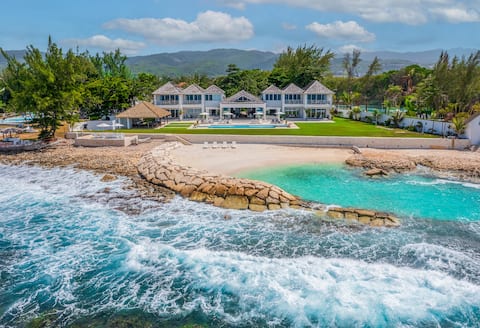
Kai Ki Villa Ocho Rios-Luxury 9 Bedroom Beachfront
Entire Place • 9 bedrooms

Canoe Cove
Entire Place • 7 bedrooms
Kai Ki Villa Ocho Rios-Luxury 6 Bedroom Beachfront
Entire Place • 6 bedrooms
Villa Jen: Poolside Luxury at Mammee Bay, Jamaica
Entire Place • 7 bedrooms

Jam Villa Resort
Entire Place • 7 bedrooms
Villa Mara
Entire Place • 7 bedrooms
Note: Performance varies based on location, size, amenities, seasonality, and management quality. Data reflects the past 12 months.
Top Performing Airbnb Hosts in Drax Hall (2026)
Learn from the best! This table showcases top-performing Airbnb hosts in Drax Hall based on the number of properties managed and estimated total revenue over the past year. Analyze their scale and performance metrics.
| Host Name | Properties | Grossing Revenue | Stay Reviews | Avg Rating |
|---|---|---|---|---|
| Adrien | 2 | $554,230 | 12 | 4.90/5.0 |
| Canoe Cove | 1 | $258,471 | 4 | 5.00/5.0 |
| Jennifer | 1 | $224,785 | 6 | 4.83/5.0 |
| Jemmy | 8 | $194,897 | 79 | 4.82/5.0 |
| Germy | 7 | $191,628 | 134 | 4.69/5.0 |
| Areca Homes | 6 | $169,689 | 109 | 4.85/5.0 |
| Keron & Abigail | 9 | $128,725 | 104 | 4.91/5.0 |
| Tamue | 2 | $127,001 | 55 | 4.74/5.0 |
| Rick | 1 | $118,526 | 37 | 4.89/5.0 |
| Coastal | 2 | $112,395 | 61 | 4.92/5.0 |
Analyzing the strategies of top hosts, such as their property selection, pricing, and guest communication, can offer valuable lessons for optimizing your own Airbnb operations in Drax Hall.
Dive Deeper: Advanced Drax Hall STR Market Data (2026)
Ready to unlock more insights? AirROI provides access to advanced metrics and comprehensive Airbnb data for Drax Hall. Explore detailed analytics beyond this report to refine your investment strategy, optimize pricing, and maximize your vacation rental profits.
Explore Advanced MetricsDrax Hall Short-Term Rental Market Composition (2026): Property & Room Types
Room Type Distribution
Property Type Distribution
Market Composition Insights for Drax Hall
- The Drax Hall Airbnb market composition is heavily skewed towards Entire Home/Apt listings, which make up 93.1% of the 332 active rentals. This indicates strong guest preference for privacy and space.
- Looking at the property type distribution in Drax Hall, House properties are the most common (83.7%), reflecting the local real estate landscape.
- Houses represent a significant 83.7% portion, catering likely to families or larger groups.
- Smaller segments like hotel/boutique, others, unique stays (combined 5.7%) offer potential for unique stay experiences.
Drax Hall Airbnb Room Capacity Analysis (2026): Bedroom Distribution
Distribution of Listings by Number of Bedrooms
Room Capacity Insights for Drax Hall
- The dominant room capacity in Drax Hall is 3 bedrooms listings, making up 34.6% of the market. This suggests a strong demand for properties suitable for families or small groups.
- Together, 3 bedrooms and 2 bedrooms properties represent 66.5% of the active Airbnb listings in Drax Hall, indicating a high concentration in these sizes.
- A significant 52.6% of listings offer 3+ bedrooms, catering to larger groups and families seeking more space in Drax Hall.
Drax Hall Vacation Rental Guest Capacity Trends (2026)
Distribution of Listings by Guest Capacity
Guest Capacity Insights for Drax Hall
- The most common guest capacity trend in Drax Hall vacation rentals is listings accommodating 6 guests (26.2%). This suggests the primary traveler segment is likely larger groups.
- Properties designed for 6 guests and 8+ guests dominate the Drax Hall STR market, accounting for 50.6% of listings.
- 56.0% of properties accommodate 6+ guests, serving the market segment for larger families or group travel in Drax Hall.
- On average, properties in Drax Hall are equipped to host 5.3 guests.
Drax Hall Airbnb Booking Patterns (2026): Available vs. Booked Days
Available Days Distribution
Booked Days Distribution
Booking Pattern Insights for Drax Hall
- The most common availability pattern in Drax Hall falls within the 271-366 days range, representing 69.9% of listings. This suggests many properties have significant open periods on their calendars.
- Approximately 94.6% of listings show high availability (181+ days open annually), indicating potential for increased bookings or specific owner usage patterns.
- For booked days, the 1-30 days range is most frequent in Drax Hall (35.5%), reflecting common guest stay durations or potential owner blocking patterns.
- A notable 5.4% of properties secure long booking periods (181+ days booked per year), highlighting successful long-term rental strategies or significant owner usage.
Drax Hall Airbnb Minimum Stay Requirements Analysis
Distribution of Listings by Minimum Night Requirement
1 Night
78 listings
23.5% of total
2 Nights
111 listings
33.4% of total
3 Nights
50 listings
15.1% of total
4-6 Nights
14 listings
4.2% of total
7-29 Nights
2 listings
0.6% of total
30+ Nights
77 listings
23.2% of total
Key Insights
- The most prevalent minimum stay requirement in Drax Hall is 2 Nights, adopted by 33.4% of listings. This highlights the market's preference for shorter, flexible bookings.
- A significant segment (23.2%) caters to monthly stays (30+ nights) in Drax Hall, pointing to opportunities in the extended-stay market.
Recommendations
- Align with the market by considering a 2 Nights minimum stay, as 33.4% of Drax Hall hosts use this setting.
- If feasible, allowing 1-night stays, especially midweek or during low season, could capture last-minute bookings, as only 23.5% currently do.
- Explore offering discounts for stays of 30+ nights to attract the 23.2% of the market seeking extended stays.
- Adjust minimum nights based on seasonality – potentially shorter during low season and longer during peak demand periods in Drax Hall.
Drax Hall Airbnb Cancellation Policy Trends Analysis (2026)
Super Strict 60 Days
2 listings
0.6% of total
Limited
6 listings
1.8% of total
Flexible
111 listings
33.4% of total
Moderate
102 listings
30.7% of total
Firm
78 listings
23.5% of total
Strict
33 listings
9.9% of total
Cancellation Policy Insights for Drax Hall
- The prevailing Airbnb cancellation policy trend in Drax Hall is Flexible, used by 33.4% of listings.
- There's a relatively balanced mix between guest-friendly (64.1%) and stricter (33.4%) policies, offering choices for different guest needs.
- Strict cancellation policies are quite rare (9.9%), potentially making listings with this policy less competitive unless justified by high demand or property type.
Recommendations for Hosts
- Consider adopting a Flexible policy to align with the 33.4% market standard in Drax Hall.
- Using a Strict policy might deter some guests, as only 9.9% of listings use it. Evaluate if potential revenue protection outweighs possible lower booking rates.
- Regularly review your cancellation policy against competitors and market demand shifts in Drax Hall.
Drax Hall STR Booking Lead Time Analysis (2026)
Average Booking Lead Time by Month
Booking Lead Time Insights for Drax Hall
- The overall average booking lead time for vacation rentals in Drax Hall is 45 days.
- Guests book furthest in advance for stays during December (average 76 days), likely coinciding with peak travel demand or local events.
- The shortest booking windows occur for stays in March (average 29 days), indicating more last-minute travel plans during this time.
- Seasonally, Winter (51 days avg.) sees the longest lead times, while Fall (38 days avg.) has the shortest, reflecting typical travel planning cycles.
Recommendations for Hosts
- Use the overall average lead time (45 days) as a baseline for your pricing and availability strategy in Drax Hall.
- For December stays, consider implementing length-of-stay discounts or slightly higher rates for bookings made less than 76 days out to capitalize on advance planning.
- Target marketing efforts for the Winter season well in advance (at least 51 days) to capture early planners.
- Monitor your own booking lead times against these Drax Hall averages to identify opportunities for dynamic pricing adjustments.
Popular & Essential Airbnb Amenities in Drax Hall (2026)
Amenity Prevalence
Amenity Insights for Drax Hall
- Essential amenities in Drax Hall that guests expect include: Wifi, TV, Air conditioning, Free parking on premises, Kitchen. Lacking these (any) could significantly impact bookings.
- Popular amenities like Iron, Pool, Cooking basics are common but not universal. Offering these can provide a competitive edge.
- A pool is a highly desired but not standard amenity, making it a key feature for attracting guests seeking leisure in Drax Hall.
Recommendations for Hosts
- Ensure your listing includes all essential amenities for Drax Hall: Wifi, TV, Air conditioning, Free parking on premises, Kitchen.
- Prioritize adding missing essentials: Wifi, TV, Air conditioning, Free parking on premises, Kitchen.
- Consider adding popular differentiators like Iron or Pool to increase appeal.
- Highlight unique or less common amenities you offer (e.g., hot tub, dedicated workspace, EV charger) in your listing description and photos.
- Regularly check competitor amenities in Drax Hall to stay competitive.
Drax Hall Airbnb Guest Demographics & Profile Analysis (2026)
Guest Profile Summary for Drax Hall
- The typical guest profile for Airbnb in Drax Hall consists of predominantly international visitors (85%), with top international origins including Jamaica, typically belonging to the Post-2000s (Gen Z/Alpha) group (50%), primarily speaking English or Spanish.
- Domestic travelers account for 15.3% of guests.
- Key international markets include United States (61.7%) and Jamaica (15.3%).
- Top languages spoken are English (75.8%) followed by Spanish (7.6%).
- A significant demographic segment is the Post-2000s (Gen Z/Alpha) group, representing 50% of guests.
Recommendations for Hosts
- Focus marketing internationally, particularly towards travelers from Jamaica.
- Tailor amenities and listing descriptions to appeal to the dominant Post-2000s (Gen Z/Alpha) demographic (e.g., highlight fast WiFi, smart home features, local guides).
- Highlight unique local experiences or amenities relevant to the primary guest profile.
- Consider seasonal promotions aligned with peak travel times for key origin markets.
Nearby Short-Term Rental Market Comparison
How does the Drax Hall Airbnb market stack up against its neighbors? Compare key performance metrics like average monthly revenue, ADR, and occupancy rates in surrounding areas to understand the broader regional STR landscape.
| Market | Active Properties | Monthly Revenue | Daily Rate | Avg. Occupancy |
|---|---|---|---|---|
| Barrett Town | 12 | $5,328 | $312.58 | 52% |
| Unity Hall | 23 | $3,160 | $381.74 | 30% |
| Mount Zion | 31 | $3,102 | $507.23 | 33% |
| Duncans | 27 | $2,770 | $476.01 | 29% |
| Davis Cove | 15 | $2,279 | $311.23 | 24% |
| Boscobel | 37 | $2,196 | $321.29 | 29% |
| Bruces Hill | 13 | $2,165 | $857.82 | 22% |
| St. James Parish | 60 | $2,161 | $406.48 | 30% |
| Drapers | 47 | $1,963 | $403.04 | 26% |
| Reading | 56 | $1,944 | $209.41 | 39% |