Isola del Liri Airbnb Market Analysis 2025: Short Term Rental Data & Vacation Rental Statistics in Lazio, Italy
Is Airbnb profitable in Isola del Liri in 2025? Explore comprehensive Airbnb analytics for Isola del Liri, Lazio, Italy to uncover income potential. This 2025 STR market report for Isola del Liri, based on AirROI data from June 2024 to May 2025, reveals key trends in the niche market of 19 active listings.
Whether you're considering an Airbnb investment in Isola del Liri, optimizing your existing vacation rental, or exploring rental arbitrage opportunities, understanding the Isola del Liri Airbnb data is crucial. Understanding the local regulations is key to maximizing your short term rental income potential. Let's dive into the specifics.
Key Isola del Liri Airbnb Performance Metrics Overview
Monthly Airbnb Revenue Variations & Income Potential in Isola del Liri (2025)
Understanding the monthly revenue variations for Airbnb listings in Isola del Liri is key to maximizing your short term rental income potential. Seasonality significantly impacts earnings. Our analysis, based on data from the past 12 months, shows that the peak revenue month for STRs in Isola del Liri is typically August, while June often presents the lowest earnings, highlighting opportunities for strategic pricing adjustments during shoulder and low seasons. Explore the typical Airbnb income in Isola del Liri across different performance tiers:
- Best-in-class properties (Top 10%) achieve $1,264+ monthly, often utilizing dynamic pricing and superior guest experiences.
- Strong performing properties (Top 25%) earn $891 or more, indicating effective management and desirable locations/amenities.
- Typical properties (Median) generate around $524 per month, representing the average market performance.
- Entry-level properties (Bottom 25%) see earnings around $275, often with potential for optimization.
Average Monthly Airbnb Earnings Trend in Isola del Liri
Isola del Liri Airbnb Occupancy Rate Trends (2025)
Maximize your bookings by understanding the Isola del Liri STR occupancy trends. Seasonal demand shifts significantly influence how often properties are booked. Typically, Augustsees the highest demand (peak season occupancy), while January experiences the lowest (low season). Effective strategies, like adjusting minimum stays or offering promotions, can boost occupancy during slower periods. Here's how different property tiers perform in Isola del Liri:
- Best-in-class properties (Top 10%) achieve 39%+ occupancy, indicating high desirability and potentially optimized availability.
- Strong performing properties (Top 25%) maintain 30% or higher occupancy, suggesting good market fit and guest satisfaction.
- Typical properties (Median) have an occupancy rate around 16%.
- Entry-level properties (Bottom 25%) average 8% occupancy, potentially facing higher vacancy.
Average Monthly Occupancy Rate Trend in Isola del Liri
Average Daily Rate (ADR) Airbnb Trends in Isola del Liri (2025)
Effective short term rental pricing strategy in Isola del Liri involves understanding monthly ADR fluctuations. The Average Daily Rate (ADR) for Airbnb in Isola del Liri typically peaks in May and dips lowest during October. Leveraging Airbnb dynamic pricing tools or strategies based on this seasonality can significantly boost revenue. Here's a look at the typical nightly rates achieved:
- Best-in-class properties (Top 10%) command rates of $245+ per night, often due to premium features or locations.
- Strong performing properties (Top 25%) achieve nightly rates of $125 or more.
- Typical properties (Median) charge around $82 per night.
- Entry-level properties (Bottom 25%) earn around $63 per night.
Average Daily Rate (ADR) Trend by Month in Isola del Liri
Get Live Isola del Liri Market Intelligence 👇
Explore Real-time Analytics
Airbnb Seasonality Analysis & Trends in Isola del Liri (2025)
Peak Season (August, September, October)
- Revenue averages $931 per month
- Occupancy rates average 28.2%
- Daily rates average $115
Shoulder Season
- Revenue averages $624 per month
- Occupancy maintains around 19.5%
- Daily rates hold near $116
Low Season (January, June, December)
- Revenue drops to average $414 per month
- Occupancy decreases to average 17.1%
- Daily rates adjust to average $115
Seasonality Insights for Isola del Liri
- The Airbnb seasonality in Isola del Liri shows highly seasonal trends requiring careful strategy. While the sections above show seasonal averages, it's also insightful to look at the extremes:
- During the high season, the absolute peak month showcases Isola del Liri's highest earning potential, with monthly revenues capable of climbing to $1,054, occupancy reaching a high of 37.7%, and ADRs peaking at $120.
- Conversely, the slowest single month of the year, typically falling within the low season, marks the market's lowest point. In this month, revenue might dip to $370, occupancy could drop to 14.3%, and ADRs may adjust down to $114.
- Understanding both the seasonal averages and these monthly peaks and troughs in revenue, occupancy, and ADR is crucial for maximizing your Airbnb profit potential in Isola del Liri.
Seasonal Strategies for Maximizing Profit
- Peak Season: Maximize revenue through premium pricing and potentially longer minimum stays. Ensure high availability.
- Low Season: Offer competitive pricing, special promotions (e.g., extended stay discounts), and flexible cancellation policies. Target off-season travelers like remote workers or budget-conscious guests.
- Shoulder Seasons: Implement dynamic pricing that balances peak and low rates. Target weekend travelers or specific events. Offer slightly more flexible terms than peak season.
- Regularly analyze your own performance against these Isola del Liri seasonality benchmarks and adjust your pricing and availability strategy accordingly.
Best Areas for Airbnb Investment in Isola del Liri (2025)
Exploring the top neighborhoods for short-term rentals in Isola del Liri? This section highlights key areas, outlining why they are attractive for hosts and guests, along with notable local attractions. Consider these locations based on your target guest profile and investment strategy.
| Neighborhood / Area | Why Host Here? (Target Guests & Appeal) | Key Attractions & Landmarks |
|---|---|---|
| Centro Storico | The historical center of Isola del Liri with charming streets, ancient architecture, and a vibrant local culture. Ideal for tourists looking to experience authentic Italian life and history. | Brescia Castle, Isola del Liri Waterfalls, Ponte di Madonna, Santissima Trinità Cathedral, local markets |
| Castelliri | A scenic area known for its beautiful views and hiking opportunities. Great for nature enthusiasts and those looking for a peaceful retreat. | Hiking trails, Natural parks, Scenic viewpoints |
| Sora | Nearby town known for its picturesque landscape, historical sites, and local festivals. Attracts visitors looking for a mix of culture and nature. | Sora Cathedral, Sacro Monte di San Bartolomeo, Parco Nazionale d'Abruzzo, annual cultural festivals |
| San Giovanni | Residential area offering a local experience with close proximity to amenities and attractions. Suitable for families and longer stays. | Local parks, Traditional restaurants, Family-friendly activities |
| Ceccano | A neighboring town popular for its historical sites and accessibility to larger cities. A good base for exploring the region. | Ceccano Abbey, Archaeological sites, Spas and wellness centers |
| Broccostella | A small town known for its serene atmosphere and beautiful landscapes, perfect for relaxation and outdoor enthusiasts. | Countryside walks, Local festivals, Community markets |
| Alvito | Famous for its medieval architecture and cultural heritage. Attracts tourists interested in history and art. | Castello di Alvito, Historical museums, Artisan shops |
| Pescosolido | An area known for its natural beauty and quaint villages, ideal for travelers looking for tranquility and scenic views. | Hiking and walking trails, Nature reserves, Traditional gastronomy |
Understanding Airbnb License Requirements & STR Laws in Isola del Liri (2025)
With 26% of listings showing registration in 2025, understanding potential Airbnb license requirements is crucial in Isola del Liri. Always verify the latest short term rental regulations and Airbnb license requirements directly with local government authorities for Isola del Liri to ensure full compliance before hosting.
(Source: AirROI data, 2025, based on 26% licensed listings)
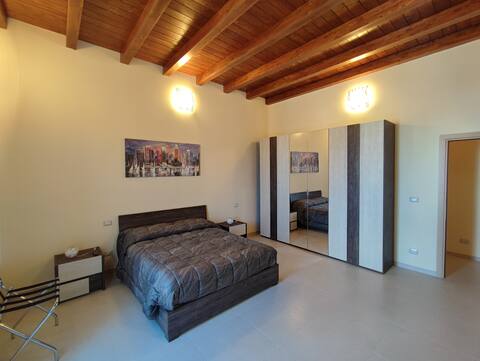
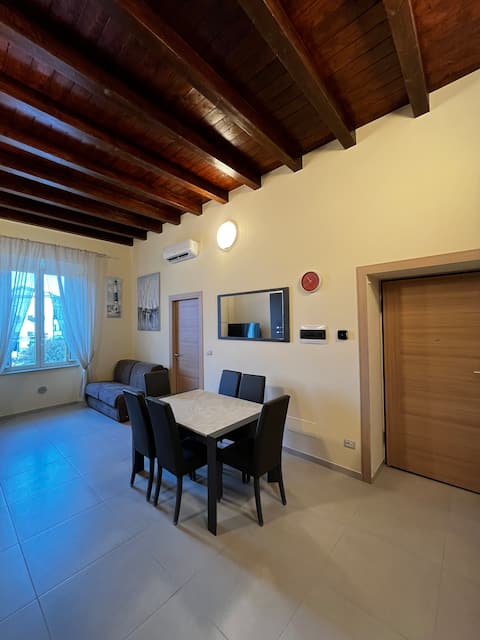
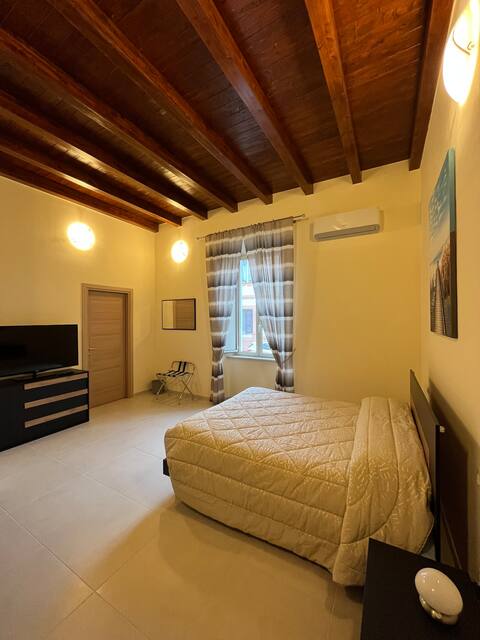
Top Performing Airbnb Properties in Isola del Liri (2025)
Benchmark your potential! Explore examples of top-performing Airbnb properties in Isola del Liribased on Trailing Twelve Month (TTM) revenue. Analyze their characteristics, revenue, occupancy rate, and ADR to understand what drives success in this market.
Appartamento 2 - In Centro R&A
Entire Place • 2 bedrooms
Appartamento 3 - In Centro R&A
Entire Place • 2 bedrooms
Camera doppia - In Centro R&A
Entire Place • 1 bedroom

Waterfall San Lorenzo
Entire Place • 2 bedrooms
Appartamento 1 - In Centro R&A
Entire Place • 1 bedroom

Downtown apartment
Entire Place • 1 bedroom
Note: Performance varies based on location, size, amenities, seasonality, and management quality. Data reflects the past 12 months.
Top Performing Airbnb Hosts in Isola del Liri (2025)
Learn from the best! This table showcases top-performing Airbnb hosts in Isola del Liri based on the number of properties managed and estimated total revenue over the past year. Analyze their scale and performance metrics.
| Host Name | Properties | Grossing Revenue | Stay Reviews | Avg Rating |
|---|---|---|---|---|
| Host #510325672 | 5 | $46,312 | 2 | N/A/5.0 |
| Massimo | 2 | $13,082 | 56 | 4.79/5.0 |
| Lorella | 2 | $7,149 | 55 | 4.75/5.0 |
| Emanuele | 1 | $6,488 | 9 | 4.56/5.0 |
| Daniela | 1 | $4,294 | 3 | 4.67/5.0 |
| Fabio Giovannone | 1 | $4,289 | 6 | 4.83/5.0 |
| Host #516492708 | 1 | $3,474 | 2 | N/A/5.0 |
| Daniele | 1 | $1,941 | 14 | 4.93/5.0 |
| Diego | 1 | $1,925 | 16 | 4.56/5.0 |
| Alberto | 1 | $1,885 | 35 | 4.91/5.0 |
Analyzing the strategies of top hosts, such as their property selection, pricing, and guest communication, can offer valuable lessons for optimizing your own Airbnb operations in Isola del Liri.
Dive Deeper: Advanced Isola del Liri STR Market Data (2025)
Ready to unlock more insights? AirROI provides access to advanced metrics and comprehensive Airbnb data for Isola del Liri. Explore detailed analytics beyond this report to refine your investment strategy, optimize pricing, and maximize your vacation rental profits.
Explore Advanced MetricsIsola del Liri Short-Term Rental Market Composition (2025): Property & Room Types
Room Type Distribution
Property Type Distribution
Market Composition Insights for Isola del Liri
- The Isola del Liri Airbnb market composition is heavily skewed towards Entire Home/Apt listings, which make up 89.5% of the 19 active rentals. This indicates strong guest preference for privacy and space.
- Looking at the property type distribution in Isola del Liri, Apartment/Condo properties are the most common (78.9%), reflecting the local real estate landscape.
- Houses represent a significant 15.8% portion, catering likely to families or larger groups.
Isola del Liri Airbnb Room Capacity Analysis (2025): Bedroom Distribution
Distribution of Listings by Number of Bedrooms
Room Capacity Insights for Isola del Liri
- The dominant room capacity in Isola del Liri is 1 bedroom listings, making up 57.9% of the market. This suggests a strong demand for properties suitable for couples or solo travelers.
- Together, 1 bedroom and 2 bedrooms properties represent 94.7% of the active Airbnb listings in Isola del Liri, indicating a high concentration in these sizes.
- With over half the market (57.9%) consisting of studios or 1-bedroom units, Isola del Liri is particularly well-suited for individuals or couples.
Isola del Liri Vacation Rental Guest Capacity Trends (2025)
Distribution of Listings by Guest Capacity
Guest Capacity Insights for Isola del Liri
- The most common guest capacity trend in Isola del Liri vacation rentals is listings accommodating 2 guests (36.8%). This suggests the primary traveler segment is likely couples or solo travelers.
- Properties designed for 2 guests and 4 guests dominate the Isola del Liri STR market, accounting for 68.4% of listings.
- On average, properties in Isola del Liri are equipped to host 3.2 guests.
Isola del Liri Airbnb Booking Patterns (2025): Available vs. Booked Days
Available Days Distribution
Booked Days Distribution
Booking Pattern Insights for Isola del Liri
- The most common availability pattern in Isola del Liri falls within the 271-366 days range, representing 94.7% of listings. This suggests many properties have significant open periods on their calendars.
- Approximately 100.0% of listings show high availability (181+ days open annually), indicating potential for increased bookings or specific owner usage patterns.
- For booked days, the 31-90 days range is most frequent in Isola del Liri (63.2%), reflecting common guest stay durations or potential owner blocking patterns.
Isola del Liri Airbnb Minimum Stay Requirements Analysis
Distribution of Listings by Minimum Night Requirement
1 Night
14 listings
73.7% of total
2 Nights
2 listings
10.5% of total
7-29 Nights
1 listings
5.3% of total
30+ Nights
2 listings
10.5% of total
Key Insights
- The most prevalent minimum stay requirement in Isola del Liri is 1 Night, adopted by 73.7% of listings. This highlights the market's preference for shorter, flexible bookings.
- A strong majority (84.2%) of the Isola del Liri Airbnb data shows acceptance of very short stays (1-2 nights), indicating a dynamic, high-turnover market.
- A significant segment (10.5%) caters to monthly stays (30+ nights) in Isola del Liri, pointing to opportunities in the extended-stay market.
Recommendations
- Align with the market by considering a 1 Night minimum stay, as 73.7% of Isola del Liri hosts use this setting.
- Explore offering discounts for stays of 30+ nights to attract the 10.5% of the market seeking extended stays.
- Adjust minimum nights based on seasonality – potentially shorter during low season and longer during peak demand periods in Isola del Liri.
Isola del Liri Airbnb Cancellation Policy Trends Analysis (2025)
Flexible
6 listings
46.2% of total
Moderate
6 listings
46.2% of total
Strict
1 listings
7.7% of total
Cancellation Policy Insights for Isola del Liri
- The prevailing Airbnb cancellation policy trend in Isola del Liri is Flexible, used by 46.2% of listings.
- The market strongly favors guest-friendly terms, with 92.4% of listings offering Flexible or Moderate policies. This suggests guests in Isola del Liri may expect booking flexibility.
- Strict cancellation policies are quite rare (7.7%), potentially making listings with this policy less competitive unless justified by high demand or property type.
Recommendations for Hosts
- Consider adopting a Flexible policy to align with the 46.2% market standard in Isola del Liri.
- Using a Strict policy might deter some guests, as only 7.7% of listings use it. Evaluate if potential revenue protection outweighs possible lower booking rates.
- Regularly review your cancellation policy against competitors and market demand shifts in Isola del Liri.
Isola del Liri STR Booking Lead Time Analysis (2025)
Average Booking Lead Time by Month
Booking Lead Time Insights for Isola del Liri
- The overall average booking lead time for vacation rentals in Isola del Liri is 32 days.
- Guests book furthest in advance for stays during September (average 56 days), likely coinciding with peak travel demand or local events.
- The shortest booking windows occur for stays in November (average 10 days), indicating more last-minute travel plans during this time.
- Seasonally, Winter (33 days avg.) sees the longest lead times, while Fall (27 days avg.) has the shortest, reflecting typical travel planning cycles.
Recommendations for Hosts
- Use the overall average lead time (32 days) as a baseline for your pricing and availability strategy in Isola del Liri.
- For September stays, consider implementing length-of-stay discounts or slightly higher rates for bookings made less than 56 days out to capitalize on advance planning.
- During November, focus on last-minute booking availability and promotions, as guests book with very short notice (10 days avg.).
- Target marketing efforts for the Winter season well in advance (at least 33 days) to capture early planners.
- Monitor your own booking lead times against these Isola del Liri averages to identify opportunities for dynamic pricing adjustments.
Popular & Essential Airbnb Amenities in Isola del Liri (2025)
Amenity Prevalence
Amenity Insights for Isola del Liri
- Essential amenities in Isola del Liri that guests expect include: Heating. Lacking these (this) could significantly impact bookings.
- Popular amenities like Kitchen, Essentials, TV are common but not universal. Offering these can provide a competitive edge.
- Warning: Wifi is not universally provided but is considered essential globally. Ensure reliable Wifi is offered.
Recommendations for Hosts
- Ensure your listing includes all essential amenities for Isola del Liri: Heating.
- Consider adding popular differentiators like Kitchen or Essentials to increase appeal.
- Highlight unique or less common amenities you offer (e.g., hot tub, dedicated workspace, EV charger) in your listing description and photos.
- Regularly check competitor amenities in Isola del Liri to stay competitive.
Isola del Liri Airbnb Guest Demographics & Profile Analysis (2025)
Guest Profile Summary for Isola del Liri
- The typical guest profile for Airbnb in Isola del Liri consists of a mix of domestic (63%) and international guests, often arriving from nearby Rome, typically belonging to the Post-2000s (Gen Z/Alpha) group (50%), primarily speaking English or Italian.
- Domestic travelers account for 62.9% of guests.
- Key international markets include Italy (62.9%) and France (11.4%).
- Top languages spoken are English (48.3%) followed by Italian (27.6%).
- A significant demographic segment is the Post-2000s (Gen Z/Alpha) group, representing 50% of guests.
Recommendations for Hosts
- Target domestic marketing efforts towards travelers from Rome and Florence.
- Tailor amenities and listing descriptions to appeal to the dominant Post-2000s (Gen Z/Alpha) demographic (e.g., highlight fast WiFi, smart home features, local guides).
- Highlight unique local experiences or amenities relevant to the primary guest profile.
- Consider seasonal promotions aligned with peak travel times for key origin markets.
Nearby Short-Term Rental Market Comparison
How does the Isola del Liri Airbnb market stack up against its neighbors? Compare key performance metrics like average monthly revenue, ADR, and occupancy rates in surrounding areas to understand the broader regional STR landscape.
| Market | Active Properties | Monthly Revenue | Daily Rate | Avg. Occupancy |
|---|---|---|---|---|
| Positano | 702 | $6,467 | $635.74 | 51% |
| Praiano | 336 | $4,211 | $403.95 | 52% |
| Conca dei Marini | 117 | $3,801 | $390.34 | 49% |
| Capri | 431 | $3,466 | $586.83 | 39% |
| Sorrento | 1,576 | $3,366 | $342.64 | 47% |
| Massa Lubrense | 834 | $3,193 | $424.35 | 43% |
| Amalfi | 474 | $2,956 | $302.31 | 46% |
| Ravello | 267 | $2,896 | $327.11 | 45% |
| Collazzone | 28 | $2,719 | $351.53 | 35% |
| Atrani | 127 | $2,626 | $218.64 | 52% |