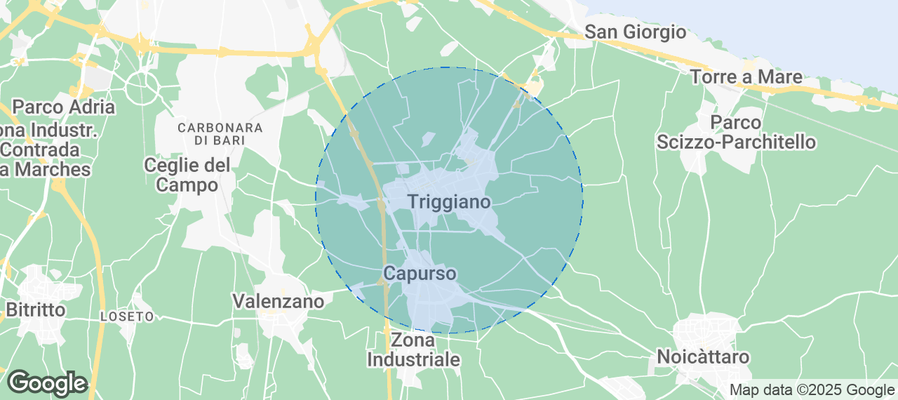
Triggiano Airbnb Market Analysis 2025: Short Term Rental Data & Vacation Rental Statistics in Apulia, Italy
Is Airbnb profitable in Triggiano in 2025? Explore comprehensive Airbnb analytics for Triggiano, Apulia, Italy to uncover income potential. This 2025 STR market report for Triggiano, based on AirROI data from June 2024 to May 2025, reveals key trends in the niche market of 19 active listings.
Whether you're considering an Airbnb investment in Triggiano, optimizing your existing vacation rental, or exploring rental arbitrage opportunities, understanding the Triggiano Airbnb data is crucial. Navigating the high regulation landscape is key to maximizing your short term rental income potential. Let's dive into the specifics.
Key Triggiano Airbnb Performance Metrics Overview
Monthly Airbnb Revenue Variations & Income Potential in Triggiano (2025)
Understanding the monthly revenue variations for Airbnb listings in Triggiano is key to maximizing your short term rental income potential. Seasonality significantly impacts earnings. Our analysis, based on data from the past 12 months, shows that the peak revenue month for STRs in Triggiano is typically August, while November often presents the lowest earnings, highlighting opportunities for strategic pricing adjustments during shoulder and low seasons. Explore the typical Airbnb income in Triggiano across different performance tiers:
- Best-in-class properties (Top 10%) achieve $1,627+ monthly, often utilizing dynamic pricing and superior guest experiences.
- Strong performing properties (Top 25%) earn $1,066 or more, indicating effective management and desirable locations/amenities.
- Typical properties (Median) generate around $694 per month, representing the average market performance.
- Entry-level properties (Bottom 25%) see earnings around $444, often with potential for optimization.
Average Monthly Airbnb Earnings Trend in Triggiano
Triggiano Airbnb Occupancy Rate Trends (2025)
Maximize your bookings by understanding the Triggiano STR occupancy trends. Seasonal demand shifts significantly influence how often properties are booked. Typically, Septembersees the highest demand (peak season occupancy), while November experiences the lowest (low season). Effective strategies, like adjusting minimum stays or offering promotions, can boost occupancy during slower periods. Here's how different property tiers perform in Triggiano:
- Best-in-class properties (Top 10%) achieve 63%+ occupancy, indicating high desirability and potentially optimized availability.
- Strong performing properties (Top 25%) maintain 54% or higher occupancy, suggesting good market fit and guest satisfaction.
- Typical properties (Median) have an occupancy rate around 33%.
- Entry-level properties (Bottom 25%) average 20% occupancy, potentially facing higher vacancy.
Average Monthly Occupancy Rate Trend in Triggiano
Average Daily Rate (ADR) Airbnb Trends in Triggiano (2025)
Effective short term rental pricing strategy in Triggiano involves understanding monthly ADR fluctuations. The Average Daily Rate (ADR) for Airbnb in Triggiano typically peaks in May and dips lowest during December. Leveraging Airbnb dynamic pricing tools or strategies based on this seasonality can significantly boost revenue. Here's a look at the typical nightly rates achieved:
- Best-in-class properties (Top 10%) command rates of $106+ per night, often due to premium features or locations.
- Strong performing properties (Top 25%) achieve nightly rates of $85 or more.
- Typical properties (Median) charge around $68 per night.
- Entry-level properties (Bottom 25%) earn around $51 per night.
Average Daily Rate (ADR) Trend by Month in Triggiano
Get Live Triggiano Market Intelligence 👇
Explore Real-time Analytics
Airbnb Seasonality Analysis & Trends in Triggiano (2025)
Peak Season (August, September, July)
- Revenue averages $1,387 per month
- Occupancy rates average 53.4%
- Daily rates average $70
Shoulder Season
- Revenue averages $744 per month
- Occupancy maintains around 37.4%
- Daily rates hold near $71
Low Season (January, February, November)
- Revenue drops to average $402 per month
- Occupancy decreases to average 21.6%
- Daily rates adjust to average $71
Seasonality Insights for Triggiano
- The Airbnb seasonality in Triggiano shows highly seasonal trends requiring careful strategy. While the sections above show seasonal averages, it's also insightful to look at the extremes:
- During the high season, the absolute peak month showcases Triggiano's highest earning potential, with monthly revenues capable of climbing to $1,555, occupancy reaching a high of 62.4%, and ADRs peaking at $81.
- Conversely, the slowest single month of the year, typically falling within the low season, marks the market's lowest point. In this month, revenue might dip to $320, occupancy could drop to 19.2%, and ADRs may adjust down to $61.
- Understanding both the seasonal averages and these monthly peaks and troughs in revenue, occupancy, and ADR is crucial for maximizing your Airbnb profit potential in Triggiano.
Seasonal Strategies for Maximizing Profit
- Peak Season: Maximize revenue through premium pricing and potentially longer minimum stays. Ensure high availability.
- Low Season: Offer competitive pricing, special promotions (e.g., extended stay discounts), and flexible cancellation policies. Target off-season travelers like remote workers or budget-conscious guests.
- Shoulder Seasons: Implement dynamic pricing that balances peak and low rates. Target weekend travelers or specific events. Offer slightly more flexible terms than peak season.
- Regularly analyze your own performance against these Triggiano seasonality benchmarks and adjust your pricing and availability strategy accordingly.
Best Areas for Airbnb Investment in Triggiano (2025)
Exploring the top neighborhoods for short-term rentals in Triggiano? This section highlights key areas, outlining why they are attractive for hosts and guests, along with notable local attractions. Consider these locations based on your target guest profile and investment strategy.
| Neighborhood / Area | Why Host Here? (Target Guests & Appeal) | Key Attractions & Landmarks |
|---|---|---|
| Centro Storico | The historic center of Triggiano offers charming streets, cultural heritage, and local traditions. It's perfect for tourists wanting to experience authentic Italian life. | Chiesa Madre di San Giovanni Battista, Piazza della Repubblica, Castello Normanno, Museo della Civiltà Contadina, local eateries |
| Parco Comunale | A beautiful public park that attracts families and outdoor enthusiasts. It's a great area for Airbnb hosting due to its serene environment and recreational activities. | walking trails, picnic areas, children's playground, fitness stations |
| Via Bari | A busy street lined with shops, cafes, and bars. This area is vibrant and attracts visitors looking for local dining and shopping experiences. | local markets, restaurants, cafes, shopping boutiques |
| Ferrovia | Proximity to the train station makes it convenient for travelers to access neighboring cities. Ideal for airbnb hosts catering to commuters and tourists. | train service to Bari, public transport access |
| Collina di Triggiano | The hill area offers scenic views and options for nature trails, appealing to those who enjoy outdoor activities and a quieter stay. | natural reserves, hiking trails, panoramic views |
| Zona Artigianale | This industrial area is close to several businesses, attracting business travelers who need accommodation during work trips. | business parks, commercial facilities |
| Local Vineyards | Triggiano is close to several vineyards where visitors can have wine tastings and tours. A great attraction for casual and serious wine enthusiasts. | vineyard tours, wine tastings, local wine shops |
| Culturale | Known for its artistic community and cultural events, this area attracts those interested in workshops, arts, and festivals that take place throughout the year. | art exhibitions, cultural festivals, workshops |
Understanding Airbnb License Requirements & STR Laws in Triggiano (2025)
Yes, Triggiano, Apulia, Italy enforces high STR regulations. Obtaining a license and ensuring compliance is almost certainly required according to current 2025 STR laws. Always verify the latest short term rental regulations and Airbnb license requirements directly with local government authorities for Triggiano to ensure full compliance before hosting.
(Source: AirROI data, 2025, based on 42% licensed listings)
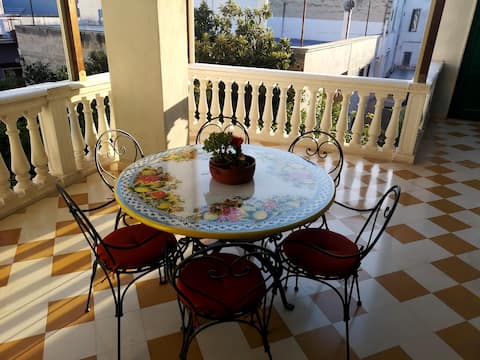
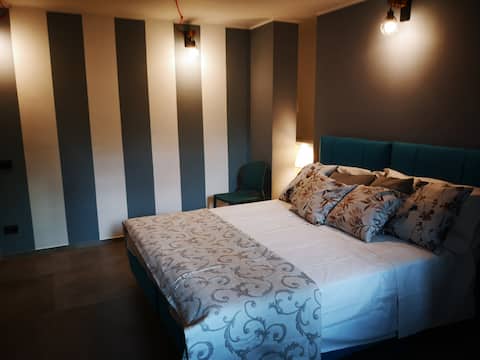
Top Performing Airbnb Properties in Triggiano (2025)
Benchmark your potential! Explore examples of top-performing Airbnb properties in Triggianobased on Trailing Twelve Month (TTM) revenue. Analyze their characteristics, revenue, occupancy rate, and ADR to understand what drives success in this market.

Villa Lagioia
Entire Place • 4 bedrooms
Palazzo Lagioia: Luxury apartment liberty
Entire Place • 2 bedrooms
Palazzo Lagioia 2: prestigious mini-apartment
Entire Place • 1 bedroom
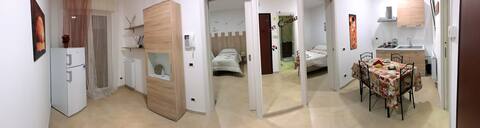
La Dolce Notte , First Floor Apartment
Entire Place • 2 bedrooms

Casa Emma, multi accessory
Entire Place • 2 bedrooms
Monovano Eumorfia
Entire Place • 1 bedroom
Note: Performance varies based on location, size, amenities, seasonality, and management quality. Data reflects the past 12 months.
Top Performing Airbnb Hosts in Triggiano (2025)
Learn from the best! This table showcases top-performing Airbnb hosts in Triggiano based on the number of properties managed and estimated total revenue over the past year. Analyze their scale and performance metrics.
| Host Name | Properties | Grossing Revenue | Stay Reviews | Avg Rating |
|---|---|---|---|---|
| Piervito | 3 | $36,386 | 237 | 4.84/5.0 |
| Anna Maria | 4 | $15,175 | 80 | 4.59/5.0 |
| Rosa | 2 | $8,574 | 8 | 4.67/5.0 |
| Alex | 2 | $6,164 | 4 | 4.67/5.0 |
| Enza | 1 | $6,021 | 15 | 4.87/5.0 |
| Ezia | 1 | $4,280 | 1 | N/A/5.0 |
| Host #537150333 | 1 | $4,275 | 2 | N/A/5.0 |
| William | 1 | $2,723 | 4 | 5.00/5.0 |
| Host #387528787 | 1 | $1,619 | 0 | N/A/5.0 |
| Host #39704877 | 1 | $756 | 1 | N/A/5.0 |
Analyzing the strategies of top hosts, such as their property selection, pricing, and guest communication, can offer valuable lessons for optimizing your own Airbnb operations in Triggiano.
Dive Deeper: Advanced Triggiano STR Market Data (2025)
Ready to unlock more insights? AirROI provides access to advanced metrics and comprehensive Airbnb data for Triggiano. Explore detailed analytics beyond this report to refine your investment strategy, optimize pricing, and maximize your vacation rental profits.
Explore Advanced MetricsTriggiano Short-Term Rental Market Composition (2025): Property & Room Types
Room Type Distribution
Property Type Distribution
Market Composition Insights for Triggiano
- The Triggiano Airbnb market composition is heavily skewed towards Entire Home/Apt listings, which make up 84.2% of the 19 active rentals. This indicates strong guest preference for privacy and space.
- Looking at the property type distribution in Triggiano, Apartment/Condo properties are the most common (68.4%), reflecting the local real estate landscape.
- Houses represent a significant 21.1% portion, catering likely to families or larger groups.
- The presence of 10.5% Hotel/Boutique listings indicates integration with traditional hospitality.
Triggiano Airbnb Room Capacity Analysis (2025): Bedroom Distribution
Distribution of Listings by Number of Bedrooms
Room Capacity Insights for Triggiano
- The dominant room capacity in Triggiano is 1 bedroom listings, making up 57.9% of the market. This suggests a strong demand for properties suitable for couples or solo travelers.
- Together, 1 bedroom and 2 bedrooms properties represent 94.7% of the active Airbnb listings in Triggiano, indicating a high concentration in these sizes.
- With over half the market (57.9%) consisting of studios or 1-bedroom units, Triggiano is particularly well-suited for individuals or couples.
- Listings with 3+ bedrooms (5.3%) represent a smaller niche, potentially indicating an underserved market for larger group accommodations in Triggiano.
Triggiano Vacation Rental Guest Capacity Trends (2025)
Distribution of Listings by Guest Capacity
Guest Capacity Insights for Triggiano
- The most common guest capacity trend in Triggiano vacation rentals is listings accommodating 2 guests (21.1%). This suggests the primary traveler segment is likely couples or solo travelers.
- Properties designed for 2 guests and 4 guests dominate the Triggiano STR market, accounting for 42.2% of listings.
- 21.1% of properties accommodate 6+ guests, serving the market segment for larger families or group travel in Triggiano.
- On average, properties in Triggiano are equipped to host 4.1 guests.
Triggiano Airbnb Booking Patterns (2025): Available vs. Booked Days
Available Days Distribution
Booked Days Distribution
Booking Pattern Insights for Triggiano
- The most common availability pattern in Triggiano falls within the 271-366 days range, representing 73.7% of listings. This suggests many properties have significant open periods on their calendars.
- Approximately 100.0% of listings show high availability (181+ days open annually), indicating potential for increased bookings or specific owner usage patterns.
- For booked days, the 31-90 days range is most frequent in Triggiano (47.4%), reflecting common guest stay durations or potential owner blocking patterns.
- A notable 5.3% of properties secure long booking periods (181+ days booked per year), highlighting successful long-term rental strategies or significant owner usage.
Triggiano Airbnb Minimum Stay Requirements Analysis
Distribution of Listings by Minimum Night Requirement
1 Night
8 listings
47.1% of total
3 Nights
4 listings
23.5% of total
7-29 Nights
4 listings
23.5% of total
30+ Nights
1 listings
5.9% of total
Key Insights
- The most prevalent minimum stay requirement in Triggiano is 1 Night, adopted by 47.1% of listings. This highlights the market's preference for shorter, flexible bookings.
Recommendations
- Align with the market by considering a 1 Night minimum stay, as 47.1% of Triggiano hosts use this setting.
- Explore offering discounts for stays of 30+ nights to attract the 5.9% of the market seeking extended stays.
- Adjust minimum nights based on seasonality – potentially shorter during low season and longer during peak demand periods in Triggiano.
Triggiano Airbnb Cancellation Policy Trends Analysis (2025)
Flexible
5 listings
33.3% of total
Moderate
7 listings
46.7% of total
Strict
3 listings
20% of total
Cancellation Policy Insights for Triggiano
- The prevailing Airbnb cancellation policy trend in Triggiano is Moderate, used by 46.7% of listings.
- The market strongly favors guest-friendly terms, with 80.0% of listings offering Flexible or Moderate policies. This suggests guests in Triggiano may expect booking flexibility.
Recommendations for Hosts
- Consider adopting a Moderate policy to align with the 46.7% market standard in Triggiano.
- Regularly review your cancellation policy against competitors and market demand shifts in Triggiano.
Triggiano STR Booking Lead Time Analysis (2025)
Average Booking Lead Time by Month
Booking Lead Time Insights for Triggiano
- The overall average booking lead time for vacation rentals in Triggiano is 36 days.
- Guests book furthest in advance for stays during September (average 79 days), likely coinciding with peak travel demand or local events.
- The shortest booking windows occur for stays in November (average 24 days), indicating more last-minute travel plans during this time.
- Seasonally, Summer (56 days avg.) sees the longest lead times, while Winter (32 days avg.) has the shortest, reflecting typical travel planning cycles.
Recommendations for Hosts
- Use the overall average lead time (36 days) as a baseline for your pricing and availability strategy in Triggiano.
- For September stays, consider implementing length-of-stay discounts or slightly higher rates for bookings made less than 79 days out to capitalize on advance planning.
- Target marketing efforts for the Summer season well in advance (at least 56 days) to capture early planners.
- Monitor your own booking lead times against these Triggiano averages to identify opportunities for dynamic pricing adjustments.
Popular & Essential Airbnb Amenities in Triggiano (2025)
Amenity Prevalence
Amenity Insights for Triggiano
- Popular amenities like Hot water, Wifi, Kitchen are common but not universal. Offering these can provide a competitive edge.
- Warning: Wifi is not universally provided but is considered essential globally. Ensure reliable Wifi is offered.
Recommendations for Hosts
- Consider adding popular differentiators like Hot water or Wifi to increase appeal.
- Highlight unique or less common amenities you offer (e.g., hot tub, dedicated workspace, EV charger) in your listing description and photos.
- Regularly check competitor amenities in Triggiano to stay competitive.
Triggiano Airbnb Guest Demographics & Profile Analysis (2025)
Guest Profile Summary for Triggiano
- The typical guest profile for Airbnb in Triggiano consists of predominantly international visitors (84%), with top international origins including Italy, typically belonging to the Post-2000s (Gen Z/Alpha) group (50%), primarily speaking English or French.
- Domestic travelers account for 15.6% of guests.
- Key international markets include France (31.3%) and Italy (15.6%).
- Top languages spoken are English (43.8%) followed by French (18.8%).
- A significant demographic segment is the Post-2000s (Gen Z/Alpha) group, representing 50% of guests.
Recommendations for Hosts
- Focus marketing internationally, particularly towards travelers from Italy.
- Tailor amenities and listing descriptions to appeal to the dominant Post-2000s (Gen Z/Alpha) demographic (e.g., highlight fast WiFi, smart home features, local guides).
- Highlight unique local experiences or amenities relevant to the primary guest profile.
- Consider seasonal promotions aligned with peak travel times for key origin markets.
Nearby Short-Term Rental Market Comparison
How does the Triggiano Airbnb market stack up against its neighbors? Compare key performance metrics like average monthly revenue, ADR, and occupancy rates in surrounding areas to understand the broader regional STR landscape.
| Market | Active Properties | Monthly Revenue | Daily Rate | Avg. Occupancy |
|---|---|---|---|---|
| Majkovi | 18 | $2,580 | $314.87 | 45% |
| Donja Banda | 22 | $2,051 | $338.36 | 37% |
| San Michele Salentino | 75 | $1,922 | $251.87 | 41% |
| Polignano a Mare | 674 | $1,716 | $205.25 | 42% |
| Torchiara | 23 | $1,689 | $271.12 | 26% |
| Castellana Grotte | 191 | $1,680 | $216.27 | 39% |
| Ostuni | 1,623 | $1,493 | $251.08 | 37% |
| Carovigno | 511 | $1,483 | $265.14 | 38% |
| Monopoli | 1,206 | $1,428 | $193.53 | 40% |
| Martina Franca | 619 | $1,415 | $217.64 | 37% |