Beit Shemesh Airbnb Market Analysis 2026: Short Term Rental Data & Vacation Rental Statistics in Jerusalem District, Israel
Is Airbnb profitable in Beit Shemesh in 2026? Explore comprehensive Airbnb analytics for Beit Shemesh, Jerusalem District, Israel to uncover income potential. This 2026 STR market report for Beit Shemesh, based on AirROI data from February 2025 to January 2026, reveals key trends in the niche market of 69 active listings.
Whether you're considering an Airbnb investment in Beit Shemesh, optimizing your existing vacation rental, or exploring rental arbitrage opportunities, understanding the Beit Shemesh Airbnb data is crucial. Leveraging the low regulation environment is key to maximizing your short term rental income potential. Let's dive into the specifics.
Key Beit Shemesh Airbnb Performance Metrics Overview
Monthly Airbnb Revenue Variations & Income Potential in Beit Shemesh (2026)
Understanding the monthly revenue variations for Airbnb listings in Beit Shemesh is key to maximizing your short term rental income potential. Seasonality significantly impacts earnings. Our analysis, based on data from the past 12 months, shows that the peak revenue month for STRs in Beit Shemesh is typically April, while May often presents the lowest earnings, highlighting opportunities for strategic pricing adjustments during shoulder and low seasons. Explore the typical Airbnb income in Beit Shemesh across different performance tiers:
- Best-in-class properties (Top 10%) achieve $4,012+ monthly, often utilizing dynamic pricing and superior guest experiences.
- Strong performing properties (Top 25%) earn $2,453 or more, indicating effective management and desirable locations/amenities.
- Typical properties (Median) generate around $1,371 per month, representing the average market performance.
- Entry-level properties (Bottom 25%) see earnings around $584, often with potential for optimization.
Average Monthly Airbnb Earnings Trend in Beit Shemesh
Beit Shemesh Airbnb Occupancy Rate Trends (2026)
Maximize your bookings by understanding the Beit Shemesh STR occupancy trends. Seasonal demand shifts significantly influence how often properties are booked. Typically, Aprilsees the highest demand (peak season occupancy), while May experiences the lowest (low season). Effective strategies, like adjusting minimum stays or offering promotions, can boost occupancy during slower periods. Here's how different property tiers perform in Beit Shemesh:
- Best-in-class properties (Top 10%) achieve 72%+ occupancy, indicating high desirability and potentially optimized availability.
- Strong performing properties (Top 25%) maintain 48% or higher occupancy, suggesting good market fit and guest satisfaction.
- Typical properties (Median) have an occupancy rate around 27%.
- Entry-level properties (Bottom 25%) average 9% occupancy, potentially facing higher vacancy.
Average Monthly Occupancy Rate Trend in Beit Shemesh
Average Daily Rate (ADR) Airbnb Trends in Beit Shemesh (2026)
Effective short term rental pricing strategy in Beit Shemesh involves understanding monthly ADR fluctuations. The Average Daily Rate (ADR) for Airbnb in Beit Shemesh typically peaks in January and dips lowest during February. Leveraging Airbnb dynamic pricing tools or strategies based on this seasonality can significantly boost revenue. Here's a look at the typical nightly rates achieved:
- Best-in-class properties (Top 10%) command rates of $552+ per night, often due to premium features or locations.
- Strong performing properties (Top 25%) achieve nightly rates of $330 or more.
- Typical properties (Median) charge around $179 per night.
- Entry-level properties (Bottom 25%) earn around $123 per night.
Average Daily Rate (ADR) Trend by Month in Beit Shemesh
Get Live Beit Shemesh Market Intelligence 👇

Explore Real-time Analytics
Airbnb Seasonality Analysis & Trends in Beit Shemesh (2026)
Peak Season (April, July, August)
- Revenue averages $2,336 per month
- Occupancy rates average 35.9%
- Daily rates average $273
Shoulder Season
- Revenue averages $1,875 per month
- Occupancy maintains around 33.3%
- Daily rates hold near $274
Low Season (May, June, November)
- Revenue drops to average $1,383 per month
- Occupancy decreases to average 28.3%
- Daily rates adjust to average $271
Seasonality Insights for Beit Shemesh
- The Airbnb seasonality in Beit Shemesh shows highly seasonal trends requiring careful strategy. While the sections above show seasonal averages, it's also insightful to look at the extremes:
- During the high season, the absolute peak month showcases Beit Shemesh's highest earning potential, with monthly revenues capable of climbing to $2,587, occupancy reaching a high of 43.5%, and ADRs peaking at $281.
- Conversely, the slowest single month of the year, typically falling within the low season, marks the market's lowest point. In this month, revenue might dip to $1,213, occupancy could drop to 27.0%, and ADRs may adjust down to $261.
- Understanding both the seasonal averages and these monthly peaks and troughs in revenue, occupancy, and ADR is crucial for maximizing your Airbnb profit potential in Beit Shemesh.
Seasonal Strategies for Maximizing Profit
- Peak Season: Maximize revenue through premium pricing and potentially longer minimum stays. Ensure high availability.
- Low Season: Offer competitive pricing, special promotions (e.g., extended stay discounts), and flexible cancellation policies. Target off-season travelers like remote workers or budget-conscious guests.
- Shoulder Seasons: Implement dynamic pricing that balances peak and low rates. Target weekend travelers or specific events. Offer slightly more flexible terms than peak season.
- Regularly analyze your own performance against these Beit Shemesh seasonality benchmarks and adjust your pricing and availability strategy accordingly.
Best Areas for Airbnb Investment in Beit Shemesh (2026)
Exploring the top neighborhoods for short-term rentals in Beit Shemesh? This section highlights key areas, outlining why they are attractive for hosts and guests, along with notable local attractions. Consider these locations based on your target guest profile and investment strategy.
| Neighborhood / Area | Why Host Here? (Target Guests & Appeal) | Key Attractions & Landmarks |
|---|---|---|
| Gimel | A vibrant area in Beit Shemesh known for its community feel and close proximity to parks and local amenities. It's ideal for families and visitors looking for a quieter stay while still being close to Jerusalem. | Beit Shemesh Park, Local markets, Shops and cafes, Nearby nature trails |
| Tzipori Street | This residential street has a mix of modern and traditional homes, appealing to visitors looking for local experience and home comforts while also being close to major transport links. | Public transportation access, Shopping areas, Local eateries |
| Be'er Sheva Street | A bustling area central to Beit Shemesh that attracts both families and young professionals alike. It's a good spot for short-term rentals given its accessibility and amenities. | Local parks, Community events, Restaurants and cafes |
| Old Beit Shemesh | Rich in history, this area offers a unique backdrop with its archaeological sites and traditional architecture, appealing to history buffs and those interested in culture. | Historical sites, Local museums, Cultural festivals |
| Nachal Soreq Park | A picturesque area near natural landscapes, great for outdoor enthusiasts and families looking for recreational activities and relaxing stays in nature. | Hiking trails, Biking paths, Picnic areas |
| Central Beit Shemesh | The heart of the city, filled with shops and dining options, making it a perfect location for tourists who want to experience local life and culture. | Shopping centers, City square, Local restaurants |
| Kiryat Yovel | Located just on the outskirts of Beit Shemesh, this district has a unique charm with its community vibe and proximity to major highways for easy travel to Jerusalem or Tel Aviv. | Nature walks, Community parks, Local cafes |
| Yoav Valley | A peaceful area surrounded by beautiful landscapes and farms, ideal for visitors looking for a rural retreat while still being within reach of urban attractions. | Scenic views, Farm tours, Nature reserves |
Understanding Airbnb License Requirements & STR Laws in Beit Shemesh (2026)
While Beit Shemesh, Jerusalem District, Israel currently shows low STR regulations, specific Airbnb license requirements might still exist or change. Always verify the latest short term rental regulations and Airbnb license requirements directly with local government authorities for Beit Shemesh to ensure full compliance before hosting.
(Source: AirROI data, 2026, finding no licensed listings among those analyzed)
Top Performing Airbnb Properties in Beit Shemesh (2026)
Benchmark your potential! Explore examples of top-performing Airbnb properties in Beit Shemeshbased on Trailing Twelve Month (TTM) revenue. Analyze their characteristics, revenue, occupancy rate, and ADR to understand what drives success in this market.

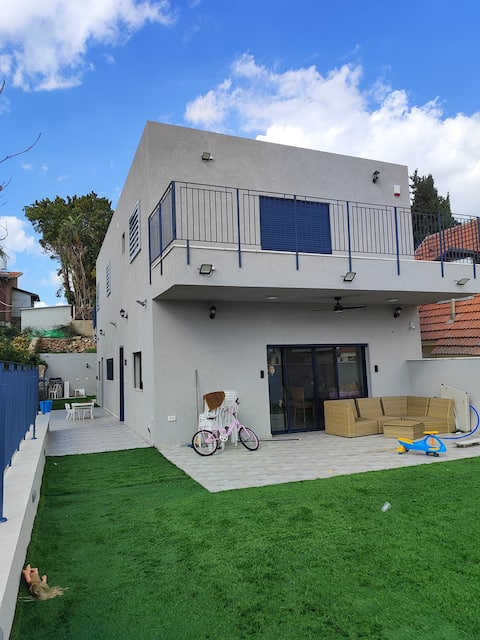
Stylish Large Kosher Family 3br Apt with Balcony
Entire Place • 3 bedrooms
Kosher villa with a view in the Jerusalem mountains
Entire Place • 7 bedrooms
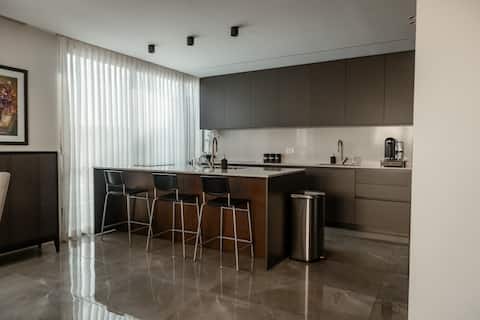
Luxury Penthouse Apartment in the Heart of RBS A
Entire Place • 3 bedrooms
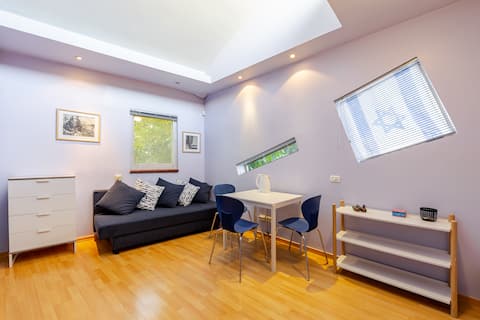
Above Katlav
Entire Place • 2 bedrooms
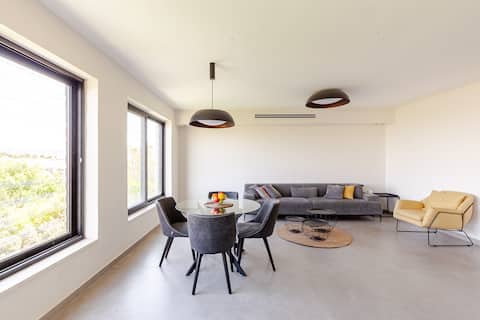
Bright, inviting, unique architecture, location
Entire Place • 1 bedroom
Spacious, kosher, Comfortable
Entire Place • 5 bedrooms
Note: Performance varies based on location, size, amenities, seasonality, and management quality. Data reflects the past 12 months.
Top Performing Airbnb Hosts in Beit Shemesh (2026)
Learn from the best! This table showcases top-performing Airbnb hosts in Beit Shemesh based on the number of properties managed and estimated total revenue over the past year. Analyze their scale and performance metrics.
| Host Name | Properties | Grossing Revenue | Stay Reviews | Avg Rating |
|---|---|---|---|---|
| ShneurRuty | 1 | $57,770 | 60 | 5.00/5.0 |
| מוישי | 1 | $49,996 | 3 | 5.00/5.0 |
| RBS Premier | 1 | $42,182 | 18 | 5.00/5.0 |
| Len | 1 | $30,703 | 19 | 5.00/5.0 |
| Otto | 1 | $29,300 | 66 | 4.89/5.0 |
| Yechiel | 1 | $28,318 | 1 | Not Rated |
| מאיר | 2 | $27,568 | 10 | 4.89/5.0 |
| Marla | 1 | $26,493 | 13 | 4.92/5.0 |
| David | 1 | $25,433 | 21 | 4.90/5.0 |
| ארי | 2 | $24,491 | 16 | 5.00/5.0 |
Analyzing the strategies of top hosts, such as their property selection, pricing, and guest communication, can offer valuable lessons for optimizing your own Airbnb operations in Beit Shemesh.
Dive Deeper: Advanced Beit Shemesh STR Market Data (2026)
Ready to unlock more insights? AirROI provides access to advanced metrics and comprehensive Airbnb data for Beit Shemesh. Explore detailed analytics beyond this report to refine your investment strategy, optimize pricing, and maximize your vacation rental profits.
Explore Advanced MetricsBeit Shemesh Short-Term Rental Market Composition (2026): Property & Room Types
Room Type Distribution
Property Type Distribution
Market Composition Insights for Beit Shemesh
- The Beit Shemesh Airbnb market composition is heavily skewed towards Entire Home/Apt listings, which make up 95.7% of the 69 active rentals. This indicates strong guest preference for privacy and space.
- Looking at the property type distribution in Beit Shemesh, Apartment/Condo properties are the most common (71%), reflecting the local real estate landscape.
- The presence of 10.1% Hotel/Boutique listings indicates integration with traditional hospitality.
Beit Shemesh Airbnb Room Capacity Analysis (2026): Bedroom Distribution
Distribution of Listings by Number of Bedrooms
Room Capacity Insights for Beit Shemesh
- The dominant room capacity in Beit Shemesh is 1 bedroom listings, making up 37.7% of the market. This suggests a strong demand for properties suitable for couples or solo travelers.
- Together, 1 bedroom and 2 bedrooms properties represent 66.7% of the active Airbnb listings in Beit Shemesh, indicating a high concentration in these sizes.
- A significant 28.9% of listings offer 3+ bedrooms, catering to larger groups and families seeking more space in Beit Shemesh.
Beit Shemesh Vacation Rental Guest Capacity Trends (2026)
Distribution of Listings by Guest Capacity
Guest Capacity Insights for Beit Shemesh
- The most common guest capacity trend in Beit Shemesh vacation rentals is listings accommodating 8+ guests (29%). This suggests the primary traveler segment is likely larger groups.
- Properties designed for 8+ guests and 2 guests dominate the Beit Shemesh STR market, accounting for 52.2% of listings.
- 46.3% of properties accommodate 6+ guests, serving the market segment for larger families or group travel in Beit Shemesh.
- On average, properties in Beit Shemesh are equipped to host 4.9 guests.
Beit Shemesh Airbnb Booking Patterns (2026): Available vs. Booked Days
Available Days Distribution
Booked Days Distribution
Booking Pattern Insights for Beit Shemesh
- The most common availability pattern in Beit Shemesh falls within the 271-366 days range, representing 75.4% of listings. This suggests many properties have significant open periods on their calendars.
- Approximately 95.7% of listings show high availability (181+ days open annually), indicating potential for increased bookings or specific owner usage patterns.
- For booked days, the 31-90 days range is most frequent in Beit Shemesh (36.2%), reflecting common guest stay durations or potential owner blocking patterns.
- A notable 5.7% of properties secure long booking periods (181+ days booked per year), highlighting successful long-term rental strategies or significant owner usage.
Beit Shemesh Airbnb Minimum Stay Requirements Analysis
Distribution of Listings by Minimum Night Requirement
1 Night
30 listings
43.5% of total
2 Nights
16 listings
23.2% of total
3 Nights
4 listings
5.8% of total
4-6 Nights
6 listings
8.7% of total
7-29 Nights
1 listings
1.4% of total
30+ Nights
12 listings
17.4% of total
Key Insights
- The most prevalent minimum stay requirement in Beit Shemesh is 1 Night, adopted by 43.5% of listings. This highlights the market's preference for shorter, flexible bookings.
- A strong majority (66.7%) of the Beit Shemesh Airbnb data shows acceptance of very short stays (1-2 nights), indicating a dynamic, high-turnover market.
- A significant segment (17.4%) caters to monthly stays (30+ nights) in Beit Shemesh, pointing to opportunities in the extended-stay market.
Recommendations
- Align with the market by considering a 1 Night minimum stay, as 43.5% of Beit Shemesh hosts use this setting.
- Explore offering discounts for stays of 30+ nights to attract the 17.4% of the market seeking extended stays.
- Adjust minimum nights based on seasonality – potentially shorter during low season and longer during peak demand periods in Beit Shemesh.
Beit Shemesh Airbnb Cancellation Policy Trends Analysis (2026)
Super Strict 60 Days
2 listings
2.9% of total
Flexible
22 listings
32.4% of total
Moderate
13 listings
19.1% of total
Firm
25 listings
36.8% of total
Strict
6 listings
8.8% of total
Cancellation Policy Insights for Beit Shemesh
- The prevailing Airbnb cancellation policy trend in Beit Shemesh is Firm, used by 36.8% of listings.
- There's a relatively balanced mix between guest-friendly (51.5%) and stricter (45.6%) policies, offering choices for different guest needs.
- Strict cancellation policies are quite rare (8.8%), potentially making listings with this policy less competitive unless justified by high demand or property type.
Recommendations for Hosts
- Consider adopting a Firm policy to align with the 36.8% market standard in Beit Shemesh.
- Using a Strict policy might deter some guests, as only 8.8% of listings use it. Evaluate if potential revenue protection outweighs possible lower booking rates.
- Regularly review your cancellation policy against competitors and market demand shifts in Beit Shemesh.
Beit Shemesh STR Booking Lead Time Analysis (2026)
Average Booking Lead Time by Month
Booking Lead Time Insights for Beit Shemesh
- The overall average booking lead time for vacation rentals in Beit Shemesh is 35 days.
- Guests book furthest in advance for stays during October (average 74 days), likely coinciding with peak travel demand or local events.
- The shortest booking windows occur for stays in June (average 24 days), indicating more last-minute travel plans during this time.
- Seasonally, Fall (52 days avg.) sees the longest lead times, while Summer (32 days avg.) has the shortest, reflecting typical travel planning cycles.
Recommendations for Hosts
- Use the overall average lead time (35 days) as a baseline for your pricing and availability strategy in Beit Shemesh.
- For October stays, consider implementing length-of-stay discounts or slightly higher rates for bookings made less than 74 days out to capitalize on advance planning.
- Target marketing efforts for the Fall season well in advance (at least 52 days) to capture early planners.
- Monitor your own booking lead times against these Beit Shemesh averages to identify opportunities for dynamic pricing adjustments.
Popular & Essential Airbnb Amenities in Beit Shemesh (2026)
Amenity Prevalence
Amenity Insights for Beit Shemesh
- Essential amenities in Beit Shemesh that guests expect include: Air conditioning. Lacking these (this) could significantly impact bookings.
- Popular amenities like Wifi, Kitchen, Free parking on premises are common but not universal. Offering these can provide a competitive edge.
- Warning: Wifi is not universally provided but is considered essential globally. Ensure reliable Wifi is offered.
Recommendations for Hosts
- Ensure your listing includes all essential amenities for Beit Shemesh: Air conditioning.
- Prioritize adding missing essentials: Air conditioning.
- Consider adding popular differentiators like Wifi or Kitchen to increase appeal.
- Highlight unique or less common amenities you offer (e.g., hot tub, dedicated workspace, EV charger) in your listing description and photos.
- Regularly check competitor amenities in Beit Shemesh to stay competitive.
Beit Shemesh Airbnb Guest Demographics & Profile Analysis (2026)
Guest Profile Summary for Beit Shemesh
- The typical guest profile for Airbnb in Beit Shemesh consists of predominantly international visitors (88%), with top international origins including Israel, typically belonging to the Post-2000s (Gen Z/Alpha) group (50%), primarily speaking English or Hebrew.
- Domestic travelers account for 11.8% of guests.
- Key international markets include United States (62.7%) and Israel (11.8%).
- Top languages spoken are English (60%) followed by Hebrew (24.4%).
- A significant demographic segment is the Post-2000s (Gen Z/Alpha) group, representing 50% of guests.
Recommendations for Hosts
- Focus marketing internationally, particularly towards travelers from Israel.
- Tailor amenities and listing descriptions to appeal to the dominant Post-2000s (Gen Z/Alpha) demographic (e.g., highlight fast WiFi, smart home features, local guides).
- Highlight unique local experiences or amenities relevant to the primary guest profile.
- Consider seasonal promotions aligned with peak travel times for key origin markets.
Nearby Short-Term Rental Market Comparison
How does the Beit Shemesh Airbnb market stack up against its neighbors? Compare key performance metrics like average monthly revenue, ADR, and occupancy rates in surrounding areas to understand the broader regional STR landscape.
| Market | Active Properties | Monthly Revenue | Daily Rate | Avg. Occupancy |
|---|---|---|---|---|
| Gilboa Regional Council | 81 | $4,225 | $551.37 | 31% |
| Emek HaMaayanot Regional Council | 75 | $3,365 | $489.11 | 31% |
| Hof HaCarmel Regional Council | 147 | $3,299 | $544.98 | 28% |
| Daliyat al-Karmel | 17 | $3,088 | $542.63 | 26% |
| Migdal | 86 | $2,967 | $556.42 | 28% |
| Kfar Tavor | 12 | $2,919 | $490.34 | 30% |
| Yavneel | 27 | $2,875 | $445.67 | 27% |
| Galil Tachton Regional Council | 83 | $2,858 | $420.47 | 30% |
| Arava Tichona Regional Council | 42 | $2,392 | $309.88 | 30% |
| Merom HaGalil Regional Council | 104 | $2,381 | $465.30 | 26% |