Tralee Municipal District Airbnb Market Analysis 2026: Short Term Rental Data & Vacation Rental Statistics in County Kerry, Ireland
Is Airbnb profitable in Tralee Municipal District in 2026? Explore comprehensive Airbnb analytics for Tralee Municipal District, County Kerry, Ireland to uncover income potential. This 2026 STR market report for Tralee Municipal District, based on AirROI data from February 2025 to January 2026, reveals key trends in the niche market of 177 active listings.
Whether you're considering an Airbnb investment in Tralee Municipal District, optimizing your existing vacation rental, or exploring rental arbitrage opportunities, understanding the Tralee Municipal District Airbnb data is crucial. Leveraging the low regulation environment is key to maximizing your short term rental income potential. Let's dive into the specifics.
Key Tralee Municipal District Airbnb Performance Metrics Overview
Monthly Airbnb Revenue Variations & Income Potential in Tralee Municipal District (2026)
Understanding the monthly revenue variations for Airbnb listings in Tralee Municipal District is key to maximizing your short term rental income potential. Seasonality significantly impacts earnings. Our analysis, based on data from the past 12 months, shows that the peak revenue month for STRs in Tralee Municipal District is typically August, while February often presents the lowest earnings, highlighting opportunities for strategic pricing adjustments during shoulder and low seasons. Explore the typical Airbnb income in Tralee Municipal District across different performance tiers:
- Best-in-class properties (Top 10%) achieve $5,016+ monthly, often utilizing dynamic pricing and superior guest experiences.
- Strong performing properties (Top 25%) earn $3,426 or more, indicating effective management and desirable locations/amenities.
- Typical properties (Median) generate around $2,172 per month, representing the average market performance.
- Entry-level properties (Bottom 25%) see earnings around $1,270, often with potential for optimization.
Average Monthly Airbnb Earnings Trend in Tralee Municipal District
Tralee Municipal District Airbnb Occupancy Rate Trends (2026)
Maximize your bookings by understanding the Tralee Municipal District STR occupancy trends. Seasonal demand shifts significantly influence how often properties are booked. Typically, Augustsees the highest demand (peak season occupancy), while January experiences the lowest (low season). Effective strategies, like adjusting minimum stays or offering promotions, can boost occupancy during slower periods. Here's how different property tiers perform in Tralee Municipal District:
- Best-in-class properties (Top 10%) achieve 82%+ occupancy, indicating high desirability and potentially optimized availability.
- Strong performing properties (Top 25%) maintain 68% or higher occupancy, suggesting good market fit and guest satisfaction.
- Typical properties (Median) have an occupancy rate around 49%.
- Entry-level properties (Bottom 25%) average 28% occupancy, potentially facing higher vacancy.
Average Monthly Occupancy Rate Trend in Tralee Municipal District
Average Daily Rate (ADR) Airbnb Trends in Tralee Municipal District (2026)
Effective short term rental pricing strategy in Tralee Municipal District involves understanding monthly ADR fluctuations. The Average Daily Rate (ADR) for Airbnb in Tralee Municipal District typically peaks in September and dips lowest during March. Leveraging Airbnb dynamic pricing tools or strategies based on this seasonality can significantly boost revenue. Here's a look at the typical nightly rates achieved:
- Best-in-class properties (Top 10%) command rates of $306+ per night, often due to premium features or locations.
- Strong performing properties (Top 25%) achieve nightly rates of $223 or more.
- Typical properties (Median) charge around $155 per night.
- Entry-level properties (Bottom 25%) earn around $109 per night.
Average Daily Rate (ADR) Trend by Month in Tralee Municipal District
Get Live Tralee Municipal District Market Intelligence 👇

Explore Real-time Analytics
Airbnb Seasonality Analysis & Trends in Tralee Municipal District (2026)
Peak Season (August, July, September)
- Revenue averages $3,797 per month
- Occupancy rates average 67.2%
- Daily rates average $185
Shoulder Season
- Revenue averages $2,442 per month
- Occupancy maintains around 46.3%
- Daily rates hold near $181
Low Season (January, February, March)
- Revenue drops to average $1,645 per month
- Occupancy decreases to average 34.4%
- Daily rates adjust to average $174
Seasonality Insights for Tralee Municipal District
- The Airbnb seasonality in Tralee Municipal District shows highly seasonal trends requiring careful strategy. While the sections above show seasonal averages, it's also insightful to look at the extremes:
- During the high season, the absolute peak month showcases Tralee Municipal District's highest earning potential, with monthly revenues capable of climbing to $4,375, occupancy reaching a high of 74.3%, and ADRs peaking at $187.
- Conversely, the slowest single month of the year, typically falling within the low season, marks the market's lowest point. In this month, revenue might dip to $1,524, occupancy could drop to 29.8%, and ADRs may adjust down to $170.
- Understanding both the seasonal averages and these monthly peaks and troughs in revenue, occupancy, and ADR is crucial for maximizing your Airbnb profit potential in Tralee Municipal District.
Seasonal Strategies for Maximizing Profit
- Peak Season: Maximize revenue through premium pricing and potentially longer minimum stays. Ensure high availability.
- Low Season: Offer competitive pricing, special promotions (e.g., extended stay discounts), and flexible cancellation policies. Target off-season travelers like remote workers or budget-conscious guests.
- Shoulder Seasons: Implement dynamic pricing that balances peak and low rates. Target weekend travelers or specific events. Offer slightly more flexible terms than peak season.
- Regularly analyze your own performance against these Tralee Municipal District seasonality benchmarks and adjust your pricing and availability strategy accordingly.
Best Areas for Airbnb Investment in Tralee Municipal District (2026)
Exploring the top neighborhoods for short-term rentals in Tralee Municipal District? This section highlights key areas, outlining why they are attractive for hosts and guests, along with notable local attractions. Consider these locations based on your target guest profile and investment strategy.
| Neighborhood / Area | Why Host Here? (Target Guests & Appeal) | Key Attractions & Landmarks |
|---|---|---|
| Tralee Town Centre | The vibrant heart of Tralee with shops, restaurants, and nightlife. Perfect for tourists looking to explore local culture and amenities. | Tralee Bay Wetlands, Tralee Town Park, Kerry County Museum, Siamsa Tíre, Tralee Shipping Canal |
| Banna Strand | A beautiful sandy beach popular for swimming, surfing, and water sports. Attracts families and beachgoers looking for a coastal getaway. | Banna Strand Beach, Water sports activities, Scenic walking trails, Birdwatching opportunities |
| Castlegregory | A picturesque village on the Dingle Peninsula known for its stunning landscapes and outdoor activities. Ideal for nature lovers and hike enthusiasts. | Slieve Mish Mountains, Dingle Peninsula, Beaches and coastal trails, Local pubs and shops |
| Fenit | A charming coastal village with a marina and scenic views. Great for those looking for a tranquil getaway by the sea. | Fenit Lighthouse, Fenit Beach, Marina activities, Gardens and scenic walks |
| Milltown | A quaint village surrounded by scenic countryside, offering a peaceful retreat for those wanting to enjoy rural Ireland. | Local farms, Scenic walking paths, Traditional Irish pubs |
| Listowel | Known for its literary legacy and cultural festivals. Attracts visitors interested in Irish literature and heritage. | Listowel Castle, Listowel Writers' Week, Heritage Centre, Local markets |
| Dingle | Famous for its stunning scenery, marine life, and vibrant arts scene. Highly sought after by tourists for its charm and outdoor activities. | Dingle Peninsula, Blasket Islands, Slea Head Drive, Whale watching, Fungi the Dolphin |
| Killarney National Park | A vast natural park renowned for its beauty and outdoor activities, it attracts tourists looking for adventure and wildlife. | Lakes of Killarney, Muckross House and Gardens, Hiking trails, Cycling paths |
Understanding Airbnb License Requirements & STR Laws in Tralee Municipal District (2026)
While Tralee Municipal District, County Kerry, Ireland currently shows low STR regulations, specific Airbnb license requirements might still exist or change. Always verify the latest short term rental regulations and Airbnb license requirements directly with local government authorities for Tralee Municipal District to ensure full compliance before hosting.
(Source: AirROI data, 2026, finding no licensed listings among those analyzed)
Top Performing Airbnb Properties in Tralee Municipal District (2026)
Benchmark your potential! Explore examples of top-performing Airbnb properties in Tralee Municipal Districtbased on Trailing Twelve Month (TTM) revenue. Analyze their characteristics, revenue, occupancy rate, and ADR to understand what drives success in this market.

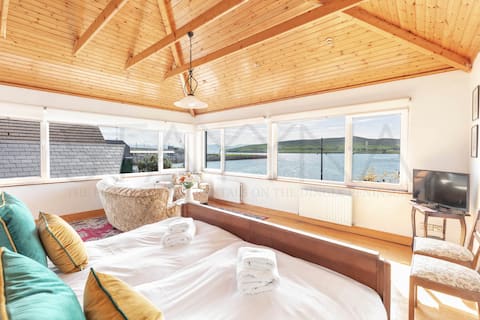
JALAMOOR SEA VIEWS! 5 BED BY THE SEA!
Entire Place • 5 bedrooms

Spacious 5BR Home for Large Groups Near Killarney
Entire Place • 5 bedrooms
Wood Quay - Unbeatable waterside location
Entire Place • 3 bedrooms
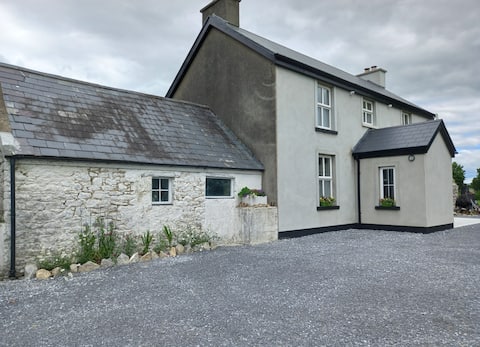
Rowan House
Entire Place • 4 bedrooms

Large Private Country Home with gardens and WIFI
Entire Place • 4 bedrooms

Shanadune
Entire Place • 3 bedrooms
Note: Performance varies based on location, size, amenities, seasonality, and management quality. Data reflects the past 12 months.
Top Performing Airbnb Hosts in Tralee Municipal District (2026)
Learn from the best! This table showcases top-performing Airbnb hosts in Tralee Municipal District based on the number of properties managed and estimated total revenue over the past year. Analyze their scale and performance metrics.
| Host Name | Properties | Grossing Revenue | Stay Reviews | Avg Rating |
|---|---|---|---|---|
| Myra | 5 | $199,876 | 1022 | 4.95/5.0 |
| Lauren | 3 | $184,115 | 135 | 4.77/5.0 |
| Trident Holiday Homes | 4 | $174,671 | 36 | 4.81/5.0 |
| Maurice | 2 | $107,442 | 857 | 4.87/5.0 |
| Roisin | 1 | $77,673 | 90 | 4.96/5.0 |
| Breda | 3 | $75,950 | 179 | 4.84/5.0 |
| Joke | 5 | $69,842 | 52 | 4.96/5.0 |
| Adah | 3 | $61,568 | 1647 | 4.98/5.0 |
| Grace | 3 | $61,543 | 1484 | 4.87/5.0 |
| Paul Philip | 1 | $54,467 | 41 | 4.83/5.0 |
Analyzing the strategies of top hosts, such as their property selection, pricing, and guest communication, can offer valuable lessons for optimizing your own Airbnb operations in Tralee Municipal District.
Dive Deeper: Advanced Tralee Municipal District STR Market Data (2026)
Ready to unlock more insights? AirROI provides access to advanced metrics and comprehensive Airbnb data for Tralee Municipal District. Explore detailed analytics beyond this report to refine your investment strategy, optimize pricing, and maximize your vacation rental profits.
Explore Advanced MetricsTralee Municipal District Short-Term Rental Market Composition (2026): Property & Room Types
Room Type Distribution
Property Type Distribution
Market Composition Insights for Tralee Municipal District
- The Tralee Municipal District Airbnb market composition is heavily skewed towards Entire Home/Apt listings, which make up 78% of the 177 active rentals. This indicates strong guest preference for privacy and space.
- Looking at the property type distribution in Tralee Municipal District, House properties are the most common (77.4%), reflecting the local real estate landscape.
- Houses represent a significant 77.4% portion, catering likely to families or larger groups.
- Smaller segments like hotel/boutique, others, outdoor/unique, unique stays (combined 10.7%) offer potential for unique stay experiences.
Tralee Municipal District Airbnb Room Capacity Analysis (2026): Bedroom Distribution
Distribution of Listings by Number of Bedrooms
Room Capacity Insights for Tralee Municipal District
- The dominant room capacity in Tralee Municipal District is 1 bedroom listings, making up 24.3% of the market. This suggests a strong demand for properties suitable for couples or solo travelers.
- Together, 1 bedroom and 3 bedrooms properties represent 45.8% of the active Airbnb listings in Tralee Municipal District, indicating a high concentration in these sizes.
- A significant 42.4% of listings offer 3+ bedrooms, catering to larger groups and families seeking more space in Tralee Municipal District.
Tralee Municipal District Vacation Rental Guest Capacity Trends (2026)
Distribution of Listings by Guest Capacity
Guest Capacity Insights for Tralee Municipal District
- The most common guest capacity trend in Tralee Municipal District vacation rentals is listings accommodating 2 guests (17.5%). This suggests the primary traveler segment is likely couples or solo travelers.
- Properties designed for 2 guests and 4 guests dominate the Tralee Municipal District STR market, accounting for 33.3% of listings.
- 37.3% of properties accommodate 6+ guests, serving the market segment for larger families or group travel in Tralee Municipal District.
- On average, properties in Tralee Municipal District are equipped to host 4.0 guests.
Tralee Municipal District Airbnb Booking Patterns (2026): Available vs. Booked Days
Available Days Distribution
Booked Days Distribution
Booking Pattern Insights for Tralee Municipal District
- The most common availability pattern in Tralee Municipal District falls within the 181-270 days range, representing 42.4% of listings. This suggests many properties have significant open periods on their calendars.
- Approximately 67.8% of listings show high availability (181+ days open annually), indicating potential for increased bookings or specific owner usage patterns.
- For booked days, the 91-180 days range is most frequent in Tralee Municipal District (42.4%), reflecting common guest stay durations or potential owner blocking patterns.
- A notable 32.8% of properties secure long booking periods (181+ days booked per year), highlighting successful long-term rental strategies or significant owner usage.
Tralee Municipal District Airbnb Minimum Stay Requirements Analysis
Distribution of Listings by Minimum Night Requirement
1 Night
59 listings
33.3% of total
2 Nights
31 listings
17.5% of total
3 Nights
14 listings
7.9% of total
4-6 Nights
8 listings
4.5% of total
7-29 Nights
3 listings
1.7% of total
30+ Nights
62 listings
35% of total
Key Insights
- The most prevalent minimum stay requirement in Tralee Municipal District is 30+ Nights, adopted by 35% of listings. This highlights the market's preference for longer commitments.
- A significant segment (35%) caters to monthly stays (30+ nights) in Tralee Municipal District, pointing to opportunities in the extended-stay market.
Recommendations
- Align with the market by considering a 30+ Nights minimum stay, as 35% of Tralee Municipal District hosts use this setting.
- Explore offering discounts for stays of 30+ nights to attract the 35% of the market seeking extended stays.
- Adjust minimum nights based on seasonality – potentially shorter during low season and longer during peak demand periods in Tralee Municipal District.
Tralee Municipal District Airbnb Cancellation Policy Trends Analysis (2026)
Super Strict 60 Days
5 listings
2.8% of total
Limited
1 listings
0.6% of total
Flexible
58 listings
32.8% of total
Moderate
54 listings
30.5% of total
Firm
43 listings
24.3% of total
Strict
16 listings
9% of total
Cancellation Policy Insights for Tralee Municipal District
- The prevailing Airbnb cancellation policy trend in Tralee Municipal District is Flexible, used by 32.8% of listings.
- There's a relatively balanced mix between guest-friendly (63.3%) and stricter (33.3%) policies, offering choices for different guest needs.
- Strict cancellation policies are quite rare (9%), potentially making listings with this policy less competitive unless justified by high demand or property type.
Recommendations for Hosts
- Consider adopting a Flexible policy to align with the 32.8% market standard in Tralee Municipal District.
- Using a Strict policy might deter some guests, as only 9% of listings use it. Evaluate if potential revenue protection outweighs possible lower booking rates.
- Regularly review your cancellation policy against competitors and market demand shifts in Tralee Municipal District.
Tralee Municipal District STR Booking Lead Time Analysis (2026)
Average Booking Lead Time by Month
Booking Lead Time Insights for Tralee Municipal District
- The overall average booking lead time for vacation rentals in Tralee Municipal District is 68 days.
- Guests book furthest in advance for stays during August (average 92 days), likely coinciding with peak travel demand or local events.
- The shortest booking windows occur for stays in February (average 30 days), indicating more last-minute travel plans during this time.
- Seasonally, Summer (81 days avg.) sees the longest lead times, while Winter (47 days avg.) has the shortest, reflecting typical travel planning cycles.
Recommendations for Hosts
- Use the overall average lead time (68 days) as a baseline for your pricing and availability strategy in Tralee Municipal District.
- For August stays, consider implementing length-of-stay discounts or slightly higher rates for bookings made less than 92 days out to capitalize on advance planning.
- Target marketing efforts for the Summer season well in advance (at least 81 days) to capture early planners.
- Monitor your own booking lead times against these Tralee Municipal District averages to identify opportunities for dynamic pricing adjustments.
Popular & Essential Airbnb Amenities in Tralee Municipal District (2026)
Amenity Prevalence
Amenity Insights for Tralee Municipal District
- Essential amenities in Tralee Municipal District that guests expect include: Smoke alarm, Wifi. Lacking these (any) could significantly impact bookings.
- Popular amenities like Heating, Free parking on premises, Hot water are common but not universal. Offering these can provide a competitive edge.
Recommendations for Hosts
- Ensure your listing includes all essential amenities for Tralee Municipal District: Smoke alarm, Wifi.
- Prioritize adding missing essentials: Smoke alarm, Wifi.
- Consider adding popular differentiators like Heating or Free parking on premises to increase appeal.
- Highlight unique or less common amenities you offer (e.g., hot tub, dedicated workspace, EV charger) in your listing description and photos.
- Regularly check competitor amenities in Tralee Municipal District to stay competitive.
Tralee Municipal District Airbnb Guest Demographics & Profile Analysis (2026)
Guest Profile Summary for Tralee Municipal District
- The typical guest profile for Airbnb in Tralee Municipal District consists of predominantly international visitors (74%), with top international origins including United States, typically belonging to the Post-2000s (Gen Z/Alpha) group (50%), primarily speaking English or French.
- Domestic travelers account for 25.6% of guests.
- Key international markets include Ireland (25.6%) and United States (22.2%).
- Top languages spoken are English (53.9%) followed by French (10%).
- A significant demographic segment is the Post-2000s (Gen Z/Alpha) group, representing 50% of guests.
Recommendations for Hosts
- Focus marketing internationally, particularly towards travelers from United States.
- Tailor amenities and listing descriptions to appeal to the dominant Post-2000s (Gen Z/Alpha) demographic (e.g., highlight fast WiFi, smart home features, local guides).
- Highlight unique local experiences or amenities relevant to the primary guest profile.
- Consider seasonal promotions aligned with peak travel times for key origin markets.
Nearby Short-Term Rental Market Comparison
How does the Tralee Municipal District Airbnb market stack up against its neighbors? Compare key performance metrics like average monthly revenue, ADR, and occupancy rates in surrounding areas to understand the broader regional STR landscape.
| Market | Active Properties | Monthly Revenue | Daily Rate | Avg. Occupancy |
|---|---|---|---|---|
| Liscannor | 10 | $3,890 | $336.22 | 38% |
| The Municipal District of Adare — Rathkeale | 84 | $3,405 | $281.64 | 45% |
| Galway | 827 | $3,386 | $258.99 | 54% |
| Dingle | 24 | $3,325 | $330.71 | 45% |
| Killarney Municipal District | 451 | $3,183 | $257.51 | 52% |
| Municipal District of Carrigaline | 74 | $3,118 | $287.39 | 50% |
| The Municipal District of Bandon-Kinsale | 259 | $3,062 | $252.54 | 50% |
| Municipal District of Cobh | 81 | $2,911 | $207.22 | 53% |
| Roundstone | 11 | $2,872 | $321.33 | 42% |
| The Municipal District of Newcastle West | 38 | $2,528 | $282.76 | 42% |