Tallaght Airbnb Market Analysis 2026: Short Term Rental Data & Vacation Rental Statistics in County Dublin, Ireland
Is Airbnb profitable in Tallaght in 2026? Explore comprehensive Airbnb analytics for Tallaght, County Dublin, Ireland to uncover income potential. This 2026 STR market report for Tallaght, based on AirROI data from February 2025 to January 2026, reveals key trends in the niche market of 37 active listings.
Whether you're considering an Airbnb investment in Tallaght, optimizing your existing vacation rental, or exploring rental arbitrage opportunities, understanding the Tallaght Airbnb data is crucial. Leveraging the low regulation environment is key to maximizing your short term rental income potential. Let's dive into the specifics.
Key Tallaght Airbnb Performance Metrics Overview
Monthly Airbnb Revenue Variations & Income Potential in Tallaght (2026)
Understanding the monthly revenue variations for Airbnb listings in Tallaght is key to maximizing your short term rental income potential. Seasonality significantly impacts earnings. Our analysis, based on data from the past 12 months, shows that the peak revenue month for STRs in Tallaght is typically September, while January often presents the lowest earnings, highlighting opportunities for strategic pricing adjustments during shoulder and low seasons. Explore the typical Airbnb income in Tallaght across different performance tiers:
- Best-in-class properties (Top 10%) achieve $3,924+ monthly, often utilizing dynamic pricing and superior guest experiences.
- Strong performing properties (Top 25%) earn $2,087 or more, indicating effective management and desirable locations/amenities.
- Typical properties (Median) generate around $1,134 per month, representing the average market performance.
- Entry-level properties (Bottom 25%) see earnings around $503, often with potential for optimization.
Average Monthly Airbnb Earnings Trend in Tallaght
Tallaght Airbnb Occupancy Rate Trends (2026)
Maximize your bookings by understanding the Tallaght STR occupancy trends. Seasonal demand shifts significantly influence how often properties are booked. Typically, Septembersees the highest demand (peak season occupancy), while February experiences the lowest (low season). Effective strategies, like adjusting minimum stays or offering promotions, can boost occupancy during slower periods. Here's how different property tiers perform in Tallaght:
- Best-in-class properties (Top 10%) achieve 83%+ occupancy, indicating high desirability and potentially optimized availability.
- Strong performing properties (Top 25%) maintain 62% or higher occupancy, suggesting good market fit and guest satisfaction.
- Typical properties (Median) have an occupancy rate around 36%.
- Entry-level properties (Bottom 25%) average 17% occupancy, potentially facing higher vacancy.
Average Monthly Occupancy Rate Trend in Tallaght
Average Daily Rate (ADR) Airbnb Trends in Tallaght (2026)
Effective short term rental pricing strategy in Tallaght involves understanding monthly ADR fluctuations. The Average Daily Rate (ADR) for Airbnb in Tallaght typically peaks in December and dips lowest during February. Leveraging Airbnb dynamic pricing tools or strategies based on this seasonality can significantly boost revenue. Here's a look at the typical nightly rates achieved:
- Best-in-class properties (Top 10%) command rates of $206+ per night, often due to premium features or locations.
- Strong performing properties (Top 25%) achieve nightly rates of $149 or more.
- Typical properties (Median) charge around $98 per night.
- Entry-level properties (Bottom 25%) earn around $73 per night.
Average Daily Rate (ADR) Trend by Month in Tallaght
Get Live Tallaght Market Intelligence 👇

Explore Real-time Analytics
Airbnb Seasonality Analysis & Trends in Tallaght (2026)
Peak Season (September, October, May)
- Revenue averages $2,008 per month
- Occupancy rates average 48.9%
- Daily rates average $119
Shoulder Season
- Revenue averages $1,672 per month
- Occupancy maintains around 43.4%
- Daily rates hold near $114
Low Season (January, February, December)
- Revenue drops to average $1,014 per month
- Occupancy decreases to average 30.3%
- Daily rates adjust to average $118
Seasonality Insights for Tallaght
- The Airbnb seasonality in Tallaght shows highly seasonal trends requiring careful strategy. While the sections above show seasonal averages, it's also insightful to look at the extremes:
- During the high season, the absolute peak month showcases Tallaght's highest earning potential, with monthly revenues capable of climbing to $2,069, occupancy reaching a high of 55.1%, and ADRs peaking at $125.
- Conversely, the slowest single month of the year, typically falling within the low season, marks the market's lowest point. In this month, revenue might dip to $934, occupancy could drop to 29.8%, and ADRs may adjust down to $107.
- Understanding both the seasonal averages and these monthly peaks and troughs in revenue, occupancy, and ADR is crucial for maximizing your Airbnb profit potential in Tallaght.
Seasonal Strategies for Maximizing Profit
- Peak Season: Maximize revenue through premium pricing and potentially longer minimum stays. Ensure high availability.
- Low Season: Offer competitive pricing, special promotions (e.g., extended stay discounts), and flexible cancellation policies. Target off-season travelers like remote workers or budget-conscious guests.
- Shoulder Seasons: Implement dynamic pricing that balances peak and low rates. Target weekend travelers or specific events. Offer slightly more flexible terms than peak season.
- Regularly analyze your own performance against these Tallaght seasonality benchmarks and adjust your pricing and availability strategy accordingly.
Best Areas for Airbnb Investment in Tallaght (2026)
Exploring the top neighborhoods for short-term rentals in Tallaght? This section highlights key areas, outlining why they are attractive for hosts and guests, along with notable local attractions. Consider these locations based on your target guest profile and investment strategy.
| Neighborhood / Area | Why Host Here? (Target Guests & Appeal) | Key Attractions & Landmarks |
|---|---|---|
| Tallaght Village | The cultural heart of Tallaght, offering a vibrant community atmosphere with easy access to shopping, dining, and local events. Popular among young travelers and families. | Tallaght Stadium, The Square Tallaght, St. Maelruain's Church, Local markets, Community events |
| The Spawell | An entertainment hub featuring sports facilities, a cinema, and restaurants. Attractive for fun-seeking visitors and groups. | The Spawell Complex, Bowling, Cinemas, Arcade, Dining options |
| Knockmore | A residential area with good transport links, making it convenient for those commuting to Dublin city for work or leisure. | Nearby parks, Public transport access, Local shops, Community amenities |
| Oldbawn | Family-oriented area with quiet neighborhoods and parks, ideal for longer stays by families or those seeking a peaceful retreat. | Oldbawn Community Centre, Parks, Schools, Family-friendly events |
| Belgard | A rapidly developing area with a mix of modern housing and amenities. Attracts both families and young professionals. | Belgard Square, Local eateries, Transport links, Community activities |
| Fortunestown | Upcoming area with new developments and a community feel, providing a blend of suburban living and access to nature. | Walking trails, Local parks, Community centers |
| Tallaght Hospital Area | Proximity to one of Ireland's largest hospitals makes it ideal for medical professionals or visitors seeking short stays. | Tallaght Hospital, Healthcare facilities, Good transport options |
| Killinarden | Affordability and access to green spaces make this area appealing to budget travelers and nature enthusiasts. | Killinarden Park, Local shops, Cultural sites |
Understanding Airbnb License Requirements & STR Laws in Tallaght (2026)
While Tallaght, County Dublin, Ireland currently shows low STR regulations, specific Airbnb license requirements might still exist or change. Always verify the latest short term rental regulations and Airbnb license requirements directly with local government authorities for Tallaght to ensure full compliance before hosting.
(Source: AirROI data, 2026, finding no licensed listings among those analyzed)
Top Performing Airbnb Properties in Tallaght (2026)
Benchmark your potential! Explore examples of top-performing Airbnb properties in Tallaghtbased on Trailing Twelve Month (TTM) revenue. Analyze their characteristics, revenue, occupancy rate, and ADR to understand what drives success in this market.

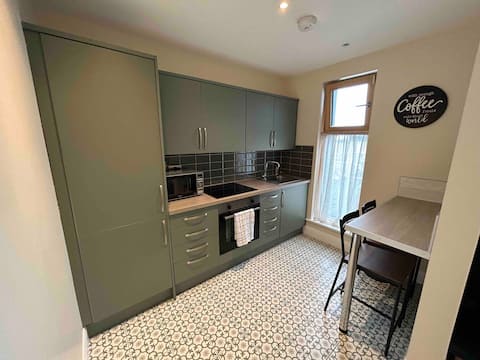
2 Bedroom apartment
Entire Place • 2 bedrooms
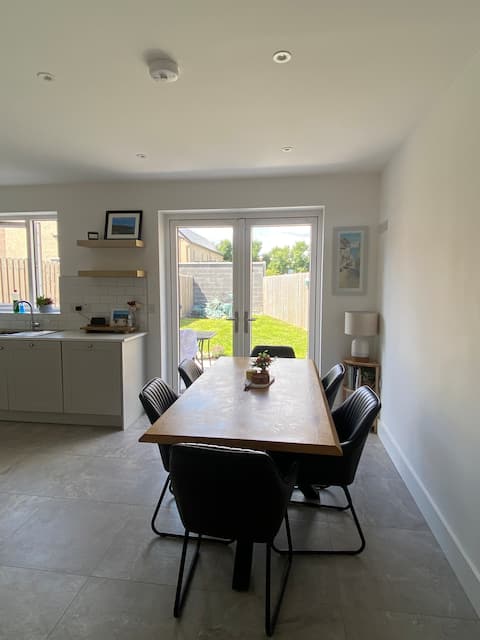
2 bedroom ; Family friendly ; Private gardens 5pax
Entire Place • 2 bedrooms
Spacious 2 bedroom house with garden
Entire Place • 2 bedrooms
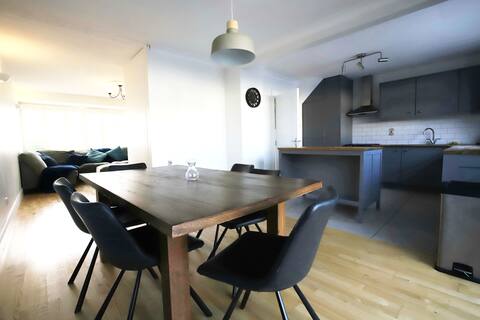
Spacious 4 bedroom home with Parking+ City access
Entire Place • 4 bedrooms
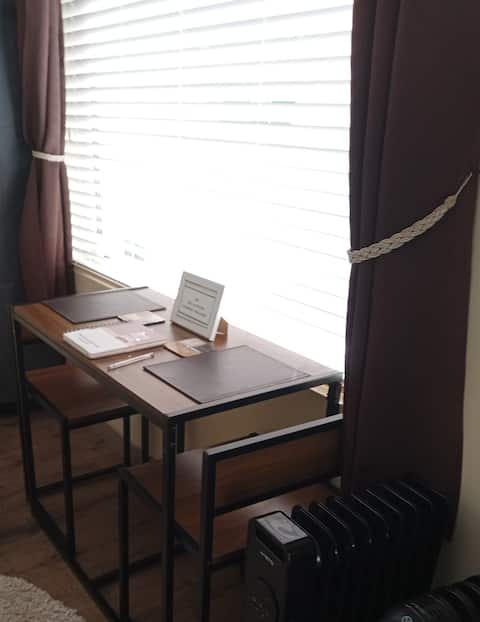
Adorable studio accommodation, beautiful location.
Entire Place • N/A

Two private rooms (4 adults) in Kilnamanagh
Private Room • 2 bedrooms
Note: Performance varies based on location, size, amenities, seasonality, and management quality. Data reflects the past 12 months.
Top Performing Airbnb Hosts in Tallaght (2026)
Learn from the best! This table showcases top-performing Airbnb hosts in Tallaght based on the number of properties managed and estimated total revenue over the past year. Analyze their scale and performance metrics.
| Host Name | Properties | Grossing Revenue | Stay Reviews | Avg Rating |
|---|---|---|---|---|
| Donal | 2 | $69,515 | 61 | 4.80/5.0 |
| Amy | 1 | $58,633 | 28 | 4.75/5.0 |
| Fiona | 4 | $54,573 | 83 | 4.54/5.0 |
| Aisling | 1 | $47,621 | 14 | 4.86/5.0 |
| Anna | 2 | $35,729 | 12 | 4.50/5.0 |
| David | 2 | $26,220 | 100 | 4.82/5.0 |
| Karl | 1 | $26,018 | 151 | 4.79/5.0 |
| Gordon | 1 | $23,408 | 8 | 4.88/5.0 |
| Patrick | 3 | $21,778 | 5 | 5.00/5.0 |
| Kevin | 1 | $18,528 | 181 | 4.93/5.0 |
Analyzing the strategies of top hosts, such as their property selection, pricing, and guest communication, can offer valuable lessons for optimizing your own Airbnb operations in Tallaght.
Dive Deeper: Advanced Tallaght STR Market Data (2026)
Ready to unlock more insights? AirROI provides access to advanced metrics and comprehensive Airbnb data for Tallaght. Explore detailed analytics beyond this report to refine your investment strategy, optimize pricing, and maximize your vacation rental profits.
Explore Advanced MetricsTallaght Short-Term Rental Market Composition (2026): Property & Room Types
Room Type Distribution
Property Type Distribution
Market Composition Insights for Tallaght
- The Tallaght Airbnb market composition is heavily skewed towards Private Room listings, which make up 75.7% of the 37 active rentals. This indicates strong guest preference for privacy and space.
- Looking at the property type distribution in Tallaght, House properties are the most common (73%), reflecting the local real estate landscape.
- Houses represent a significant 73% portion, catering likely to families or larger groups.
- The presence of 13.5% Hotel/Boutique listings indicates integration with traditional hospitality.
- Smaller segments like outdoor/unique (combined 2.7%) offer potential for unique stay experiences.
Tallaght Airbnb Room Capacity Analysis (2026): Bedroom Distribution
Distribution of Listings by Number of Bedrooms
Room Capacity Insights for Tallaght
- The dominant room capacity in Tallaght is 2 bedrooms listings, making up 18.9% of the market. This suggests a strong demand for properties suitable for couples or solo travelers.
- Together, 2 bedrooms and 1 bedroom properties represent 32.4% of the active Airbnb listings in Tallaght, indicating a high concentration in these sizes.
- Listings with 3+ bedrooms (5.4%) represent a smaller niche, potentially indicating an underserved market for larger group accommodations in Tallaght.
Tallaght Vacation Rental Guest Capacity Trends (2026)
Distribution of Listings by Guest Capacity
Guest Capacity Insights for Tallaght
- The most common guest capacity trend in Tallaght vacation rentals is listings accommodating 2 guests (13.5%). This suggests the primary traveler segment is likely couples or solo travelers.
- Properties designed for 2 guests and 4 guests dominate the Tallaght STR market, accounting for 21.6% of listings.
- Listings for large groups (6+ guests) are relatively rare (2.7%), potentially indicating an opportunity for hosts targeting this segment in Tallaght.
- On average, properties in Tallaght are equipped to host 1.1 guests.
Tallaght Airbnb Booking Patterns (2026): Available vs. Booked Days
Available Days Distribution
Booked Days Distribution
Booking Pattern Insights for Tallaght
- The most common availability pattern in Tallaght falls within the 271-366 days range, representing 48.6% of listings. This suggests many properties have significant open periods on their calendars.
- Approximately 83.7% of listings show high availability (181+ days open annually), indicating potential for increased bookings or specific owner usage patterns.
- For booked days, the 31-90 days range is most frequent in Tallaght (32.4%), reflecting common guest stay durations or potential owner blocking patterns.
- A notable 18.9% of properties secure long booking periods (181+ days booked per year), highlighting successful long-term rental strategies or significant owner usage.
Tallaght Airbnb Minimum Stay Requirements Analysis
Distribution of Listings by Minimum Night Requirement
1 Night
17 listings
45.9% of total
2 Nights
2 listings
5.4% of total
3 Nights
2 listings
5.4% of total
4-6 Nights
4 listings
10.8% of total
7-29 Nights
4 listings
10.8% of total
30+ Nights
8 listings
21.6% of total
Key Insights
- The most prevalent minimum stay requirement in Tallaght is 1 Night, adopted by 45.9% of listings. This highlights the market's preference for shorter, flexible bookings.
- A significant segment (21.6%) caters to monthly stays (30+ nights) in Tallaght, pointing to opportunities in the extended-stay market.
Recommendations
- Align with the market by considering a 1 Night minimum stay, as 45.9% of Tallaght hosts use this setting.
- Explore offering discounts for stays of 30+ nights to attract the 21.6% of the market seeking extended stays.
- Adjust minimum nights based on seasonality – potentially shorter during low season and longer during peak demand periods in Tallaght.
Tallaght Airbnb Cancellation Policy Trends Analysis (2026)
Flexible
11 listings
29.7% of total
Moderate
10 listings
27% of total
Firm
10 listings
27% of total
Strict
6 listings
16.2% of total
Cancellation Policy Insights for Tallaght
- The prevailing Airbnb cancellation policy trend in Tallaght is Flexible, used by 29.7% of listings.
- There's a relatively balanced mix between guest-friendly (56.7%) and stricter (43.2%) policies, offering choices for different guest needs.
Recommendations for Hosts
- Consider adopting a Flexible policy to align with the 29.7% market standard in Tallaght.
- Regularly review your cancellation policy against competitors and market demand shifts in Tallaght.
Tallaght STR Booking Lead Time Analysis (2026)
Average Booking Lead Time by Month
Booking Lead Time Insights for Tallaght
- The overall average booking lead time for vacation rentals in Tallaght is 43 days.
- Guests book furthest in advance for stays during August (average 90 days), likely coinciding with peak travel demand or local events.
- The shortest booking windows occur for stays in November (average 25 days), indicating more last-minute travel plans during this time.
- Seasonally, Summer (69 days avg.) sees the longest lead times, while Winter (39 days avg.) has the shortest, reflecting typical travel planning cycles.
Recommendations for Hosts
- Use the overall average lead time (43 days) as a baseline for your pricing and availability strategy in Tallaght.
- For August stays, consider implementing length-of-stay discounts or slightly higher rates for bookings made less than 90 days out to capitalize on advance planning.
- Target marketing efforts for the Summer season well in advance (at least 69 days) to capture early planners.
- Monitor your own booking lead times against these Tallaght averages to identify opportunities for dynamic pricing adjustments.
Popular & Essential Airbnb Amenities in Tallaght (2026)
Amenity Prevalence
Amenity Insights for Tallaght
- Essential amenities in Tallaght that guests expect include: Wifi. Lacking these (this) could significantly impact bookings.
- Popular amenities like Smoke alarm, Free parking on premises, Essentials are common but not universal. Offering these can provide a competitive edge.
Recommendations for Hosts
- Ensure your listing includes all essential amenities for Tallaght: Wifi.
- Prioritize adding missing essentials: Wifi.
- Consider adding popular differentiators like Smoke alarm or Free parking on premises to increase appeal.
- Highlight unique or less common amenities you offer (e.g., hot tub, dedicated workspace, EV charger) in your listing description and photos.
- Regularly check competitor amenities in Tallaght to stay competitive.
Tallaght Airbnb Guest Demographics & Profile Analysis (2026)
Guest Profile Summary for Tallaght
- The typical guest profile for Airbnb in Tallaght consists of predominantly international visitors (77%), with top international origins including United Kingdom, typically belonging to the Post-2000s (Gen Z/Alpha) group (50%), primarily speaking English or German.
- Domestic travelers account for 23.4% of guests.
- Key international markets include Ireland (23.4%) and United Kingdom (16.2%).
- Top languages spoken are English (45.1%) followed by German (9.8%).
- A significant demographic segment is the Post-2000s (Gen Z/Alpha) group, representing 50% of guests.
Recommendations for Hosts
- Focus marketing internationally, particularly towards travelers from United Kingdom.
- Tailor amenities and listing descriptions to appeal to the dominant Post-2000s (Gen Z/Alpha) demographic (e.g., highlight fast WiFi, smart home features, local guides).
- Highlight unique local experiences or amenities relevant to the primary guest profile.
- Consider seasonal promotions aligned with peak travel times for key origin markets.
Nearby Short-Term Rental Market Comparison
How does the Tallaght Airbnb market stack up against its neighbors? Compare key performance metrics like average monthly revenue, ADR, and occupancy rates in surrounding areas to understand the broader regional STR landscape.
| Market | Active Properties | Monthly Revenue | Daily Rate | Avg. Occupancy |
|---|---|---|---|---|
| Irvinestown | 10 | $4,091 | $352.70 | 41% |
| Dublin 2 | 15 | $3,771 | $317.51 | 54% |
| Kilcoo | 10 | $3,520 | $216.82 | 54% |
| Howth | 38 | $3,401 | $371.91 | 45% |
| Dalkey | 19 | $3,311 | $358.14 | 52% |
| Mullartown | 15 | $3,219 | $395.00 | 33% |
| The Municipal District of Kilkenny City | 65 | $3,209 | $260.55 | 54% |
| The Municipal District of Ratoath | 36 | $3,171 | $234.93 | 47% |
| Sutton | 10 | $3,087 | $247.21 | 58% |
| Killiney | 13 | $3,077 | $378.20 | 40% |