Shankill Airbnb Market Analysis 2025: Short Term Rental Data & Vacation Rental Statistics in County Dublin, Ireland
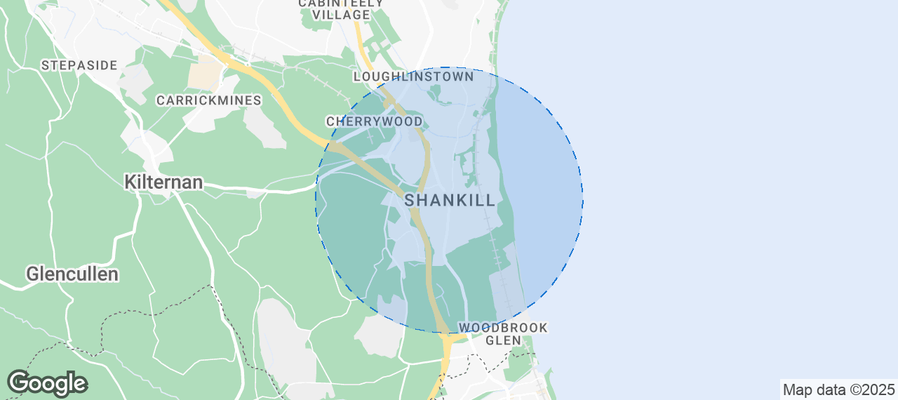
Is Airbnb profitable in Shankill in 2025? Explore comprehensive Airbnb analytics for Shankill, County Dublin, Ireland to uncover income potential. This 2025 STR market report for Shankill, based on AirROI data from November 2024 to October 2025, reveals key trends in the niche market of 20 active listings.
Whether you're considering an Airbnb investment in Shankill, optimizing your existing vacation rental, or exploring rental arbitrage opportunities, understanding the Shankill Airbnb data is crucial. Leveraging the low regulation environment is key to maximizing your short term rental income potential. Let's dive into the specifics.
Key Shankill Airbnb Performance Metrics Overview
Monthly Airbnb Revenue Variations & Income Potential in Shankill (2025)
Understanding the monthly revenue variations for Airbnb listings in Shankill is key to maximizing your short term rental income potential. Seasonality significantly impacts earnings. Our analysis, based on data from the past 12 months, shows that the peak revenue month for STRs in Shankill is typically September, while November often presents the lowest earnings, highlighting opportunities for strategic pricing adjustments during shoulder and low seasons. Explore the typical Airbnb income in Shankill across different performance tiers:
- Best-in-class properties (Top 10%) achieve $7,276+ monthly, often utilizing dynamic pricing and superior guest experiences.
- Strong performing properties (Top 25%) earn $4,234 or more, indicating effective management and desirable locations/amenities.
- Typical properties (Median) generate around $1,853 per month, representing the average market performance.
- Entry-level properties (Bottom 25%) see earnings around $1,090, often with potential for optimization.
Average Monthly Airbnb Earnings Trend in Shankill
Shankill Airbnb Occupancy Rate Trends (2025)
Maximize your bookings by understanding the Shankill STR occupancy trends. Seasonal demand shifts significantly influence how often properties are booked. Typically, Septembersees the highest demand (peak season occupancy), while November experiences the lowest (low season). Effective strategies, like adjusting minimum stays or offering promotions, can boost occupancy during slower periods. Here's how different property tiers perform in Shankill:
- Best-in-class properties (Top 10%) achieve 82%+ occupancy, indicating high desirability and potentially optimized availability.
- Strong performing properties (Top 25%) maintain 67% or higher occupancy, suggesting good market fit and guest satisfaction.
- Typical properties (Median) have an occupancy rate around 42%.
- Entry-level properties (Bottom 25%) average 26% occupancy, potentially facing higher vacancy.
Average Monthly Occupancy Rate Trend in Shankill
Average Daily Rate (ADR) Airbnb Trends in Shankill (2025)
Effective short term rental pricing strategy in Shankill involves understanding monthly ADR fluctuations. The Average Daily Rate (ADR) for Airbnb in Shankill typically peaks in July and dips lowest during February. Leveraging Airbnb dynamic pricing tools or strategies based on this seasonality can significantly boost revenue. Here's a look at the typical nightly rates achieved:
- Best-in-class properties (Top 10%) command rates of $380+ per night, often due to premium features or locations.
- Strong performing properties (Top 25%) achieve nightly rates of $249 or more.
- Typical properties (Median) charge around $179 per night.
- Entry-level properties (Bottom 25%) earn around $108 per night.
Average Daily Rate (ADR) Trend by Month in Shankill
Get Live Shankill Market Intelligence 👇
Explore Real-time Analytics
Airbnb Seasonality Analysis & Trends in Shankill (2025)
Peak Season (September, July, June)
- Revenue averages $3,992 per month
- Occupancy rates average 59.1%
- Daily rates average $223
Shoulder Season
- Revenue averages $2,888 per month
- Occupancy maintains around 47.9%
- Daily rates hold near $196
Low Season (February, November, December)
- Revenue drops to average $1,661 per month
- Occupancy decreases to average 30.8%
- Daily rates adjust to average $182
Seasonality Insights for Shankill
- The Airbnb seasonality in Shankill shows highly seasonal trends requiring careful strategy. While the sections above show seasonal averages, it's also insightful to look at the extremes:
- During the high season, the absolute peak month showcases Shankill's highest earning potential, with monthly revenues capable of climbing to $4,083, occupancy reaching a high of 68.1%, and ADRs peaking at $227.
- Conversely, the slowest single month of the year, typically falling within the low season, marks the market's lowest point. In this month, revenue might dip to $1,505, occupancy could drop to 25.5%, and ADRs may adjust down to $176.
- Understanding both the seasonal averages and these monthly peaks and troughs in revenue, occupancy, and ADR is crucial for maximizing your Airbnb profit potential in Shankill.
Seasonal Strategies for Maximizing Profit
- Peak Season: Maximize revenue through premium pricing and potentially longer minimum stays. Ensure high availability.
- Low Season: Offer competitive pricing, special promotions (e.g., extended stay discounts), and flexible cancellation policies. Target off-season travelers like remote workers or budget-conscious guests.
- Shoulder Seasons: Implement dynamic pricing that balances peak and low rates. Target weekend travelers or specific events. Offer slightly more flexible terms than peak season.
- Regularly analyze your own performance against these Shankill seasonality benchmarks and adjust your pricing and availability strategy accordingly.
Best Areas for Airbnb Investment in Shankill (2025)
Exploring the top neighborhoods for short-term rentals in Shankill? This section highlights key areas, outlining why they are attractive for hosts and guests, along with notable local attractions. Consider these locations based on your target guest profile and investment strategy.
| Neighborhood / Area | Why Host Here? (Target Guests & Appeal) | Key Attractions & Landmarks |
|---|---|---|
| Seafront | Scenic coastal area with beautiful views of the sea and easy access to recreational activities. Popular with families and tourists who enjoy a beachside atmosphere. | Shankill Beach, Shanganagh Park, Dublin Bay, Seapoint, Shankill Castle |
| Shankill Village | Charming village atmosphere with local shops, cafes, and a strong sense of community. Attracts guests looking for a cozy stay with local character. | St. Anne's Church, Shankill Shopping Centre, local pubs and restaurants, farmers market, Shankill Heritage Centre |
| Killiney Hill | Idyllic setting with expansive views over Dublin Bay and lush greenery. Great for walkers and those seeking tranquility, making it appealing to nature lovers. | Killiney Hill Park, Killiney Beach, Baily Lighthouse, Dalkey Island, local hiking trails |
| Bray Head | Picturesque headland offering stunning coastal treks and outdoor activities. A hit for adventure tourists and those seeking breathtaking views. | Bray Head Cliff Walk, Bray Seafront, Bray Head, Kilruddery House and Gardens, local seafood restaurants |
| Dalkey | Historical coastal village known for its rich heritage and vibrant dining scene. Attractive for visitors interested in culture and fine dining. | Dalkey Castle, Coliemore Harbour, Dalkey Island boat trips, restaurants and cafes, Ballyboughal Castle |
| Dun Laoghaire | Bustling coastal town with a marina, pier, and plenty of shops and eateries. Appeals to guests looking for an active seaside experience. | Dun Laoghaire Harbour, People's Park, Royal Marine Hotel, local galleries and shops, Ferris Wheel |
| Loughlinstown | Quieter area offering a mix of suburban and rural charm, suitable for families and those seeking peace yet close to Dublin's amenities. | Loughlinstown Park, local playgrounds, Heritage sites, easy access to bus routes, community events |
| Ballybrack | Residential area with friendly locals and plenty of amenities. Great for guests looking for a warm local experience and convenience. | local parks, shopping facilities, Ballybrack Community Centre, nearby coastal walks |
Understanding Airbnb License Requirements & STR Laws in Shankill (2025)
While Shankill, County Dublin, Ireland currently shows low STR regulations, specific Airbnb license requirements might still exist or change. Always verify the latest short term rental regulations and Airbnb license requirements directly with local government authorities for Shankill to ensure full compliance before hosting.
(Source: AirROI data, 2025, finding no licensed listings among those analyzed)
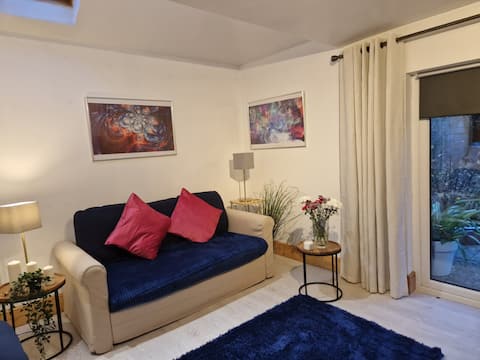
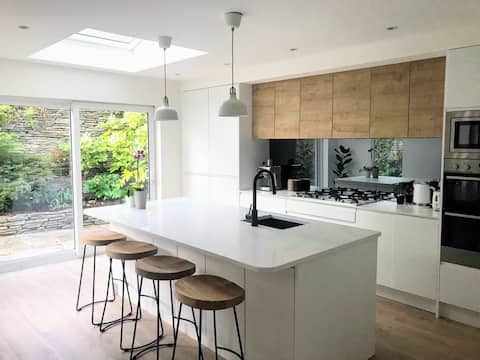
Top Performing Airbnb Properties in Shankill (2025)
Benchmark your potential! Explore examples of top-performing Airbnb properties in Shankillbased on Trailing Twelve Month (TTM) revenue. Analyze their characteristics, revenue, occupancy rate, and ADR to understand what drives success in this market.

The Nook County Dublin
Entire Place • 3 bedrooms

Elegantly Refurbed 2BD in Shankill - 3km from Bray
Entire Place • 2 bedrooms
South Dublin Close to Dart train Station and Sea.
Entire Place • 1 bedroom

Calm well designed apartment with gorgeous patio
Entire Place • 1 bedroom
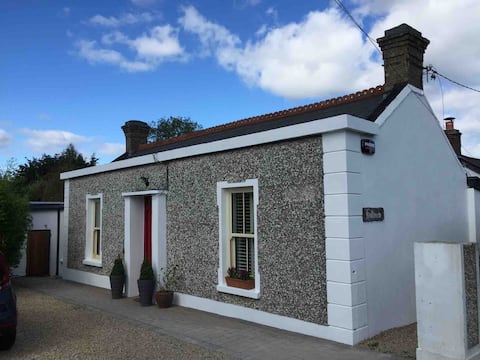
Lovely cottage in Shankill Village
Private Room • N/A
Detached modern family home
Entire Place • 4 bedrooms
Note: Performance varies based on location, size, amenities, seasonality, and management quality. Data reflects the past 12 months.
Top Performing Airbnb Hosts in Shankill (2025)
Learn from the best! This table showcases top-performing Airbnb hosts in Shankill based on the number of properties managed and estimated total revenue over the past year. Analyze their scale and performance metrics.
| Host Name | Properties | Grossing Revenue | Stay Reviews | Avg Rating |
|---|---|---|---|---|
| Daniel | 1 | $88,889 | 242 | 4.84/5.0 |
| James | 1 | $68,595 | 42 | 4.81/5.0 |
| Angela | 1 | $29,996 | 112 | 4.98/5.0 |
| Eva | 1 | $17,518 | 26 | 5.00/5.0 |
| Ian | 5 | $17,507 | 17 | 4.73/5.0 |
| Graham | 1 | $17,069 | 235 | 4.97/5.0 |
| Vicky | 1 | $13,427 | 4 | 5.00/5.0 |
| Berna | 4 | $12,399 | 155 | 4.86/5.0 |
| Bethanne | 1 | $11,653 | 12 | 5.00/5.0 |
| Hazel | 1 | $6,555 | 15 | 5.00/5.0 |
Analyzing the strategies of top hosts, such as their property selection, pricing, and guest communication, can offer valuable lessons for optimizing your own Airbnb operations in Shankill.
Dive Deeper: Advanced Shankill STR Market Data (2025)
Ready to unlock more insights? AirROI provides access to advanced metrics and comprehensive Airbnb data for Shankill. Explore detailed analytics beyond this report to refine your investment strategy, optimize pricing, and maximize your vacation rental profits.
Explore Advanced MetricsShankill Short-Term Rental Market Composition (2025): Property & Room Types
Room Type Distribution
Property Type Distribution
Market Composition Insights for Shankill
- The Shankill Airbnb market composition is heavily skewed towards Entire Home/Apt listings, which make up 65% of the 20 active rentals. This indicates strong guest preference for privacy and space.
- However, a notable 35% share for Private Rooms suggests opportunities for budget-conscious travelers or hosts renting out spare rooms.
- Looking at the property type distribution in Shankill, House properties are the most common (45%), reflecting the local real estate landscape.
- Houses represent a significant 45% portion, catering likely to families or larger groups.
- The presence of 10% Hotel/Boutique listings indicates integration with traditional hospitality.
Shankill Airbnb Room Capacity Analysis (2025): Bedroom Distribution
Distribution of Listings by Number of Bedrooms
Room Capacity Insights for Shankill
- The dominant room capacity in Shankill is 1 bedroom listings, making up 25% of the market. This suggests a strong demand for properties suitable for couples or solo travelers.
- Together, 1 bedroom and 2 bedrooms properties represent 50.0% of the active Airbnb listings in Shankill, indicating a high concentration in these sizes.
Shankill Vacation Rental Guest Capacity Trends (2025)
Distribution of Listings by Guest Capacity
Guest Capacity Insights for Shankill
- The most common guest capacity trend in Shankill vacation rentals is listings accommodating 4 guests (25%). This suggests the primary traveler segment is likely small families or groups.
- Properties designed for 4 guests and 2 guests dominate the Shankill STR market, accounting for 40.0% of listings.
- 15.0% of properties accommodate 6+ guests, serving the market segment for larger families or group travel in Shankill.
- On average, properties in Shankill are equipped to host 2.9 guests.
Shankill Airbnb Booking Patterns (2025): Available vs. Booked Days
Available Days Distribution
Booked Days Distribution
Booking Pattern Insights for Shankill
- The most common availability pattern in Shankill falls within the 271-366 days range, representing 70% of listings. This suggests many properties have significant open periods on their calendars.
- Approximately 85.0% of listings show high availability (181+ days open annually), indicating potential for increased bookings or specific owner usage patterns.
- For booked days, the 1-30 days range is most frequent in Shankill (55%), reflecting common guest stay durations or potential owner blocking patterns.
- A notable 15.0% of properties secure long booking periods (181+ days booked per year), highlighting successful long-term rental strategies or significant owner usage.
Shankill Airbnb Minimum Stay Requirements Analysis
Distribution of Listings by Minimum Night Requirement
1 Night
4 listings
20% of total
2 Nights
2 listings
10% of total
3 Nights
1 listings
5% of total
4-6 Nights
4 listings
20% of total
7-29 Nights
5 listings
25% of total
30+ Nights
4 listings
20% of total
Key Insights
- The most prevalent minimum stay requirement in Shankill is 7-29 Nights, adopted by 25% of listings. This highlights the market's preference for shorter, flexible bookings.
- A significant segment (20%) caters to monthly stays (30+ nights) in Shankill, pointing to opportunities in the extended-stay market.
Recommendations
- Align with the market by considering a 7-29 Nights minimum stay, as 25% of Shankill hosts use this setting.
- If feasible, allowing 1-night stays, especially midweek or during low season, could capture last-minute bookings, as only 20% currently do.
- Explore offering discounts for stays of 30+ nights to attract the 20% of the market seeking extended stays.
- Adjust minimum nights based on seasonality – potentially shorter during low season and longer during peak demand periods in Shankill.
Shankill Airbnb Cancellation Policy Trends Analysis (2025)
Super Strict 30 Days
5 listings
25% of total
Flexible
3 listings
15% of total
Moderate
4 listings
20% of total
Firm
6 listings
30% of total
Strict
2 listings
10% of total
Cancellation Policy Insights for Shankill
- The prevailing Airbnb cancellation policy trend in Shankill is Firm, used by 30% of listings.
- There's a relatively balanced mix between guest-friendly (35.0%) and stricter (40.0%) policies, offering choices for different guest needs.
Recommendations for Hosts
- Consider adopting a Firm policy to align with the 30% market standard in Shankill.
- Using a Strict policy might deter some guests, as only 10% of listings use it. Evaluate if potential revenue protection outweighs possible lower booking rates.
- Regularly review your cancellation policy against competitors and market demand shifts in Shankill.
Shankill STR Booking Lead Time Analysis (2025)
Average Booking Lead Time by Month
Booking Lead Time Insights for Shankill
- The overall average booking lead time for vacation rentals in Shankill is 34 days.
- Guests book furthest in advance for stays during October (average 74 days), likely coinciding with peak travel demand or local events.
- The shortest booking windows occur for stays in December (average 25 days), indicating more last-minute travel plans during this time.
- Seasonally, Fall (62 days avg.) sees the longest lead times, while Winter (31 days avg.) has the shortest, reflecting typical travel planning cycles.
Recommendations for Hosts
- Use the overall average lead time (34 days) as a baseline for your pricing and availability strategy in Shankill.
- For October stays, consider implementing length-of-stay discounts or slightly higher rates for bookings made less than 74 days out to capitalize on advance planning.
- Target marketing efforts for the Fall season well in advance (at least 62 days) to capture early planners.
- Monitor your own booking lead times against these Shankill averages to identify opportunities for dynamic pricing adjustments.
Popular & Essential Airbnb Amenities in Shankill (2025)
Amenity Prevalence
Amenity Insights for Shankill
- Essential amenities in Shankill that guests expect include: Wifi, Smoke alarm. Lacking these (any) could significantly impact bookings.
- Popular amenities like Dedicated workspace, Hot water, Heating are common but not universal. Offering these can provide a competitive edge.
Recommendations for Hosts
- Ensure your listing includes all essential amenities for Shankill: Wifi, Smoke alarm.
- Prioritize adding missing essentials: Smoke alarm.
- Consider adding popular differentiators like Dedicated workspace or Hot water to increase appeal.
- Highlight unique or less common amenities you offer (e.g., hot tub, dedicated workspace, EV charger) in your listing description and photos.
- Regularly check competitor amenities in Shankill to stay competitive.
Shankill Airbnb Guest Demographics & Profile Analysis (2025)
Guest Profile Summary for Shankill
- The typical guest profile for Airbnb in Shankill consists of predominantly international visitors (87%), with top international origins including United States, typically belonging to the Post-2000s (Gen Z/Alpha) group (50%), primarily speaking English or French.
- Domestic travelers account for 13.0% of guests.
- Key international markets include United Kingdom (27.5%) and United States (26.1%).
- Top languages spoken are English (48.9%) followed by French (17.8%).
- A significant demographic segment is the Post-2000s (Gen Z/Alpha) group, representing 50% of guests.
Recommendations for Hosts
- Focus marketing internationally, particularly towards travelers from United States.
- Tailor amenities and listing descriptions to appeal to the dominant Post-2000s (Gen Z/Alpha) demographic (e.g., highlight fast WiFi, smart home features, local guides).
- Highlight unique local experiences or amenities relevant to the primary guest profile.
- Consider seasonal promotions aligned with peak travel times for key origin markets.
Nearby Short-Term Rental Market Comparison
How does the Shankill Airbnb market stack up against its neighbors? Compare key performance metrics like average monthly revenue, ADR, and occupancy rates in surrounding areas to understand the broader regional STR landscape.
| Market | Active Properties | Monthly Revenue | Daily Rate | Avg. Occupancy |
|---|---|---|---|---|
| Kilcoo | 10 | $3,595 | $228.20 | 51% |
| Dalkey | 21 | $3,514 | $372.34 | 52% |
| Howth | 39 | $3,204 | $363.61 | 44% |
| The Municipal District of Kilkenny City | 67 | $3,141 | $258.90 | 52% |
| Mullartown | 15 | $3,115 | $410.52 | 35% |
| Dublin | 2,745 | $3,081 | $249.98 | 51% |
| The Municipal District of Piltown | 42 | $2,920 | $257.89 | 49% |
| The Municipal District of Dundalk | 143 | $2,808 | $311.50 | 37% |
| The Municipal District of Ardee | 29 | $2,800 | $264.11 | 39% |
| Sutton | 12 | $2,738 | $254.52 | 53% |