Dublin Airbnb Market Analysis 2026: Short Term Rental Data & Vacation Rental Statistics in County Dublin, Ireland
Is Airbnb profitable in Dublin in 2026? Explore comprehensive Airbnb analytics for Dublin, County Dublin, Ireland to uncover income potential. This 2026 STR market report for Dublin, based on AirROI data from February 2025 to January 2026, reveals key trends in the bustling market of 2,681 active listings.
Whether you're considering an Airbnb investment in Dublin, optimizing your existing vacation rental, or exploring rental arbitrage opportunities, understanding the Dublin Airbnb data is crucial. Leveraging the low regulation environment is key to maximizing your short term rental income potential. Let's dive into the specifics.
Key Dublin Airbnb Performance Metrics Overview
Monthly Airbnb Revenue Variations & Income Potential in Dublin (2026)
Understanding the monthly revenue variations for Airbnb listings in Dublin is key to maximizing your short term rental income potential. Seasonality significantly impacts earnings. Our analysis, based on data from the past 12 months, shows that the peak revenue month for STRs in Dublin is typically September, while January often presents the lowest earnings, highlighting opportunities for strategic pricing adjustments during shoulder and low seasons. Explore the typical Airbnb income in Dublin across different performance tiers:
- Best-in-class properties (Top 10%) achieve $8,499+ monthly, often utilizing dynamic pricing and superior guest experiences.
- Strong performing properties (Top 25%) earn $5,132 or more, indicating effective management and desirable locations/amenities.
- Typical properties (Median) generate around $2,923 per month, representing the average market performance.
- Entry-level properties (Bottom 25%) see earnings around $1,607, often with potential for optimization.
Average Monthly Airbnb Earnings Trend in Dublin
Dublin Airbnb Occupancy Rate Trends (2026)
Maximize your bookings by understanding the Dublin STR occupancy trends. Seasonal demand shifts significantly influence how often properties are booked. Typically, Septembersees the highest demand (peak season occupancy), while January experiences the lowest (low season). Effective strategies, like adjusting minimum stays or offering promotions, can boost occupancy during slower periods. Here's how different property tiers perform in Dublin:
- Best-in-class properties (Top 10%) achieve 90%+ occupancy, indicating high desirability and potentially optimized availability.
- Strong performing properties (Top 25%) maintain 78% or higher occupancy, suggesting good market fit and guest satisfaction.
- Typical properties (Median) have an occupancy rate around 58%.
- Entry-level properties (Bottom 25%) average 30% occupancy, potentially facing higher vacancy.
Average Monthly Occupancy Rate Trend in Dublin
Average Daily Rate (ADR) Airbnb Trends in Dublin (2026)
Effective short term rental pricing strategy in Dublin involves understanding monthly ADR fluctuations. The Average Daily Rate (ADR) for Airbnb in Dublin typically peaks in September and dips lowest during February. Leveraging Airbnb dynamic pricing tools or strategies based on this seasonality can significantly boost revenue. Here's a look at the typical nightly rates achieved:
- Best-in-class properties (Top 10%) command rates of $457+ per night, often due to premium features or locations.
- Strong performing properties (Top 25%) achieve nightly rates of $297 or more.
- Typical properties (Median) charge around $185 per night.
- Entry-level properties (Bottom 25%) earn around $117 per night.
Average Daily Rate (ADR) Trend by Month in Dublin
Get Live Dublin Market Intelligence 👇

Explore Real-time Analytics
Airbnb Seasonality Analysis & Trends in Dublin (2026)
Peak Season (September, August, June)
- Revenue averages $4,879 per month
- Occupancy rates average 60.5%
- Daily rates average $264
Shoulder Season
- Revenue averages $4,177 per month
- Occupancy maintains around 56.2%
- Daily rates hold near $249
Low Season (January, February, December)
- Revenue drops to average $2,834 per month
- Occupancy decreases to average 43.4%
- Daily rates adjust to average $243
Seasonality Insights for Dublin
- The Airbnb seasonality in Dublin shows moderate seasonality with distinct peak and low periods. While the sections above show seasonal averages, it's also insightful to look at the extremes:
- During the high season, the absolute peak month showcases Dublin's highest earning potential, with monthly revenues capable of climbing to $5,007, occupancy reaching a high of 63.4%, and ADRs peaking at $274.
- Conversely, the slowest single month of the year, typically falling within the low season, marks the market's lowest point. In this month, revenue might dip to $2,202, occupancy could drop to 34.3%, and ADRs may adjust down to $229.
- Understanding both the seasonal averages and these monthly peaks and troughs in revenue, occupancy, and ADR is crucial for maximizing your Airbnb profit potential in Dublin.
Seasonal Strategies for Maximizing Profit
- Peak Season: Maximize revenue through premium pricing and potentially longer minimum stays. Ensure high availability.
- Low Season: Offer competitive pricing, special promotions (e.g., extended stay discounts), and flexible cancellation policies. Target off-season travelers like remote workers or budget-conscious guests.
- Shoulder Seasons: Implement dynamic pricing that balances peak and low rates. Target weekend travelers or specific events. Offer slightly more flexible terms than peak season.
- Regularly analyze your own performance against these Dublin seasonality benchmarks and adjust your pricing and availability strategy accordingly.
Best Areas for Airbnb Investment in Dublin (2026)
Exploring the top neighborhoods for short-term rentals in Dublin? This section highlights key areas, outlining why they are attractive for hosts and guests, along with notable local attractions. Consider these locations based on your target guest profile and investment strategy.
| Neighborhood / Area | Why Host Here? (Target Guests & Appeal) | Key Attractions & Landmarks |
|---|---|---|
| Temple Bar | Cultural heart of Dublin, renowned for its vibrant nightlife, pubs, and restaurants. Attracts tourists looking for authentic Irish experiences and live music. | Temple Bar Pub, Irish Film Institute, Ha'penny Bridge, Dublin Castle, National Gallery of Ireland |
| Smithfield | A trendy area that has been revitalized, featuring a mix of old and new Dublin. It's popular among locals and tourists for its unique atmosphere and proximity to attractions. | Smithfield Square, Jameson Distillery, Dublin Zoo, The luas tram system, The Light House Cinema |
| Dalkey | A picturesque suburb south of Dublin, known for its scenic views and affluent residents. It appeals to visitors looking for a quieter, charming Irish experience close to the coast. | Dalkey Island, Sandy Cove, The People's Park, Dún Laoghaire Harbour, The Forty Foot |
| Dún Laoghaire | A vibrant seaside town with a bustling marina and numerous shops and restaurants. It's a great spot for those wanting to experience coastal Dublin with access to seaside activities. | Dún Laoghaire Harbour, Pier Walk, National Maritime Museum, Shopping at George's Street, People's Park |
| St. Stephen's Green | A beautiful park area that's surrounded by shopping and dining, making it a prime location for both tourists and locals to explore the heart of Dublin. | St. Stephen's Green Park, Grafton Street, National Museum of Ireland, Shelbourne Hotel, Bewley's Café |
| Phibsborough | An up-and-coming area with a mix of traditional and modern charm, appealing to young professionals and families alike. Great for those wanting to experience local life in Dublin. | Broombridge, Crumlin Road Gaol, Boromarin, The Royal Canal, Café Rí |
| Kilmainham | Known for its historical significance and cultural attractions, this area attracts history buffs and those interested in Irish heritage, with a range of museums and landmarks. | Kilmainham Gaol, Irish Museum of Modern Art, Royal Hospital Kilmainham, Phoenix Park, The Dublin Camogie Club |
| Ballsbridge | A prestigious and upscale area known for its affluent residences, embassies, and proximity to the city center. It's ideal for travelers looking for luxurious stays and dining experiences. | Aviva Stadium, Herbert Park, Sydney Parade Railway Station, The RDS, The Grand Canal |
Understanding Airbnb License Requirements & STR Laws in Dublin (2026)
While Dublin, County Dublin, Ireland currently shows low STR regulations, specific Airbnb license requirements might still exist or change. Always verify the latest short term rental regulations and Airbnb license requirements directly with local government authorities for Dublin to ensure full compliance before hosting.
(Source: AirROI data, 2026, based on 0% licensed listings)
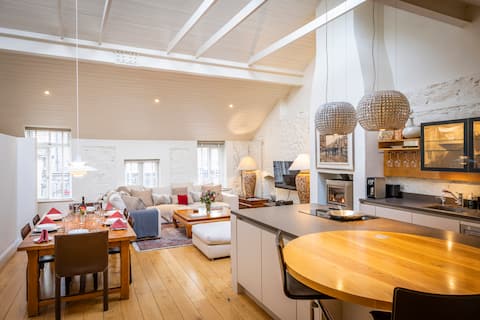
Top Performing Airbnb Properties in Dublin (2026)
Benchmark your potential! Explore examples of top-performing Airbnb properties in Dublinbased on Trailing Twelve Month (TTM) revenue. Analyze their characteristics, revenue, occupancy rate, and ADR to understand what drives success in this market.
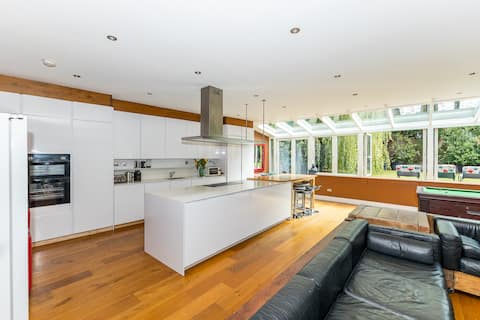
City Centre 7~Bedroom Georgian House~Portobello
Entire Place • 7 bedrooms

The Yellow Door by Shortstays
Entire Place • 6 bedrooms

Sparkling Large Penthouse, Terrace, Prime Location
Entire Place • 3 bedrooms
Luxurious three bedroom apartment in Mews building
Entire Place • 3 bedrooms

Exclusive Georgian Townhouse
Entire Place • 5 bedrooms

Beautiful City Townhouse
Entire Place • 3 bedrooms
Note: Performance varies based on location, size, amenities, seasonality, and management quality. Data reflects the past 12 months.
Top Performing Airbnb Hosts in Dublin (2026)
Learn from the best! This table showcases top-performing Airbnb hosts in Dublin based on the number of properties managed and estimated total revenue over the past year. Analyze their scale and performance metrics.
| Host Name | Properties | Grossing Revenue | Stay Reviews | Avg Rating |
|---|---|---|---|---|
| Anna | 155 | $4,826,636 | 6233 | 4.46/5.0 |
| Lucas | 82 | $2,548,280 | 2985 | 4.56/5.0 |
| Liam | 17 | $1,977,761 | 2796 | 4.90/5.0 |
| Paul | 23 | $1,416,594 | 2815 | 4.68/5.0 |
| Johnny | 30 | $1,373,840 | 1497 | 4.29/5.0 |
| Julie | 18 | $1,172,887 | 725 | 4.59/5.0 |
| Kevin | 7 | $1,028,651 | 1151 | 4.87/5.0 |
| Diogo | 19 | $1,027,301 | 3098 | 4.53/5.0 |
| Dublin Dream | 8 | $956,313 | 1852 | 4.64/5.0 |
| Henrietta Suites | 7 | $900,214 | 441 | 4.91/5.0 |
Analyzing the strategies of top hosts, such as their property selection, pricing, and guest communication, can offer valuable lessons for optimizing your own Airbnb operations in Dublin.
Dive Deeper: Advanced Dublin STR Market Data (2026)
Ready to unlock more insights? AirROI provides access to advanced metrics and comprehensive Airbnb data for Dublin. Explore detailed analytics beyond this report to refine your investment strategy, optimize pricing, and maximize your vacation rental profits.
Explore Advanced MetricsDublin Short-Term Rental Market Composition (2026): Property & Room Types
Room Type Distribution
Property Type Distribution
Market Composition Insights for Dublin
- The Dublin Airbnb market composition is heavily skewed towards Entire Home/Apt listings, which make up 62.3% of the 2,681 active rentals. This indicates strong guest preference for privacy and space.
- However, a notable 35.9% share for Private Rooms suggests opportunities for budget-conscious travelers or hosts renting out spare rooms.
- Looking at the property type distribution in Dublin, Apartment/Condo properties are the most common (55.7%), reflecting the local real estate landscape.
- Houses represent a significant 37.2% portion, catering likely to families or larger groups.
- The presence of 5.7% Hotel/Boutique listings indicates integration with traditional hospitality.
- Smaller segments like others, outdoor/unique (combined 1.3%) offer potential for unique stay experiences.
Dublin Airbnb Room Capacity Analysis (2026): Bedroom Distribution
Distribution of Listings by Number of Bedrooms
Room Capacity Insights for Dublin
- The dominant room capacity in Dublin is 1 bedroom listings, making up 32.8% of the market. This suggests a strong demand for properties suitable for couples or solo travelers.
- Together, 1 bedroom and 2 bedrooms properties represent 57.6% of the active Airbnb listings in Dublin, indicating a high concentration in these sizes.
Dublin Vacation Rental Guest Capacity Trends (2026)
Distribution of Listings by Guest Capacity
Guest Capacity Insights for Dublin
- The most common guest capacity trend in Dublin vacation rentals is listings accommodating 4 guests (21.7%). This suggests the primary traveler segment is likely small families or groups.
- Properties designed for 4 guests and 2 guests dominate the Dublin STR market, accounting for 41.3% of listings.
- 15.4% of properties accommodate 6+ guests, serving the market segment for larger families or group travel in Dublin.
- On average, properties in Dublin are equipped to host 2.8 guests.
Dublin Airbnb Booking Patterns (2026): Available vs. Booked Days
Available Days Distribution
Booked Days Distribution
Booking Pattern Insights for Dublin
- The most common availability pattern in Dublin falls within the 271-366 days range, representing 30.6% of listings. This suggests many properties have significant open periods on their calendars.
- Approximately 60.0% of listings show high availability (181+ days open annually), indicating potential for increased bookings or specific owner usage patterns.
- For booked days, the 91-180 days range is most frequent in Dublin (28.8%), reflecting common guest stay durations or potential owner blocking patterns.
- A notable 41.7% of properties secure long booking periods (181+ days booked per year), highlighting successful long-term rental strategies or significant owner usage.
Dublin Airbnb Minimum Stay Requirements Analysis
Distribution of Listings by Minimum Night Requirement
1 Night
575 listings
21.5% of total
2 Nights
375 listings
14% of total
3 Nights
156 listings
5.8% of total
4-6 Nights
199 listings
7.4% of total
7-29 Nights
375 listings
14% of total
30+ Nights
998 listings
37.3% of total
Key Insights
- The most prevalent minimum stay requirement in Dublin is 30+ Nights, adopted by 37.3% of listings. This highlights the market's preference for longer commitments.
- A significant segment (37.3%) caters to monthly stays (30+ nights) in Dublin, pointing to opportunities in the extended-stay market.
Recommendations
- Align with the market by considering a 30+ Nights minimum stay, as 37.3% of Dublin hosts use this setting.
- If feasible, allowing 1-night stays, especially midweek or during low season, could capture last-minute bookings, as only 21.5% currently do.
- Explore offering discounts for stays of 30+ nights to attract the 37.3% of the market seeking extended stays.
- Adjust minimum nights based on seasonality – potentially shorter during low season and longer during peak demand periods in Dublin.
Dublin Airbnb Cancellation Policy Trends Analysis (2026)
Super Strict 30 Days
20 listings
0.7% of total
Limited
16 listings
0.6% of total
Super Strict 60 Days
3 listings
0.1% of total
Flexible
459 listings
17.2% of total
Moderate
604 listings
22.6% of total
Firm
941 listings
35.2% of total
Strict
628 listings
23.5% of total
Cancellation Policy Insights for Dublin
- The prevailing Airbnb cancellation policy trend in Dublin is Firm, used by 35.2% of listings.
- A majority (58.7%) of hosts in Dublin utilize Firm or Strict policies, indicating a market where hosts prioritize booking security.
Recommendations for Hosts
- Consider adopting a Firm policy to align with the 35.2% market standard in Dublin.
- Regularly review your cancellation policy against competitors and market demand shifts in Dublin.
Dublin STR Booking Lead Time Analysis (2026)
Average Booking Lead Time by Month
Booking Lead Time Insights for Dublin
- The overall average booking lead time for vacation rentals in Dublin is 62 days.
- Guests book furthest in advance for stays during August (average 91 days), likely coinciding with peak travel demand or local events.
- The shortest booking windows occur for stays in January (average 35 days), indicating more last-minute travel plans during this time.
- Seasonally, Summer (75 days avg.) sees the longest lead times, while Winter (39 days avg.) has the shortest, reflecting typical travel planning cycles.
Recommendations for Hosts
- Use the overall average lead time (62 days) as a baseline for your pricing and availability strategy in Dublin.
- For August stays, consider implementing length-of-stay discounts or slightly higher rates for bookings made less than 91 days out to capitalize on advance planning.
- Target marketing efforts for the Summer season well in advance (at least 75 days) to capture early planners.
- Monitor your own booking lead times against these Dublin averages to identify opportunities for dynamic pricing adjustments.
Popular & Essential Airbnb Amenities in Dublin (2026)
Amenity Prevalence
Amenity Insights for Dublin
- Essential amenities in Dublin that guests expect include: Wifi. Lacking these (this) could significantly impact bookings.
- Popular amenities like Smoke alarm, Heating, Hot water are common but not universal. Offering these can provide a competitive edge.
Recommendations for Hosts
- Ensure your listing includes all essential amenities for Dublin: Wifi.
- Prioritize adding missing essentials: Wifi.
- Consider adding popular differentiators like Smoke alarm or Heating to increase appeal.
- Highlight unique or less common amenities you offer (e.g., hot tub, dedicated workspace, EV charger) in your listing description and photos.
- Regularly check competitor amenities in Dublin to stay competitive.
Dublin Airbnb Guest Demographics & Profile Analysis (2026)
Guest Profile Summary for Dublin
- The typical guest profile for Airbnb in Dublin consists of predominantly international visitors (95%), with top international origins including United Kingdom, typically belonging to the Post-2000s (Gen Z/Alpha) group (50%), primarily speaking English or French.
- Domestic travelers account for 5.2% of guests.
- Key international markets include United States (38.9%) and United Kingdom (14.8%).
- Top languages spoken are English (51.9%) followed by French (11.2%).
- A significant demographic segment is the Post-2000s (Gen Z/Alpha) group, representing 50% of guests.
Recommendations for Hosts
- Focus marketing internationally, particularly towards travelers from United Kingdom.
- Tailor amenities and listing descriptions to appeal to the dominant Post-2000s (Gen Z/Alpha) demographic (e.g., highlight fast WiFi, smart home features, local guides).
- Highlight unique local experiences or amenities relevant to the primary guest profile.
- Consider seasonal promotions aligned with peak travel times for key origin markets.
Nearby Short-Term Rental Market Comparison
How does the Dublin Airbnb market stack up against its neighbors? Compare key performance metrics like average monthly revenue, ADR, and occupancy rates in surrounding areas to understand the broader regional STR landscape.
| Market | Active Properties | Monthly Revenue | Daily Rate | Avg. Occupancy |
|---|---|---|---|---|
| Irvinestown | 10 | $4,091 | $352.70 | 41% |
| Dublin 2 | 15 | $3,771 | $317.51 | 54% |
| Kilcoo | 10 | $3,520 | $216.82 | 54% |
| Howth | 38 | $3,401 | $371.91 | 45% |
| Dalkey | 19 | $3,311 | $358.14 | 52% |
| Mullartown | 15 | $3,219 | $395.00 | 33% |
| The Municipal District of Kilkenny City | 65 | $3,209 | $260.55 | 54% |
| The Municipal District of Ratoath | 36 | $3,171 | $234.93 | 47% |
| Sutton | 10 | $3,087 | $247.21 | 58% |
| Killiney | 13 | $3,077 | $378.20 | 40% |