Glenties Municipal District Airbnb Market Analysis 2026: Short Term Rental Data & Vacation Rental Statistics in County Donegal, Ireland
Is Airbnb profitable in Glenties Municipal District in 2026? Explore comprehensive Airbnb analytics for Glenties Municipal District, County Donegal, Ireland to uncover income potential. This 2026 STR market report for Glenties Municipal District, based on AirROI data from February 2025 to January 2026, reveals key trends in the market of 585 active listings.
Whether you're considering an Airbnb investment in Glenties Municipal District, optimizing your existing vacation rental, or exploring rental arbitrage opportunities, understanding the Glenties Municipal District Airbnb data is crucial. Leveraging the low regulation environment is key to maximizing your short term rental income potential. Let's dive into the specifics.
Key Glenties Municipal District Airbnb Performance Metrics Overview
Monthly Airbnb Revenue Variations & Income Potential in Glenties Municipal District (2026)
Understanding the monthly revenue variations for Airbnb listings in Glenties Municipal District is key to maximizing your short term rental income potential. Seasonality significantly impacts earnings. Our analysis, based on data from the past 12 months, shows that the peak revenue month for STRs in Glenties Municipal District is typically July, while January often presents the lowest earnings, highlighting opportunities for strategic pricing adjustments during shoulder and low seasons. Explore the typical Airbnb income in Glenties Municipal District across different performance tiers:
- Best-in-class properties (Top 10%) achieve $4,315+ monthly, often utilizing dynamic pricing and superior guest experiences.
- Strong performing properties (Top 25%) earn $2,887 or more, indicating effective management and desirable locations/amenities.
- Typical properties (Median) generate around $1,840 per month, representing the average market performance.
- Entry-level properties (Bottom 25%) see earnings around $1,042, often with potential for optimization.
Average Monthly Airbnb Earnings Trend in Glenties Municipal District
Glenties Municipal District Airbnb Occupancy Rate Trends (2026)
Maximize your bookings by understanding the Glenties Municipal District STR occupancy trends. Seasonal demand shifts significantly influence how often properties are booked. Typically, Julysees the highest demand (peak season occupancy), while January experiences the lowest (low season). Effective strategies, like adjusting minimum stays or offering promotions, can boost occupancy during slower periods. Here's how different property tiers perform in Glenties Municipal District:
- Best-in-class properties (Top 10%) achieve 74%+ occupancy, indicating high desirability and potentially optimized availability.
- Strong performing properties (Top 25%) maintain 57% or higher occupancy, suggesting good market fit and guest satisfaction.
- Typical properties (Median) have an occupancy rate around 39%.
- Entry-level properties (Bottom 25%) average 23% occupancy, potentially facing higher vacancy.
Average Monthly Occupancy Rate Trend in Glenties Municipal District
Average Daily Rate (ADR) Airbnb Trends in Glenties Municipal District (2026)
Effective short term rental pricing strategy in Glenties Municipal District involves understanding monthly ADR fluctuations. The Average Daily Rate (ADR) for Airbnb in Glenties Municipal District typically peaks in August and dips lowest during February. Leveraging Airbnb dynamic pricing tools or strategies based on this seasonality can significantly boost revenue. Here's a look at the typical nightly rates achieved:
- Best-in-class properties (Top 10%) command rates of $270+ per night, often due to premium features or locations.
- Strong performing properties (Top 25%) achieve nightly rates of $195 or more.
- Typical properties (Median) charge around $153 per night.
- Entry-level properties (Bottom 25%) earn around $118 per night.
Average Daily Rate (ADR) Trend by Month in Glenties Municipal District
Get Live Glenties Municipal District Market Intelligence 👇

Explore Real-time Analytics
Airbnb Seasonality Analysis & Trends in Glenties Municipal District (2026)
Peak Season (July, August, June)
- Revenue averages $3,616 per month
- Occupancy rates average 62.3%
- Daily rates average $182
Shoulder Season
- Revenue averages $1,980 per month
- Occupancy maintains around 37.7%
- Daily rates hold near $173
Low Season (January, February, November)
- Revenue drops to average $1,337 per month
- Occupancy decreases to average 25.8%
- Daily rates adjust to average $173
Seasonality Insights for Glenties Municipal District
- The Airbnb seasonality in Glenties Municipal District shows highly seasonal trends requiring careful strategy. While the sections above show seasonal averages, it's also insightful to look at the extremes:
- During the high season, the absolute peak month showcases Glenties Municipal District's highest earning potential, with monthly revenues capable of climbing to $4,159, occupancy reaching a high of 70.2%, and ADRs peaking at $184.
- Conversely, the slowest single month of the year, typically falling within the low season, marks the market's lowest point. In this month, revenue might dip to $1,184, occupancy could drop to 20.6%, and ADRs may adjust down to $162.
- Understanding both the seasonal averages and these monthly peaks and troughs in revenue, occupancy, and ADR is crucial for maximizing your Airbnb profit potential in Glenties Municipal District.
Seasonal Strategies for Maximizing Profit
- Peak Season: Maximize revenue through premium pricing and potentially longer minimum stays. Ensure high availability.
- Low Season: Offer competitive pricing, special promotions (e.g., extended stay discounts), and flexible cancellation policies. Target off-season travelers like remote workers or budget-conscious guests.
- Shoulder Seasons: Implement dynamic pricing that balances peak and low rates. Target weekend travelers or specific events. Offer slightly more flexible terms than peak season.
- Regularly analyze your own performance against these Glenties Municipal District seasonality benchmarks and adjust your pricing and availability strategy accordingly.
Best Areas for Airbnb Investment in Glenties Municipal District (2026)
Exploring the top neighborhoods for short-term rentals in Glenties Municipal District? This section highlights key areas, outlining why they are attractive for hosts and guests, along with notable local attractions. Consider these locations based on your target guest profile and investment strategy.
| Neighborhood / Area | Why Host Here? (Target Guests & Appeal) | Key Attractions & Landmarks |
|---|---|---|
| Narin & Portnoo | Picturesque coastal area known for its stunning beaches and outdoor activities. Ideal for visitors seeking relaxation and nature with golf courses and scenic walks nearby. | Narin Beach, Portnoo Beach, Glenveagh National Park, Bluestack Mountains, Local golf courses |
| Glenties Town | A charming town with rich cultural history, ideal for tourists wanting to experience Irish hospitality and local traditions. Close to festivals and local events. | St. Connell's Museum, The Church of Ireland, Glenties Heritage Centre, Traditional music sessions, Local pubs |
| Lough Eske | Scenic lake area offering tranquility and natural beauty. Attractive to those seeking a peaceful retreat with opportunities for hiking and fishing. | Lough Eske, Castle O'Donnell, Walking trails, Fishing spots, Wildlife watching |
| Ardara | Known for its traditional Irish music scene and beautiful mountain scenery. Popular among tourists interested in local crafts and cultural experiences. | Ardara Heritage Centre, Local craft shops, Outdoor music festivals, Slieve League Cliffs, Scenic walks |
| Sheskinmore | Beautiful, serene landscapes with access to beach and nature trails. Perfect for relaxation and outdoor adventures, including birdwatching. | Sheskinmore Nature Reserve, Wildlife viewing, Beachcombing, Walking trails, Scenic views |
| Dungloe | A vibrant town with a rich local culture and close proximity to scenic coastlines. Great for visitors wishing to explore Donegal's natural beauty. | Dungloe Bay, Local markets, Traditional Irish music, Tours of nearby islands, Coastal walks |
| Muff | A quaint village near the border of Donegal, friendly community with proximity to Derry city, appealing for both leisure and work-related stays. | Muff Community Park, Local eateries, Access to Derry, Cultural events, Scenic countryside |
| Ballybofey | A lively town known for its entertainment and local events, great for visitors looking for nightlife and cultural experiences in Donegal. | Balor Theatre, Local festivals, River Finn, Shopping locales, Authentic cuisine |
Understanding Airbnb License Requirements & STR Laws in Glenties Municipal District (2026)
While Glenties Municipal District, County Donegal, Ireland currently shows low STR regulations, specific Airbnb license requirements might still exist or change. Always verify the latest short term rental regulations and Airbnb license requirements directly with local government authorities for Glenties Municipal District to ensure full compliance before hosting.
(Source: AirROI data, 2026, finding no licensed listings among those analyzed)
Top Performing Airbnb Properties in Glenties Municipal District (2026)
Benchmark your potential! Explore examples of top-performing Airbnb properties in Glenties Municipal Districtbased on Trailing Twelve Month (TTM) revenue. Analyze their characteristics, revenue, occupancy rate, and ADR to understand what drives success in this market.

Ballyeriston House
Entire Place • 5 bedrooms
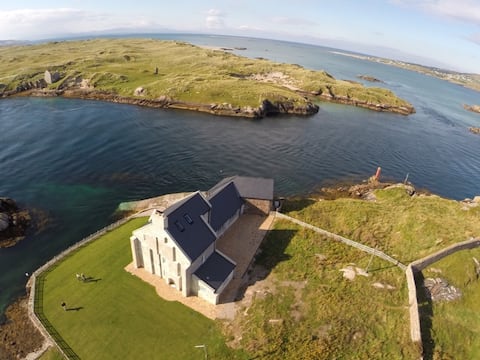
Idyllic getaway on a wild Irish island
Entire Place • 8 bedrooms

Wild Atlantic Lodge Dunfanaghy
Entire Place • 6 bedrooms

The Green Gate (200 year old Irish Cottage)
Entire Place • 5 bedrooms

Luxe Beachfront Retreat | Sauna | Cinema | Nature
Entire Place • 4 bedrooms
Charlie Neddys. Derry reel, Dunfanaghy
Entire Place • 4 bedrooms
Note: Performance varies based on location, size, amenities, seasonality, and management quality. Data reflects the past 12 months.
Top Performing Airbnb Hosts in Glenties Municipal District (2026)
Learn from the best! This table showcases top-performing Airbnb hosts in Glenties Municipal District based on the number of properties managed and estimated total revenue over the past year. Analyze their scale and performance metrics.
| Host Name | Properties | Grossing Revenue | Stay Reviews | Avg Rating |
|---|---|---|---|---|
| Siubhan | 11 | $187,834 | 291 | 4.83/5.0 |
| Natasha | 3 | $162,256 | 123 | 4.96/5.0 |
| Mark | 1 | $155,576 | 26 | 5.00/5.0 |
| Traighenna Bay | 2 | $123,283 | 959 | 4.94/5.0 |
| Caroline | 1 | $122,985 | 37 | 5.00/5.0 |
| Paul | 2 | $121,951 | 175 | 4.96/5.0 |
| Lesley | 2 | $117,295 | 60 | 4.97/5.0 |
| Judith | 5 | $112,551 | 659 | 4.90/5.0 |
| Sharon | 2 | $108,877 | 95 | 5.00/5.0 |
| Edward | 8 | $107,741 | 209 | 4.90/5.0 |
Analyzing the strategies of top hosts, such as their property selection, pricing, and guest communication, can offer valuable lessons for optimizing your own Airbnb operations in Glenties Municipal District.
Dive Deeper: Advanced Glenties Municipal District STR Market Data (2026)
Ready to unlock more insights? AirROI provides access to advanced metrics and comprehensive Airbnb data for Glenties Municipal District. Explore detailed analytics beyond this report to refine your investment strategy, optimize pricing, and maximize your vacation rental profits.
Explore Advanced MetricsGlenties Municipal District Short-Term Rental Market Composition (2026): Property & Room Types
Room Type Distribution
Property Type Distribution
Market Composition Insights for Glenties Municipal District
- The Glenties Municipal District Airbnb market composition is heavily skewed towards Entire Home/Apt listings, which make up 90.1% of the 585 active rentals. This indicates strong guest preference for privacy and space.
- Looking at the property type distribution in Glenties Municipal District, House properties are the most common (72.1%), reflecting the local real estate landscape.
- Houses represent a significant 72.1% portion, catering likely to families or larger groups.
- The presence of 6.5% Hotel/Boutique listings indicates integration with traditional hospitality.
- Smaller segments like others, unique stays (combined 5.9%) offer potential for unique stay experiences.
Glenties Municipal District Airbnb Room Capacity Analysis (2026): Bedroom Distribution
Distribution of Listings by Number of Bedrooms
Room Capacity Insights for Glenties Municipal District
- The dominant room capacity in Glenties Municipal District is 3 bedrooms listings, making up 28.5% of the market. This suggests a strong demand for properties suitable for families or small groups.
- Together, 3 bedrooms and 2 bedrooms properties represent 50.6% of the active Airbnb listings in Glenties Municipal District, indicating a high concentration in these sizes.
- A significant 51.7% of listings offer 3+ bedrooms, catering to larger groups and families seeking more space in Glenties Municipal District.
Glenties Municipal District Vacation Rental Guest Capacity Trends (2026)
Distribution of Listings by Guest Capacity
Guest Capacity Insights for Glenties Municipal District
- The most common guest capacity trend in Glenties Municipal District vacation rentals is listings accommodating 8+ guests (23.4%). This suggests the primary traveler segment is likely larger groups.
- Properties designed for 8+ guests and 6 guests dominate the Glenties Municipal District STR market, accounting for 44.8% of listings.
- 49.4% of properties accommodate 6+ guests, serving the market segment for larger families or group travel in Glenties Municipal District.
- On average, properties in Glenties Municipal District are equipped to host 4.9 guests.
Glenties Municipal District Airbnb Booking Patterns (2026): Available vs. Booked Days
Available Days Distribution
Booked Days Distribution
Booking Pattern Insights for Glenties Municipal District
- The most common availability pattern in Glenties Municipal District falls within the 181-270 days range, representing 45% of listings. This suggests many properties have significant open periods on their calendars.
- Approximately 82.4% of listings show high availability (181+ days open annually), indicating potential for increased bookings or specific owner usage patterns.
- For booked days, the 91-180 days range is most frequent in Glenties Municipal District (45.3%), reflecting common guest stay durations or potential owner blocking patterns.
- A notable 19.0% of properties secure long booking periods (181+ days booked per year), highlighting successful long-term rental strategies or significant owner usage.
Glenties Municipal District Airbnb Minimum Stay Requirements Analysis
Distribution of Listings by Minimum Night Requirement
1 Night
81 listings
13.8% of total
2 Nights
145 listings
24.8% of total
3 Nights
67 listings
11.5% of total
4-6 Nights
42 listings
7.2% of total
7-29 Nights
4 listings
0.7% of total
30+ Nights
246 listings
42.1% of total
Key Insights
- The most prevalent minimum stay requirement in Glenties Municipal District is 30+ Nights, adopted by 42.1% of listings. This highlights the market's preference for longer commitments.
- A significant segment (42.1%) caters to monthly stays (30+ nights) in Glenties Municipal District, pointing to opportunities in the extended-stay market.
Recommendations
- Align with the market by considering a 30+ Nights minimum stay, as 42.1% of Glenties Municipal District hosts use this setting.
- If feasible, allowing 1-night stays, especially midweek or during low season, could capture last-minute bookings, as only 13.8% currently do.
- Explore offering discounts for stays of 30+ nights to attract the 42.1% of the market seeking extended stays.
- Adjust minimum nights based on seasonality – potentially shorter during low season and longer during peak demand periods in Glenties Municipal District.
Glenties Municipal District Airbnb Cancellation Policy Trends Analysis (2026)
Limited
3 listings
0.5% of total
Super Strict 60 Days
8 listings
1.4% of total
Flexible
153 listings
26.2% of total
Moderate
182 listings
31.1% of total
Firm
181 listings
30.9% of total
Strict
58 listings
9.9% of total
Cancellation Policy Insights for Glenties Municipal District
- The prevailing Airbnb cancellation policy trend in Glenties Municipal District is Moderate, used by 31.1% of listings.
- There's a relatively balanced mix between guest-friendly (57.3%) and stricter (40.8%) policies, offering choices for different guest needs.
- Strict cancellation policies are quite rare (9.9%), potentially making listings with this policy less competitive unless justified by high demand or property type.
Recommendations for Hosts
- Consider adopting a Moderate policy to align with the 31.1% market standard in Glenties Municipal District.
- Using a Strict policy might deter some guests, as only 9.9% of listings use it. Evaluate if potential revenue protection outweighs possible lower booking rates.
- Regularly review your cancellation policy against competitors and market demand shifts in Glenties Municipal District.
Glenties Municipal District STR Booking Lead Time Analysis (2026)
Average Booking Lead Time by Month
Booking Lead Time Insights for Glenties Municipal District
- The overall average booking lead time for vacation rentals in Glenties Municipal District is 72 days.
- Guests book furthest in advance for stays during July (average 117 days), likely coinciding with peak travel demand or local events.
- The shortest booking windows occur for stays in February (average 34 days), indicating more last-minute travel plans during this time.
- Seasonally, Summer (101 days avg.) sees the longest lead times, while Winter (53 days avg.) has the shortest, reflecting typical travel planning cycles.
Recommendations for Hosts
- Use the overall average lead time (72 days) as a baseline for your pricing and availability strategy in Glenties Municipal District.
- For July stays, consider implementing length-of-stay discounts or slightly higher rates for bookings made less than 117 days out to capitalize on advance planning.
- Target marketing efforts for the Summer season well in advance (at least 101 days) to capture early planners.
- Monitor your own booking lead times against these Glenties Municipal District averages to identify opportunities for dynamic pricing adjustments.
Popular & Essential Airbnb Amenities in Glenties Municipal District (2026)
Amenity Prevalence
Amenity Insights for Glenties Municipal District
- Essential amenities in Glenties Municipal District that guests expect include: Heating. Lacking these (this) could significantly impact bookings.
- Popular amenities like Smoke alarm, Free parking on premises, Kitchen are common but not universal. Offering these can provide a competitive edge.
- Warning: Wifi is not universally provided but is considered essential globally. Ensure reliable Wifi is offered.
Recommendations for Hosts
- Ensure your listing includes all essential amenities for Glenties Municipal District: Heating.
- Prioritize adding missing essentials: Heating.
- Consider adding popular differentiators like Smoke alarm or Free parking on premises to increase appeal.
- Highlight unique or less common amenities you offer (e.g., hot tub, dedicated workspace, EV charger) in your listing description and photos.
- Regularly check competitor amenities in Glenties Municipal District to stay competitive.
Glenties Municipal District Airbnb Guest Demographics & Profile Analysis (2026)
Guest Profile Summary for Glenties Municipal District
- The typical guest profile for Airbnb in Glenties Municipal District consists of predominantly international visitors (76%), with top international origins including Ireland, typically belonging to the Post-2000s (Gen Z/Alpha) group (50%), primarily speaking English or French.
- Domestic travelers account for 24.5% of guests.
- Key international markets include United Kingdom (46.2%) and Ireland (24.5%).
- Top languages spoken are English (56.9%) followed by French (10%).
- A significant demographic segment is the Post-2000s (Gen Z/Alpha) group, representing 50% of guests.
Recommendations for Hosts
- Focus marketing internationally, particularly towards travelers from Ireland.
- Tailor amenities and listing descriptions to appeal to the dominant Post-2000s (Gen Z/Alpha) demographic (e.g., highlight fast WiFi, smart home features, local guides).
- Highlight unique local experiences or amenities relevant to the primary guest profile.
- Consider seasonal promotions aligned with peak travel times for key origin markets.
Nearby Short-Term Rental Market Comparison
How does the Glenties Municipal District Airbnb market stack up against its neighbors? Compare key performance metrics like average monthly revenue, ADR, and occupancy rates in surrounding areas to understand the broader regional STR landscape.
| Market | Active Properties | Monthly Revenue | Daily Rate | Avg. Occupancy |
|---|---|---|---|---|
| Irvinestown | 10 | $4,091 | $352.70 | 41% |
| Belleek | 13 | $2,558 | $231.56 | 42% |
| Fermanagh and Omagh | 103 | $2,246 | $237.40 | 38% |
| Sligo Municipal Borough District | 215 | $2,116 | $178.11 | 50% |
| Fermanagh | 30 | $2,098 | $259.75 | 35% |
| Kesh | 21 | $1,971 | $228.90 | 34% |
| Enniskillen | 78 | $1,917 | $211.41 | 37% |
| Ballymote-Tubbercurry Municipal District | 193 | $1,847 | $190.74 | 42% |
| Derry/Londonderry | 268 | $1,823 | $171.18 | 42% |
| Letterkenny | 325 | $1,815 | $198.58 | 40% |