Mataram Airbnb Market Analysis 2026: Short Term Rental Data & Vacation Rental Statistics in West Nusa Tenggara, Indonesia
Is Airbnb profitable in Mataram in 2026? Explore comprehensive Airbnb analytics for Mataram, West Nusa Tenggara, Indonesia to uncover income potential. This 2026 STR market report for Mataram, based on AirROI data from February 2025 to January 2026, reveals key trends in the niche market of 30 active listings.
Whether you're considering an Airbnb investment in Mataram, optimizing your existing vacation rental, or exploring rental arbitrage opportunities, understanding the Mataram Airbnb data is crucial. Leveraging the low regulation environment is key to maximizing your short term rental income potential. Let's dive into the specifics.
Key Mataram Airbnb Performance Metrics Overview
Monthly Airbnb Revenue Variations & Income Potential in Mataram (2026)
Understanding the monthly revenue variations for Airbnb listings in Mataram is key to maximizing your short term rental income potential. Seasonality significantly impacts earnings. Our analysis, based on data from the past 12 months, shows that the peak revenue month for STRs in Mataram is typically August, while January often presents the lowest earnings, highlighting opportunities for strategic pricing adjustments during shoulder and low seasons. Explore the typical Airbnb income in Mataram across different performance tiers:
- Best-in-class properties (Top 10%) achieve $897+ monthly, often utilizing dynamic pricing and superior guest experiences.
- Strong performing properties (Top 25%) earn $389 or more, indicating effective management and desirable locations/amenities.
- Typical properties (Median) generate around $171 per month, representing the average market performance.
- Entry-level properties (Bottom 25%) see earnings around $70, often with potential for optimization.
Average Monthly Airbnb Earnings Trend in Mataram
Mataram Airbnb Occupancy Rate Trends (2026)
Maximize your bookings by understanding the Mataram STR occupancy trends. Seasonal demand shifts significantly influence how often properties are booked. Typically, Augustsees the highest demand (peak season occupancy), while January experiences the lowest (low season). Effective strategies, like adjusting minimum stays or offering promotions, can boost occupancy during slower periods. Here's how different property tiers perform in Mataram:
- Best-in-class properties (Top 10%) achieve 57%+ occupancy, indicating high desirability and potentially optimized availability.
- Strong performing properties (Top 25%) maintain 36% or higher occupancy, suggesting good market fit and guest satisfaction.
- Typical properties (Median) have an occupancy rate around 19%.
- Entry-level properties (Bottom 25%) average 10% occupancy, potentially facing higher vacancy.
Average Monthly Occupancy Rate Trend in Mataram
Average Daily Rate (ADR) Airbnb Trends in Mataram (2026)
Effective short term rental pricing strategy in Mataram involves understanding monthly ADR fluctuations. The Average Daily Rate (ADR) for Airbnb in Mataram typically peaks in September and dips lowest during February. Leveraging Airbnb dynamic pricing tools or strategies based on this seasonality can significantly boost revenue. Here's a look at the typical nightly rates achieved:
- Best-in-class properties (Top 10%) command rates of $84+ per night, often due to premium features or locations.
- Strong performing properties (Top 25%) achieve nightly rates of $49 or more.
- Typical properties (Median) charge around $27 per night.
- Entry-level properties (Bottom 25%) earn around $18 per night.
Average Daily Rate (ADR) Trend by Month in Mataram
Get Live Mataram Market Intelligence 👇

Explore Real-time Analytics
Airbnb Seasonality Analysis & Trends in Mataram (2026)
Peak Season (August, July, September)
- Revenue averages $593 per month
- Occupancy rates average 31.3%
- Daily rates average $44
Shoulder Season
- Revenue averages $305 per month
- Occupancy maintains around 24.7%
- Daily rates hold near $41
Low Season (January, May, December)
- Revenue drops to average $196 per month
- Occupancy decreases to average 21.4%
- Daily rates adjust to average $42
Seasonality Insights for Mataram
- The Airbnb seasonality in Mataram shows highly seasonal trends requiring careful strategy. While the sections above show seasonal averages, it's also insightful to look at the extremes:
- During the high season, the absolute peak month showcases Mataram's highest earning potential, with monthly revenues capable of climbing to $766, occupancy reaching a high of 33.7%, and ADRs peaking at $45.
- Conversely, the slowest single month of the year, typically falling within the low season, marks the market's lowest point. In this month, revenue might dip to $173, occupancy could drop to 18.9%, and ADRs may adjust down to $40.
- Understanding both the seasonal averages and these monthly peaks and troughs in revenue, occupancy, and ADR is crucial for maximizing your Airbnb profit potential in Mataram.
Seasonal Strategies for Maximizing Profit
- Peak Season: Maximize revenue through premium pricing and potentially longer minimum stays. Ensure high availability.
- Low Season: Offer competitive pricing, special promotions (e.g., extended stay discounts), and flexible cancellation policies. Target off-season travelers like remote workers or budget-conscious guests.
- Shoulder Seasons: Implement dynamic pricing that balances peak and low rates. Target weekend travelers or specific events. Offer slightly more flexible terms than peak season.
- Regularly analyze your own performance against these Mataram seasonality benchmarks and adjust your pricing and availability strategy accordingly.
Best Areas for Airbnb Investment in Mataram (2026)
Exploring the top neighborhoods for short-term rentals in Mataram? This section highlights key areas, outlining why they are attractive for hosts and guests, along with notable local attractions. Consider these locations based on your target guest profile and investment strategy.
| Neighborhood / Area | Why Host Here? (Target Guests & Appeal) | Key Attractions & Landmarks |
|---|---|---|
| Gili Trawangan | A popular island destination known for its beautiful beaches, vibrant nightlife, and water activities. It's a top choice for tourists and backpackers looking for a tropical getaway nearby Mataram. | Gili Trawangan Beach, Snorkeling around the Gili Islands, Gili Trawangan Night Market, Biking around the island, Diving spots, Beach bars and clubs |
| Pemenang | Home to several popular resorts and close to the Gili Islands, Pemenang offers a quiet retreat with access to stunning beaches and local culture. | Mahameru Waterfall, Senggigi Beach, Local markets, Authentic dining experiences, Traditional arts and crafts, Access to Lombok Island tours |
| Senggigi | Known for its beautiful sunsets and beaches, Senggigi is one of the most visited tourist spots in Lombok, ideal for relaxation and enjoying water sports. | Senggigi Beach, Kerandangan Beach, Pura Batu Bolong, Senggigi Art Market, Water sports activities, Lombok Sunset |
| Lombok Tengah | A region with access to cultural sites and natural beauty, making it ideal for tourists seeking experiences beyond the beach. | Kuta Beach, Tanjung Aan Beach, Mandalika Circuit, Local rice fields, Traditional Sasak villages, Surfing spots |
| Mataram City | The capital city offering a mix of local culture, history, and modern amenities. It attracts visitors for business and leisure, and provides a unique urban experience. | Mataram Mall, Mayura Water Palace, Lombok Epicentrum Mall, Local culinary experiences, Cultural shows, Traditional markets |
| Kuta Lombok | Famous for its stunning beaches and surf spots, Kuta Lombok is a rising star among travelers looking for adventure and pristine landscapes. | Kuta Beach, Tanjung Aan Beach, Selong Belanak Beach, Surfing lessons, Local dining and shopping, Scenic viewpoints |
| Gili Meno | The quietest of the Gili Islands, Gili Meno is perfect for couples and families looking for a peaceful retreat. It boasts beautiful beaches and snorkeling opportunities. | Gili Meno Beach, Meno Wall for snorkeling, Bird Park, Relaxing beach clubs, Boat trips, Island hopping tours |
| Narmada | A historical park that showcases the culture and heritage of Lombok; popular for visitors interested in history and local traditions. | Narmada Park, Lombok's ancient temples, Cultural performances, Traditional Lombok gardens, Local food markets, Hiking nearby hills |
Understanding Airbnb License Requirements & STR Laws in Mataram (2026)
While Mataram, West Nusa Tenggara, Indonesia currently shows low STR regulations, specific Airbnb license requirements might still exist or change. Always verify the latest short term rental regulations and Airbnb license requirements directly with local government authorities for Mataram to ensure full compliance before hosting.
(Source: AirROI data, 2026, based on 3% licensed listings)
Top Performing Airbnb Properties in Mataram (2026)
Benchmark your potential! Explore examples of top-performing Airbnb properties in Matarambased on Trailing Twelve Month (TTM) revenue. Analyze their characteristics, revenue, occupancy rate, and ADR to understand what drives success in this market.
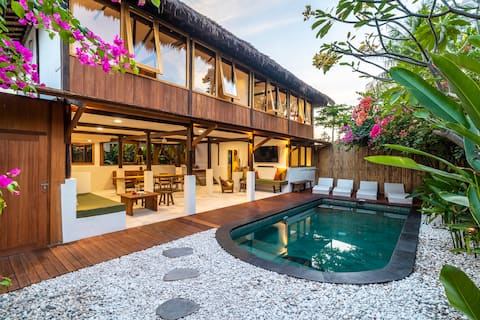
Villa Tiga - Spacious 3-Bedroom Villa with Pool
Entire Place • 3 bedrooms
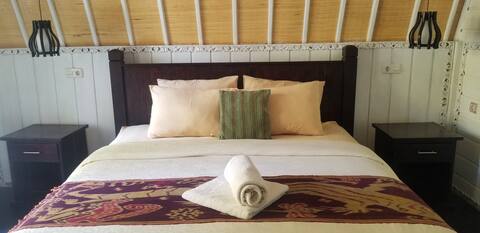
gili barn bungalows
Private Room • N/A
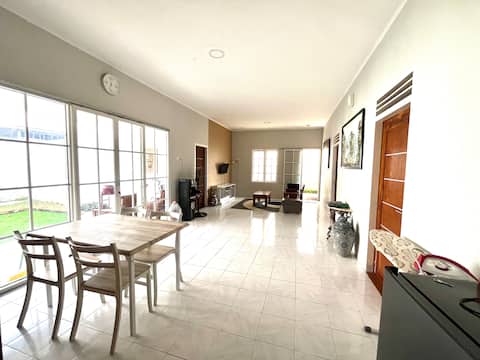
Parana guest house, a house in the center of mataram
Entire Place • 3 bedrooms

Tiny House@Dewi Sri Guesthouse
Entire Place • 1 bedroom
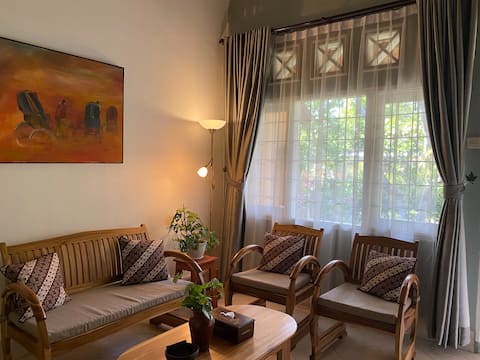
Garden House, Guest House Near Mataram & Senggigi
Entire Place • 1 bedroom
Bayconur villa indah
Entire Place • 4 bedrooms
Note: Performance varies based on location, size, amenities, seasonality, and management quality. Data reflects the past 12 months.
Top Performing Airbnb Hosts in Mataram (2026)
Learn from the best! This table showcases top-performing Airbnb hosts in Mataram based on the number of properties managed and estimated total revenue over the past year. Analyze their scale and performance metrics.
| Host Name | Properties | Grossing Revenue | Stay Reviews | Avg Rating |
|---|---|---|---|---|
| Robi | 1 | $25,425 | 62 | 4.60/5.0 |
| Hanan | 1 | $7,837 | 15 | 4.93/5.0 |
| Chris & Dewi | 4 | $7,591 | 50 | 4.85/5.0 |
| Jean Michel | 2 | $4,090 | 34 | 4.68/5.0 |
| Kiky | 1 | $3,769 | 19 | 4.74/5.0 |
| Putri Gita | 1 | $3,369 | 28 | 5.00/5.0 |
| Host #532628247 | 1 | $3,070 | 1 | Not Rated |
| James | 1 | $2,875 | 6 | 3.17/5.0 |
| Ardian | 1 | $2,404 | 7 | 5.00/5.0 |
| Delavie | 1 | $2,155 | 1 | Not Rated |
Analyzing the strategies of top hosts, such as their property selection, pricing, and guest communication, can offer valuable lessons for optimizing your own Airbnb operations in Mataram.
Dive Deeper: Advanced Mataram STR Market Data (2026)
Ready to unlock more insights? AirROI provides access to advanced metrics and comprehensive Airbnb data for Mataram. Explore detailed analytics beyond this report to refine your investment strategy, optimize pricing, and maximize your vacation rental profits.
Explore Advanced MetricsMataram Short-Term Rental Market Composition (2026): Property & Room Types
Room Type Distribution
Property Type Distribution
Market Composition Insights for Mataram
- The Mataram Airbnb market composition is heavily skewed towards Entire Home/Apt listings, which make up 66.7% of the 30 active rentals. This indicates strong guest preference for privacy and space.
- However, a notable 33.3% share for Private Rooms suggests opportunities for budget-conscious travelers or hosts renting out spare rooms.
- Looking at the property type distribution in Mataram, House properties are the most common (53.3%), reflecting the local real estate landscape.
- Houses represent a significant 53.3% portion, catering likely to families or larger groups.
- The presence of 33.3% Hotel/Boutique listings indicates integration with traditional hospitality.
- Smaller segments like outdoor/unique (combined 3.3%) offer potential for unique stay experiences.
Mataram Airbnb Room Capacity Analysis (2026): Bedroom Distribution
Distribution of Listings by Number of Bedrooms
Room Capacity Insights for Mataram
- The dominant room capacity in Mataram is 1 bedroom listings, making up 60% of the market. This suggests a strong demand for properties suitable for couples or solo travelers.
- Together, 1 bedroom and 3 bedrooms properties represent 80.0% of the active Airbnb listings in Mataram, indicating a high concentration in these sizes.
- With over half the market (60%) consisting of studios or 1-bedroom units, Mataram is particularly well-suited for individuals or couples.
- A significant 23.3% of listings offer 3+ bedrooms, catering to larger groups and families seeking more space in Mataram.
Mataram Vacation Rental Guest Capacity Trends (2026)
Distribution of Listings by Guest Capacity
Guest Capacity Insights for Mataram
- The most common guest capacity trend in Mataram vacation rentals is listings accommodating 2 guests (50%). This suggests the primary traveler segment is likely couples or solo travelers.
- Properties designed for 2 guests and 6 guests dominate the Mataram STR market, accounting for 73.3% of listings.
- A significant 53.3% of listings cater specifically to 1-2 guests, highlighting strong demand from couples and solo travelers in Mataram.
- 26.6% of properties accommodate 6+ guests, serving the market segment for larger families or group travel in Mataram.
- On average, properties in Mataram are equipped to host 3.2 guests.
Mataram Airbnb Booking Patterns (2026): Available vs. Booked Days
Available Days Distribution
Booked Days Distribution
Booking Pattern Insights for Mataram
- The most common availability pattern in Mataram falls within the 271-366 days range, representing 76.7% of listings. This suggests many properties have significant open periods on their calendars.
- Approximately 100.0% of listings show high availability (181+ days open annually), indicating potential for increased bookings or specific owner usage patterns.
- For booked days, the 1-30 days range is most frequent in Mataram (40%), reflecting common guest stay durations or potential owner blocking patterns.
Mataram Airbnb Minimum Stay Requirements Analysis
Distribution of Listings by Minimum Night Requirement
1 Night
22 listings
73.3% of total
2 Nights
4 listings
13.3% of total
30+ Nights
4 listings
13.3% of total
Key Insights
- The most prevalent minimum stay requirement in Mataram is 1 Night, adopted by 73.3% of listings. This highlights the market's preference for shorter, flexible bookings.
- A strong majority (86.6%) of the Mataram Airbnb data shows acceptance of very short stays (1-2 nights), indicating a dynamic, high-turnover market.
- A significant segment (13.3%) caters to monthly stays (30+ nights) in Mataram, pointing to opportunities in the extended-stay market.
Recommendations
- Align with the market by considering a 1 Night minimum stay, as 73.3% of Mataram hosts use this setting.
- Explore offering discounts for stays of 30+ nights to attract the 13.3% of the market seeking extended stays.
- Adjust minimum nights based on seasonality – potentially shorter during low season and longer during peak demand periods in Mataram.
Mataram Airbnb Cancellation Policy Trends Analysis (2026)
Flexible
18 listings
60% of total
Moderate
6 listings
20% of total
Firm
1 listings
3.3% of total
Strict
5 listings
16.7% of total
Cancellation Policy Insights for Mataram
- The prevailing Airbnb cancellation policy trend in Mataram is Flexible, used by 60% of listings.
- The market strongly favors guest-friendly terms, with 80.0% of listings offering Flexible or Moderate policies. This suggests guests in Mataram may expect booking flexibility.
Recommendations for Hosts
- Consider adopting a Flexible policy to align with the 60% market standard in Mataram.
- Given the high prevalence of Flexible policies (60%), offering this can enhance booking appeal, especially during shoulder seasons.
- Regularly review your cancellation policy against competitors and market demand shifts in Mataram.
Mataram STR Booking Lead Time Analysis (2026)
Average Booking Lead Time by Month
Booking Lead Time Insights for Mataram
- The overall average booking lead time for vacation rentals in Mataram is 25 days.
- Guests book furthest in advance for stays during August (average 36 days), likely coinciding with peak travel demand or local events.
- The shortest booking windows occur for stays in November (average 7 days), indicating more last-minute travel plans during this time.
- Seasonally, Summer (30 days avg.) sees the longest lead times, while Winter (18 days avg.) has the shortest, reflecting typical travel planning cycles.
Recommendations for Hosts
- Use the overall average lead time (25 days) as a baseline for your pricing and availability strategy in Mataram.
- For August stays, consider implementing length-of-stay discounts or slightly higher rates for bookings made less than 36 days out to capitalize on advance planning.
- During November, focus on last-minute booking availability and promotions, as guests book with very short notice (7 days avg.).
- Target marketing efforts for the Summer season well in advance (at least 30 days) to capture early planners.
- Monitor your own booking lead times against these Mataram averages to identify opportunities for dynamic pricing adjustments.
Popular & Essential Airbnb Amenities in Mataram (2026)
Amenity Prevalence
Amenity Insights for Mataram
- Essential amenities in Mataram that guests expect include: Air conditioning. Lacking these (this) could significantly impact bookings.
- Popular amenities like Wifi, TV, Free parking on premises are common but not universal. Offering these can provide a competitive edge.
- Warning: Wifi is not universally provided but is considered essential globally. Ensure reliable Wifi is offered.
Recommendations for Hosts
- Ensure your listing includes all essential amenities for Mataram: Air conditioning.
- Prioritize adding missing essentials: Air conditioning.
- Consider adding popular differentiators like Wifi or TV to increase appeal.
- Highlight unique or less common amenities you offer (e.g., hot tub, dedicated workspace, EV charger) in your listing description and photos.
- Regularly check competitor amenities in Mataram to stay competitive.
Mataram Airbnb Guest Demographics & Profile Analysis (2026)
Guest Profile Summary for Mataram
- The typical guest profile for Airbnb in Mataram consists of predominantly international visitors (91%), with top international origins including Australia, typically belonging to the Post-2000s (Gen Z/Alpha) group (50%), primarily speaking English or French.
- Domestic travelers account for 8.8% of guests.
- Key international markets include France (17.5%) and Australia (14%).
- Top languages spoken are English (43%) followed by French (13.9%).
- A significant demographic segment is the Post-2000s (Gen Z/Alpha) group, representing 50% of guests.
Recommendations for Hosts
- Focus marketing internationally, particularly towards travelers from Australia.
- Tailor amenities and listing descriptions to appeal to the dominant Post-2000s (Gen Z/Alpha) demographic (e.g., highlight fast WiFi, smart home features, local guides).
- Highlight unique local experiences or amenities relevant to the primary guest profile.
- Consider seasonal promotions aligned with peak travel times for key origin markets.
Nearby Short-Term Rental Market Comparison
How does the Mataram Airbnb market stack up against its neighbors? Compare key performance metrics like average monthly revenue, ADR, and occupancy rates in surrounding areas to understand the broader regional STR landscape.
| Market | Active Properties | Monthly Revenue | Daily Rate | Avg. Occupancy |
|---|---|---|---|---|
| Pejeng | 11 | $6,447 | $575.53 | 43% |
| Padangaji | 16 | $6,120 | $300.47 | 64% |
| BATAS DESA BATU JANGKIH | 13 | $4,822 | $309.81 | 55% |
| Kecamatan Praya Barat | 30 | $3,939 | $414.82 | 39% |
| Bedulu | 34 | $3,142 | $269.69 | 42% |
| Tangkas | 16 | $2,982 | $276.74 | 30% |
| Pejeng Kawan | 105 | $2,909 | $237.67 | 41% |
| Pecatu | 1,743 | $2,845 | $229.93 | 48% |
| Uluwatu | 30 | $2,806 | $254.53 | 56% |
| Seminyak | 1,680 | $2,790 | $282.61 | 42% |