Lembang Airbnb Market Analysis 2026: Short Term Rental Data & Vacation Rental Statistics in West Java, Indonesia
Is Airbnb profitable in Lembang in 2026? Explore comprehensive Airbnb analytics for Lembang, West Java, Indonesia to uncover income potential. This 2026 STR market report for Lembang, based on AirROI data from February 2025 to January 2026, reveals key trends in the niche market of 64 active listings.
Whether you're considering an Airbnb investment in Lembang, optimizing your existing vacation rental, or exploring rental arbitrage opportunities, understanding the Lembang Airbnb data is crucial. Leveraging the low regulation environment is key to maximizing your short term rental income potential. Let's dive into the specifics.
Key Lembang Airbnb Performance Metrics Overview
Monthly Airbnb Revenue Variations & Income Potential in Lembang (2026)
Understanding the monthly revenue variations for Airbnb listings in Lembang is key to maximizing your short term rental income potential. Seasonality significantly impacts earnings. Our analysis, based on data from the past 12 months, shows that the peak revenue month for STRs in Lembang is typically December, while February often presents the lowest earnings, highlighting opportunities for strategic pricing adjustments during shoulder and low seasons. Explore the typical Airbnb income in Lembang across different performance tiers:
- Best-in-class properties (Top 10%) achieve $1,729+ monthly, often utilizing dynamic pricing and superior guest experiences.
- Strong performing properties (Top 25%) earn $993 or more, indicating effective management and desirable locations/amenities.
- Typical properties (Median) generate around $479 per month, representing the average market performance.
- Entry-level properties (Bottom 25%) see earnings around $213, often with potential for optimization.
Average Monthly Airbnb Earnings Trend in Lembang
Lembang Airbnb Occupancy Rate Trends (2026)
Maximize your bookings by understanding the Lembang STR occupancy trends. Seasonal demand shifts significantly influence how often properties are booked. Typically, Decembersees the highest demand (peak season occupancy), while March experiences the lowest (low season). Effective strategies, like adjusting minimum stays or offering promotions, can boost occupancy during slower periods. Here's how different property tiers perform in Lembang:
- Best-in-class properties (Top 10%) achieve 44%+ occupancy, indicating high desirability and potentially optimized availability.
- Strong performing properties (Top 25%) maintain 28% or higher occupancy, suggesting good market fit and guest satisfaction.
- Typical properties (Median) have an occupancy rate around 16%.
- Entry-level properties (Bottom 25%) average 8% occupancy, potentially facing higher vacancy.
Average Monthly Occupancy Rate Trend in Lembang
Average Daily Rate (ADR) Airbnb Trends in Lembang (2026)
Effective short term rental pricing strategy in Lembang involves understanding monthly ADR fluctuations. The Average Daily Rate (ADR) for Airbnb in Lembang typically peaks in December and dips lowest during January. Leveraging Airbnb dynamic pricing tools or strategies based on this seasonality can significantly boost revenue. Here's a look at the typical nightly rates achieved:
- Best-in-class properties (Top 10%) command rates of $292+ per night, often due to premium features or locations.
- Strong performing properties (Top 25%) achieve nightly rates of $147 or more.
- Typical properties (Median) charge around $100 per night.
- Entry-level properties (Bottom 25%) earn around $62 per night.
Average Daily Rate (ADR) Trend by Month in Lembang
Get Live Lembang Market Intelligence 👇

Explore Real-time Analytics
Airbnb Seasonality Analysis & Trends in Lembang (2026)
Peak Season (December, June, July)
- Revenue averages $1,080 per month
- Occupancy rates average 25.3%
- Daily rates average $140
Shoulder Season
- Revenue averages $731 per month
- Occupancy maintains around 18.3%
- Daily rates hold near $137
Low Season (February, May, August)
- Revenue drops to average $580 per month
- Occupancy decreases to average 18.3%
- Daily rates adjust to average $136
Seasonality Insights for Lembang
- The Airbnb seasonality in Lembang shows highly seasonal trends requiring careful strategy. While the sections above show seasonal averages, it's also insightful to look at the extremes:
- During the high season, the absolute peak month showcases Lembang's highest earning potential, with monthly revenues capable of climbing to $1,306, occupancy reaching a high of 28.7%, and ADRs peaking at $143.
- Conversely, the slowest single month of the year, typically falling within the low season, marks the market's lowest point. In this month, revenue might dip to $560, occupancy could drop to 14.8%, and ADRs may adjust down to $134.
- Understanding both the seasonal averages and these monthly peaks and troughs in revenue, occupancy, and ADR is crucial for maximizing your Airbnb profit potential in Lembang.
Seasonal Strategies for Maximizing Profit
- Peak Season: Maximize revenue through premium pricing and potentially longer minimum stays. Ensure high availability.
- Low Season: Offer competitive pricing, special promotions (e.g., extended stay discounts), and flexible cancellation policies. Target off-season travelers like remote workers or budget-conscious guests.
- Shoulder Seasons: Implement dynamic pricing that balances peak and low rates. Target weekend travelers or specific events. Offer slightly more flexible terms than peak season.
- Regularly analyze your own performance against these Lembang seasonality benchmarks and adjust your pricing and availability strategy accordingly.
Best Areas for Airbnb Investment in Lembang (2026)
Exploring the top neighborhoods for short-term rentals in Lembang? This section highlights key areas, outlining why they are attractive for hosts and guests, along with notable local attractions. Consider these locations based on your target guest profile and investment strategy.
| Neighborhood / Area | Why Host Here? (Target Guests & Appeal) | Key Attractions & Landmarks |
|---|---|---|
| Cihideung | Known for its beautiful tea plantations and cooler climate, Cihideung attracts visitors looking for a serene escape in nature. It's a great area for mountain retreats and eco-friendly stays. | Tea Plantations, Cihideung Flower Market, Farmhouse Susu Lembang, Taman Bunga Cihideung, Lembang Floating Market |
| Kota Lembang | The heart of Lembang, this area features a variety of attractions and is a hub for tourists visiting the region. It's close to many popular sites and is ideal for family-friendly stays. | Lembang Nature Park, Lembang Strawberry Farm, Alun-Alun Lembang, De' Ranch, Floating Market Lembang |
| Parongpong | This area offers stunning views of the surrounding landscape and is known for its villas and upscale accommodations. It's perfect for those looking to invest in luxury Airbnb options. | Villa Isola, Rabbit Town, The Lodge Maribaya, Dusun Bambu, Curug Dago |
| Maribaya | Famous for its hot springs and waterfalls, Maribaya attracts both local residents and tourists seeking relaxation and adventure. An ideal spot for wellness-themed Airbnb stays. | Maribaya Hot Springs, Maribaya Waterfall, Tebing Keraton, Dago Tea House, Kampung Daun |
| Gunung Tangkuban Perahu | This area features the iconic volcano known for its natural beauty and geothermal activity. Great for adventure tourism and people looking for a unique stay experience. | Tangkuban Perahu Crater, Hot Springs, Cikole Orchid Forest, Curug Dago, Puncak Pakuan |
| Lembang Proper | A central location with easy access to dining and shopping, Lembang Proper is a bustling area for tourists wanting convenience and variety in their accommodation choices. | Lembang Markt, Kampung Gajah Wonderland, Cimahi Waterfall, Cafe D’Lembang, Cristal Cave |
| Sersan Bajuri | A popular spot for young travelers and those seeking unique dining experiences. This area combines entertainment with hospitality, making it a great investment for trendy stays. | Sersan Bajuri Restaurant, Koolkost, Sierra Cafe, Lembang Adventure Park, Lembang Sky Lounge |
| Buah Batu | Known for its natural views and quiet atmosphere, Buah Batu offers a peaceful retreat for tourists looking to escape the bustling city life. | Kampung wisata Buah Batu, Bukit Moko, Ciamis Waterfall, Gerbang Sore, Bukit Lembang |
Understanding Airbnb License Requirements & STR Laws in Lembang (2026)
While Lembang, West Java, Indonesia currently shows low STR regulations, specific Airbnb license requirements might still exist or change. Always verify the latest short term rental regulations and Airbnb license requirements directly with local government authorities for Lembang to ensure full compliance before hosting.
(Source: AirROI data, 2026, finding no licensed listings among those analyzed)
Top Performing Airbnb Properties in Lembang (2026)
Benchmark your potential! Explore examples of top-performing Airbnb properties in Lembangbased on Trailing Twelve Month (TTM) revenue. Analyze their characteristics, revenue, occupancy rate, and ADR to understand what drives success in this market.
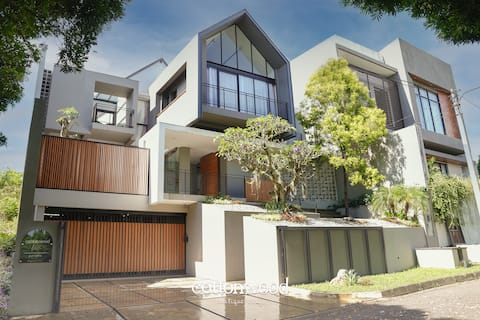
Cottonwood Pavana Heated-Pool BBQ Pingpong Fitness
Entire Place • 5 bedrooms

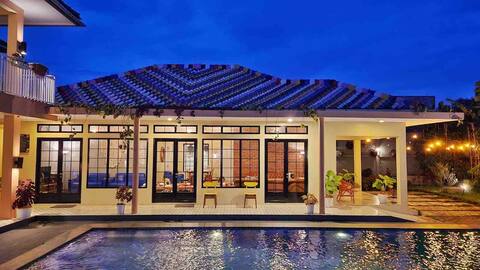
Backyard Villa - Private swimming pool
Entire Place • 4 bedrooms

Villa Azura Lembang for BIG family
Entire Place • 6 bedrooms
Manoko Ville Lembang
Entire Place • 4 bedrooms
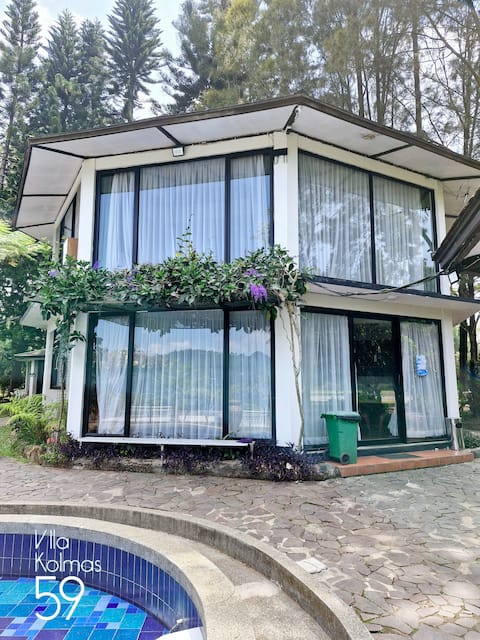
Villa three & four (Lembang, 3-hectare gated community)
Entire Place • 4 bedrooms
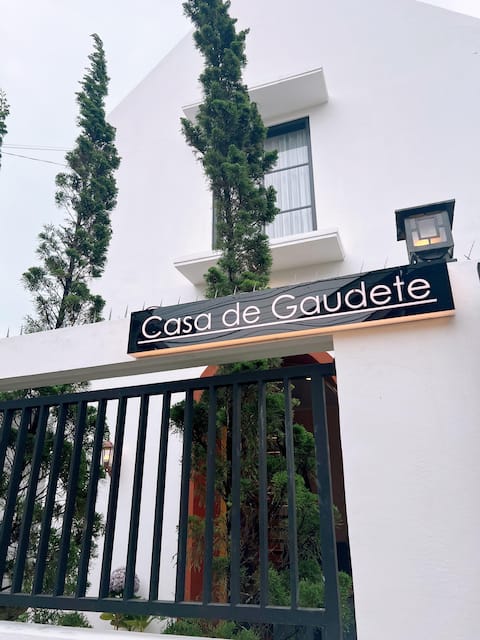
Casa de Gaudete 3 king bed size & 3 Bath Lembang
Entire Place • 3 bedrooms
Note: Performance varies based on location, size, amenities, seasonality, and management quality. Data reflects the past 12 months.
Top Performing Airbnb Hosts in Lembang (2026)
Learn from the best! This table showcases top-performing Airbnb hosts in Lembang based on the number of properties managed and estimated total revenue over the past year. Analyze their scale and performance metrics.
| Host Name | Properties | Grossing Revenue | Stay Reviews | Avg Rating |
|---|---|---|---|---|
| Vila KolMas | 5 | $54,867 | 184 | 4.87/5.0 |
| Teddy | 2 | $39,928 | 63 | 4.92/5.0 |
| Indra | 1 | $30,411 | 49 | 4.84/5.0 |
| Yemima | 1 | $27,469 | 7 | 5.00/5.0 |
| Imapaka | 1 | $25,698 | 168 | 4.74/5.0 |
| Vita And Mike | 1 | $19,479 | 48 | 4.98/5.0 |
| Perry | 1 | $17,339 | 222 | 4.91/5.0 |
| Moh | 3 | $15,779 | 61 | 4.58/5.0 |
| Ninit | 1 | $13,254 | 553 | 4.88/5.0 |
| Rossa | 1 | $11,219 | 67 | 4.94/5.0 |
Analyzing the strategies of top hosts, such as their property selection, pricing, and guest communication, can offer valuable lessons for optimizing your own Airbnb operations in Lembang.
Dive Deeper: Advanced Lembang STR Market Data (2026)
Ready to unlock more insights? AirROI provides access to advanced metrics and comprehensive Airbnb data for Lembang. Explore detailed analytics beyond this report to refine your investment strategy, optimize pricing, and maximize your vacation rental profits.
Explore Advanced MetricsLembang Short-Term Rental Market Composition (2026): Property & Room Types
Room Type Distribution
Property Type Distribution
Market Composition Insights for Lembang
- The Lembang Airbnb market composition is heavily skewed towards Entire Home/Apt listings, which make up 92.2% of the 64 active rentals. This indicates strong guest preference for privacy and space.
- Looking at the property type distribution in Lembang, House properties are the most common (79.7%), reflecting the local real estate landscape.
- Houses represent a significant 79.7% portion, catering likely to families or larger groups.
- The presence of 6.3% Hotel/Boutique listings indicates integration with traditional hospitality.
Lembang Airbnb Room Capacity Analysis (2026): Bedroom Distribution
Distribution of Listings by Number of Bedrooms
Room Capacity Insights for Lembang
- The dominant room capacity in Lembang is 3 bedrooms listings, making up 23.4% of the market. This suggests a strong demand for properties suitable for families or small groups.
- Together, 3 bedrooms and 4 bedrooms properties represent 46.8% of the active Airbnb listings in Lembang, indicating a high concentration in these sizes.
- A significant 64.0% of listings offer 3+ bedrooms, catering to larger groups and families seeking more space in Lembang.
Lembang Vacation Rental Guest Capacity Trends (2026)
Distribution of Listings by Guest Capacity
Guest Capacity Insights for Lembang
- The most common guest capacity trend in Lembang vacation rentals is listings accommodating 8+ guests (67.2%). This suggests the primary traveler segment is likely larger groups.
- Properties designed for 8+ guests and 4 guests dominate the Lembang STR market, accounting for 82.8% of listings.
- 76.6% of properties accommodate 6+ guests, serving the market segment for larger families or group travel in Lembang.
- On average, properties in Lembang are equipped to host 6.8 guests.
Lembang Airbnb Booking Patterns (2026): Available vs. Booked Days
Available Days Distribution
Booked Days Distribution
Booking Pattern Insights for Lembang
- The most common availability pattern in Lembang falls within the 271-366 days range, representing 84.4% of listings. This suggests many properties have significant open periods on their calendars.
- Approximately 96.9% of listings show high availability (181+ days open annually), indicating potential for increased bookings or specific owner usage patterns.
- For booked days, the 1-30 days range is most frequent in Lembang (43.8%), reflecting common guest stay durations or potential owner blocking patterns.
- A notable 3.1% of properties secure long booking periods (181+ days booked per year), highlighting successful long-term rental strategies or significant owner usage.
Lembang Airbnb Minimum Stay Requirements Analysis
Distribution of Listings by Minimum Night Requirement
1 Night
61 listings
95.3% of total
2 Nights
2 listings
3.1% of total
30+ Nights
1 listings
1.6% of total
Key Insights
- The most prevalent minimum stay requirement in Lembang is 1 Night, adopted by 95.3% of listings. This highlights the market's preference for shorter, flexible bookings.
- A strong majority (98.4%) of the Lembang Airbnb data shows acceptance of very short stays (1-2 nights), indicating a dynamic, high-turnover market.
- Dedicated monthly rentals (30+ nights) represent a small niche (1.6%), possibly an untapped area for hosts.
Recommendations
- Align with the market by considering a 1 Night minimum stay, as 95.3% of Lembang hosts use this setting.
- Adjust minimum nights based on seasonality – potentially shorter during low season and longer during peak demand periods in Lembang.
Lembang Airbnb Cancellation Policy Trends Analysis (2026)
Flexible
16 listings
25% of total
Moderate
14 listings
21.9% of total
Firm
27 listings
42.2% of total
Strict
7 listings
10.9% of total
Cancellation Policy Insights for Lembang
- The prevailing Airbnb cancellation policy trend in Lembang is Firm, used by 42.2% of listings.
- A majority (53.1%) of hosts in Lembang utilize Firm or Strict policies, indicating a market where hosts prioritize booking security.
Recommendations for Hosts
- Consider adopting a Firm policy to align with the 42.2% market standard in Lembang.
- Using a Strict policy might deter some guests, as only 10.9% of listings use it. Evaluate if potential revenue protection outweighs possible lower booking rates.
- Regularly review your cancellation policy against competitors and market demand shifts in Lembang.
Lembang STR Booking Lead Time Analysis (2026)
Average Booking Lead Time by Month
Booking Lead Time Insights for Lembang
- The overall average booking lead time for vacation rentals in Lembang is 20 days.
- Guests book furthest in advance for stays during March (average 31 days), likely coinciding with peak travel demand or local events.
- The shortest booking windows occur for stays in June (average 16 days), indicating more last-minute travel plans during this time.
- Seasonally, Spring (23 days avg.) sees the longest lead times, while Summer (16 days avg.) has the shortest, reflecting typical travel planning cycles.
Recommendations for Hosts
- Use the overall average lead time (20 days) as a baseline for your pricing and availability strategy in Lembang.
- For March stays, consider implementing length-of-stay discounts or slightly higher rates for bookings made less than 31 days out to capitalize on advance planning.
- Target marketing efforts for the Spring season well in advance (at least 23 days) to capture early planners.
- Monitor your own booking lead times against these Lembang averages to identify opportunities for dynamic pricing adjustments.
Popular & Essential Airbnb Amenities in Lembang (2026)
Amenity Prevalence
Amenity Insights for Lembang
- Essential amenities in Lembang that guests expect include: Free parking on premises, Wifi, TV. Lacking these (any) could significantly impact bookings.
- Popular amenities like Hot water, Kitchen, Refrigerator are common but not universal. Offering these can provide a competitive edge.
Recommendations for Hosts
- Ensure your listing includes all essential amenities for Lembang: Free parking on premises, Wifi, TV.
- Prioritize adding missing essentials: Wifi, TV.
- Consider adding popular differentiators like Hot water or Kitchen to increase appeal.
- Highlight unique or less common amenities you offer (e.g., hot tub, dedicated workspace, EV charger) in your listing description and photos.
- Regularly check competitor amenities in Lembang to stay competitive.
Lembang Airbnb Guest Demographics & Profile Analysis (2026)
Guest Profile Summary for Lembang
- The typical guest profile for Airbnb in Lembang consists of primarily domestic travelers (75%), often arriving from nearby Jakarta, typically belonging to the Post-2000s (Gen Z/Alpha) group (50%), primarily speaking English or Indonesian.
- Domestic travelers account for 74.5% of guests.
- Key international markets include Indonesia (74.5%) and United States (6.4%).
- Top languages spoken are English (44.1%) followed by Indonesian (40.7%).
- A significant demographic segment is the Post-2000s (Gen Z/Alpha) group, representing 50% of guests.
Recommendations for Hosts
- Target domestic marketing efforts towards travelers from Jakarta and Special Capital Region of Jakarta.
- Tailor amenities and listing descriptions to appeal to the dominant Post-2000s (Gen Z/Alpha) demographic (e.g., highlight fast WiFi, smart home features, local guides).
- Highlight unique local experiences or amenities relevant to the primary guest profile.
- Consider seasonal promotions aligned with peak travel times for key origin markets.
Nearby Short-Term Rental Market Comparison
How does the Lembang Airbnb market stack up against its neighbors? Compare key performance metrics like average monthly revenue, ADR, and occupancy rates in surrounding areas to understand the broader regional STR landscape.
| Market | Active Properties | Monthly Revenue | Daily Rate | Avg. Occupancy |
|---|---|---|---|---|
| Kuta | 10 | $2,046 | $149.05 | 45% |
| Sukagalih | 13 | $1,306 | $157.45 | 34% |
| Citaringgul | 21 | $1,285 | $142.78 | 30% |
| Sukamanah | 12 | $1,151 | $148.28 | 28% |
| Ciburial | 191 | $1,114 | $288.50 | 18% |
| Leuwimalang | 15 | $1,109 | $203.41 | 20% |
| Wangunsari | 17 | $1,094 | $158.69 | 23% |
| Cigugur Girang | 21 | $1,057 | $163.07 | 19% |
| Sumur Batu | 50 | $1,026 | $180.80 | 21% |
| Kecamatan Parongpong | 14 | $1,014 | $182.15 | 23% |