Gadog Airbnb Market Analysis 2026: Short Term Rental Data & Vacation Rental Statistics in West Java, Indonesia
Is Airbnb profitable in Gadog in 2026? Explore comprehensive Airbnb analytics for Gadog, West Java, Indonesia to uncover income potential. This 2026 STR market report for Gadog, based on AirROI data from February 2025 to January 2026, reveals key trends in the niche market of 88 active listings.
Whether you're considering an Airbnb investment in Gadog, optimizing your existing vacation rental, or exploring rental arbitrage opportunities, understanding the Gadog Airbnb data is crucial. Leveraging the low regulation environment is key to maximizing your short term rental income potential. Let's dive into the specifics.
Key Gadog Airbnb Performance Metrics Overview
Monthly Airbnb Revenue Variations & Income Potential in Gadog (2026)
Understanding the monthly revenue variations for Airbnb listings in Gadog is key to maximizing your short term rental income potential. Seasonality significantly impacts earnings. Our analysis, based on data from the past 12 months, shows that the peak revenue month for STRs in Gadog is typically December, while October often presents the lowest earnings, highlighting opportunities for strategic pricing adjustments during shoulder and low seasons. Explore the typical Airbnb income in Gadog across different performance tiers:
- Best-in-class properties (Top 10%) achieve $2,311+ monthly, often utilizing dynamic pricing and superior guest experiences.
- Strong performing properties (Top 25%) earn $1,236 or more, indicating effective management and desirable locations/amenities.
- Typical properties (Median) generate around $698 per month, representing the average market performance.
- Entry-level properties (Bottom 25%) see earnings around $353, often with potential for optimization.
Average Monthly Airbnb Earnings Trend in Gadog
Gadog Airbnb Occupancy Rate Trends (2026)
Maximize your bookings by understanding the Gadog STR occupancy trends. Seasonal demand shifts significantly influence how often properties are booked. Typically, Decembersees the highest demand (peak season occupancy), while March experiences the lowest (low season). Effective strategies, like adjusting minimum stays or offering promotions, can boost occupancy during slower periods. Here's how different property tiers perform in Gadog:
- Best-in-class properties (Top 10%) achieve 32%+ occupancy, indicating high desirability and potentially optimized availability.
- Strong performing properties (Top 25%) maintain 23% or higher occupancy, suggesting good market fit and guest satisfaction.
- Typical properties (Median) have an occupancy rate around 13%.
- Entry-level properties (Bottom 25%) average 7% occupancy, potentially facing higher vacancy.
Average Monthly Occupancy Rate Trend in Gadog
Average Daily Rate (ADR) Airbnb Trends in Gadog (2026)
Effective short term rental pricing strategy in Gadog involves understanding monthly ADR fluctuations. The Average Daily Rate (ADR) for Airbnb in Gadog typically peaks in December and dips lowest during November. Leveraging Airbnb dynamic pricing tools or strategies based on this seasonality can significantly boost revenue. Here's a look at the typical nightly rates achieved:
- Best-in-class properties (Top 10%) command rates of $316+ per night, often due to premium features or locations.
- Strong performing properties (Top 25%) achieve nightly rates of $228 or more.
- Typical properties (Median) charge around $142 per night.
- Entry-level properties (Bottom 25%) earn around $105 per night.
Average Daily Rate (ADR) Trend by Month in Gadog
Get Live Gadog Market Intelligence 👇

Explore Real-time Analytics
Airbnb Seasonality Analysis & Trends in Gadog (2026)
Peak Season (December, July, April)
- Revenue averages $1,532 per month
- Occupancy rates average 21.2%
- Daily rates average $188
Shoulder Season
- Revenue averages $1,066 per month
- Occupancy maintains around 16.3%
- Daily rates hold near $182
Low Season (March, September, October)
- Revenue drops to average $789 per month
- Occupancy decreases to average 11.8%
- Daily rates adjust to average $182
Seasonality Insights for Gadog
- The Airbnb seasonality in Gadog shows highly seasonal trends requiring careful strategy. While the sections above show seasonal averages, it's also insightful to look at the extremes:
- During the high season, the absolute peak month showcases Gadog's highest earning potential, with monthly revenues capable of climbing to $1,700, occupancy reaching a high of 24.8%, and ADRs peaking at $194.
- Conversely, the slowest single month of the year, typically falling within the low season, marks the market's lowest point. In this month, revenue might dip to $734, occupancy could drop to 11.5%, and ADRs may adjust down to $179.
- Understanding both the seasonal averages and these monthly peaks and troughs in revenue, occupancy, and ADR is crucial for maximizing your Airbnb profit potential in Gadog.
Seasonal Strategies for Maximizing Profit
- Peak Season: Maximize revenue through premium pricing and potentially longer minimum stays. Ensure high availability.
- Low Season: Offer competitive pricing, special promotions (e.g., extended stay discounts), and flexible cancellation policies. Target off-season travelers like remote workers or budget-conscious guests.
- Shoulder Seasons: Implement dynamic pricing that balances peak and low rates. Target weekend travelers or specific events. Offer slightly more flexible terms than peak season.
- Regularly analyze your own performance against these Gadog seasonality benchmarks and adjust your pricing and availability strategy accordingly.
Best Areas for Airbnb Investment in Gadog (2026)
Exploring the top neighborhoods for short-term rentals in Gadog? This section highlights key areas, outlining why they are attractive for hosts and guests, along with notable local attractions. Consider these locations based on your target guest profile and investment strategy.
| Neighborhood / Area | Why Host Here? (Target Guests & Appeal) | Key Attractions & Landmarks |
|---|---|---|
| Puncak | A popular highland destination known for its cool climate and stunning tea plantations. Ideal for tourists seeking a nature retreat. | Tea plantations, Taman Safari Indonesia, Cipanas hot springs, Gunung Mas, Pasar Apung |
| Bogor | A city with a rich heritage and beautiful botanical gardens. Great for families and tourists who want to experience nature and local culture. | Bogor Botanical Gardens, Istana Bogor, Kebun Raya Bogor, Kuntum Farmfield, Taman Safari Indonesia |
| Sentul | A developing area close to Bogor known for its outdoor activities and resorts, attracting adventure seekers and families. | Sentul International Circuit, Waterpark, JungleLand Adventure Theme Park, Gunung Pancar, Taman Budaya Sentul |
| Cisarua | Known for its lush landscapes and tourist-friendly attractions, perfect for weekend getaways from Jakarta. | Taman Wisata Matahari, Little Venice Puncak, Cisarua Safari Park, Kebun Teh Cisarua, Puncak Pass |
| Lembang | A subdistrict of Bandung with cooler temperatures, famous for its family-friendly attractions and beautiful scenery. | Farmhouse Lembang, Orchid Forest Cikole, Dusun Bambu, Kota Mini Lembang, Sierra Café |
| Cibubur | Strategically located near Jakarta, popular with families looking for a more residential yet accessible getaway. | Cibubur Junction, Taman Mini Indonesia Indah, Water world, Rabbit Park, Lakeside, Tanah Merah |
| Tangerang | A fast-developing urban area with easy access to the capital city, appealing to business travelers and urban explorers. | Summarecon Mall Serpong, Citra Raya World of Wonders, Scientia Garden, Tama City, AEON Mall |
| Anyer | A beach destination known for its resorts and water activities, perfect for tourists looking for a seaside vacation. | Anyer Beach, Carita Beach, Cilegon City, White Sands Beach, Pulau Sangiang |
Understanding Airbnb License Requirements & STR Laws in Gadog (2026)
While Gadog, West Java, Indonesia currently shows low STR regulations, specific Airbnb license requirements might still exist or change. Always verify the latest short term rental regulations and Airbnb license requirements directly with local government authorities for Gadog to ensure full compliance before hosting.
(Source: AirROI data, 2026, finding no licensed listings among those analyzed)
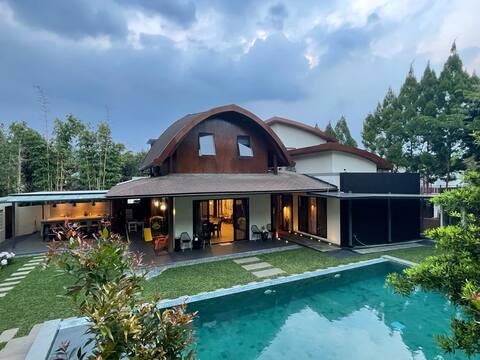
Top Performing Airbnb Properties in Gadog (2026)
Benchmark your potential! Explore examples of top-performing Airbnb properties in Gadogbased on Trailing Twelve Month (TTM) revenue. Analyze their characteristics, revenue, occupancy rate, and ADR to understand what drives success in this market.

Vimalla hills - 6BR+4SB Private Pool, Billiards
Entire Place • 6 bedrooms
Villa Vimala Argopuro Elok AE2-20
Entire Place • 7 bedrooms

Luxury Villa Midori | Private Pool & Jacuzzi
Entire Place • 8 bedrooms

Extravaganza 5 Bedroom Private Pool Vimala Hills
Entire Place • 5 bedrooms

Mountain View! Villa Amerta 5BR at Vimala Hills
Entire Place • 5 bedrooms

Villa 4BR Private Pool Vimala Hills By Villaire
Entire Place • 4 bedrooms
Note: Performance varies based on location, size, amenities, seasonality, and management quality. Data reflects the past 12 months.
Top Performing Airbnb Hosts in Gadog (2026)
Learn from the best! This table showcases top-performing Airbnb hosts in Gadog based on the number of properties managed and estimated total revenue over the past year. Analyze their scale and performance metrics.
| Host Name | Properties | Grossing Revenue | Stay Reviews | Avg Rating |
|---|---|---|---|---|
| Ivana | 10 | $129,073 | 256 | 4.83/5.0 |
| Cindy | 2 | $67,629 | 7 | 5.00/5.0 |
| Revy | 1 | $62,615 | 77 | 4.83/5.0 |
| Anitya | 5 | $58,625 | 112 | 4.96/5.0 |
| Eline | 3 | $57,720 | 136 | 4.87/5.0 |
| Calistha | 1 | $56,315 | 14 | 4.93/5.0 |
| Jessenia | 1 | $23,448 | 11 | 4.91/5.0 |
| Annastacia | 1 | $20,745 | 8 | 5.00/5.0 |
| Joanne | 2 | $19,860 | 130 | 4.83/5.0 |
| Gunawan | 4 | $19,744 | 122 | 4.79/5.0 |
Analyzing the strategies of top hosts, such as their property selection, pricing, and guest communication, can offer valuable lessons for optimizing your own Airbnb operations in Gadog.
Dive Deeper: Advanced Gadog STR Market Data (2026)
Ready to unlock more insights? AirROI provides access to advanced metrics and comprehensive Airbnb data for Gadog. Explore detailed analytics beyond this report to refine your investment strategy, optimize pricing, and maximize your vacation rental profits.
Explore Advanced MetricsGadog Short-Term Rental Market Composition (2026): Property & Room Types
Room Type Distribution
Property Type Distribution
Market Composition Insights for Gadog
- The Gadog Airbnb market composition is heavily skewed towards Entire Home/Apt listings, which make up 98.9% of the 88 active rentals. This indicates strong guest preference for privacy and space.
- Looking at the property type distribution in Gadog, House properties are the most common (95.5%), reflecting the local real estate landscape.
- Houses represent a significant 95.5% portion, catering likely to families or larger groups.
- Smaller segments like hotel/boutique, outdoor/unique (combined 4.6%) offer potential for unique stay experiences.
Gadog Airbnb Room Capacity Analysis (2026): Bedroom Distribution
Distribution of Listings by Number of Bedrooms
Room Capacity Insights for Gadog
- The dominant room capacity in Gadog is 3 bedrooms listings, making up 28.4% of the market. This suggests a strong demand for properties suitable for families or small groups.
- Together, 3 bedrooms and 4 bedrooms properties represent 54.5% of the active Airbnb listings in Gadog, indicating a high concentration in these sizes.
- A significant 69.3% of listings offer 3+ bedrooms, catering to larger groups and families seeking more space in Gadog.
Gadog Vacation Rental Guest Capacity Trends (2026)
Distribution of Listings by Guest Capacity
Guest Capacity Insights for Gadog
- The most common guest capacity trend in Gadog vacation rentals is listings accommodating 8+ guests (80.7%). This suggests the primary traveler segment is likely larger groups.
- Properties designed for 8+ guests and 6 guests dominate the Gadog STR market, accounting for 93.2% of listings.
- 94.3% of properties accommodate 6+ guests, serving the market segment for larger families or group travel in Gadog.
- On average, properties in Gadog are equipped to host 7.5 guests.
Gadog Airbnb Booking Patterns (2026): Available vs. Booked Days
Available Days Distribution
Booked Days Distribution
Booking Pattern Insights for Gadog
- The most common availability pattern in Gadog falls within the 271-366 days range, representing 94.3% of listings. This suggests many properties have significant open periods on their calendars.
- Approximately 100.0% of listings show high availability (181+ days open annually), indicating potential for increased bookings or specific owner usage patterns.
- For booked days, the 1-30 days range is most frequent in Gadog (52.3%), reflecting common guest stay durations or potential owner blocking patterns.
Gadog Airbnb Minimum Stay Requirements Analysis
Distribution of Listings by Minimum Night Requirement
1 Night
87 listings
98.9% of total
2 Nights
1 listings
1.1% of total
Key Insights
- The most prevalent minimum stay requirement in Gadog is 1 Night, adopted by 98.9% of listings. This highlights the market's preference for shorter, flexible bookings.
- A strong majority (100.0%) of the Gadog Airbnb data shows acceptance of very short stays (1-2 nights), indicating a dynamic, high-turnover market.
Recommendations
- Align with the market by considering a 1 Night minimum stay, as 98.9% of Gadog hosts use this setting.
- Adjust minimum nights based on seasonality – potentially shorter during low season and longer during peak demand periods in Gadog.
Gadog Airbnb Cancellation Policy Trends Analysis (2026)
Limited
2 listings
2.3% of total
Flexible
10 listings
11.4% of total
Moderate
30 listings
34.1% of total
Firm
30 listings
34.1% of total
Strict
16 listings
18.2% of total
Cancellation Policy Insights for Gadog
- The prevailing Airbnb cancellation policy trend in Gadog is Moderate, used by 34.1% of listings.
- A majority (52.3%) of hosts in Gadog utilize Firm or Strict policies, indicating a market where hosts prioritize booking security.
Recommendations for Hosts
- Consider adopting a Moderate policy to align with the 34.1% market standard in Gadog.
- Regularly review your cancellation policy against competitors and market demand shifts in Gadog.
Gadog STR Booking Lead Time Analysis (2026)
Average Booking Lead Time by Month
Booking Lead Time Insights for Gadog
- The overall average booking lead time for vacation rentals in Gadog is 20 days.
- Guests book furthest in advance for stays during October (average 28 days), likely coinciding with peak travel demand or local events.
- The shortest booking windows occur for stays in August (average 12 days), indicating more last-minute travel plans during this time.
- Seasonally, Fall (22 days avg.) sees the longest lead times, while Summer (15 days avg.) has the shortest, reflecting typical travel planning cycles.
Recommendations for Hosts
- Use the overall average lead time (20 days) as a baseline for your pricing and availability strategy in Gadog.
- During August, focus on last-minute booking availability and promotions, as guests book with very short notice (12 days avg.).
- Target marketing efforts for the Fall season well in advance (at least 22 days) to capture early planners.
- Monitor your own booking lead times against these Gadog averages to identify opportunities for dynamic pricing adjustments.
Popular & Essential Airbnb Amenities in Gadog (2026)
Amenity Prevalence
Amenity Insights for Gadog
- Essential amenities in Gadog that guests expect include: Free parking on premises, Wifi, TV, Kitchen. Lacking these (any) could significantly impact bookings.
- Popular amenities like Air conditioning, Hot water, Dishes and silverware are common but not universal. Offering these can provide a competitive edge.
- A pool is a highly desired but not standard amenity, making it a key feature for attracting guests seeking leisure in Gadog.
Recommendations for Hosts
- Ensure your listing includes all essential amenities for Gadog: Free parking on premises, Wifi, TV, Kitchen.
- Prioritize adding missing essentials: Free parking on premises, Wifi, TV, Kitchen.
- Consider adding popular differentiators like Air conditioning or Hot water to increase appeal.
- Highlight unique or less common amenities you offer (e.g., hot tub, dedicated workspace, EV charger) in your listing description and photos.
- Regularly check competitor amenities in Gadog to stay competitive.
Gadog Airbnb Guest Demographics & Profile Analysis (2026)
Guest Profile Summary for Gadog
- The typical guest profile for Airbnb in Gadog consists of primarily domestic travelers (89%), often arriving from nearby Jakarta, typically belonging to the Post-2000s (Gen Z/Alpha) group (50%), primarily speaking Indonesian or English.
- Domestic travelers account for 88.9% of guests.
- Key international markets include Indonesia (88.9%) and Saudi Arabia (1.8%).
- Top languages spoken are Indonesian (42.2%) followed by English (41.6%).
- A significant demographic segment is the Post-2000s (Gen Z/Alpha) group, representing 50% of guests.
Recommendations for Hosts
- Target domestic marketing efforts towards travelers from Jakarta and Special Capital Region of Jakarta.
- Tailor amenities and listing descriptions to appeal to the dominant Post-2000s (Gen Z/Alpha) demographic (e.g., highlight fast WiFi, smart home features, local guides).
- Highlight unique local experiences or amenities relevant to the primary guest profile.
- Consider seasonal promotions aligned with peak travel times for key origin markets.
Nearby Short-Term Rental Market Comparison
How does the Gadog Airbnb market stack up against its neighbors? Compare key performance metrics like average monthly revenue, ADR, and occupancy rates in surrounding areas to understand the broader regional STR landscape.
| Market | Active Properties | Monthly Revenue | Daily Rate | Avg. Occupancy |
|---|---|---|---|---|
| Kuta | 10 | $2,046 | $149.05 | 45% |
| Sukagalih | 13 | $1,306 | $157.45 | 34% |
| Citaringgul | 21 | $1,285 | $142.78 | 30% |
| Sukamanah | 12 | $1,151 | $148.28 | 28% |
| Ciburial | 191 | $1,114 | $288.50 | 18% |
| Leuwimalang | 15 | $1,109 | $203.41 | 20% |
| Wangunsari | 17 | $1,094 | $158.69 | 23% |
| Cigugur Girang | 21 | $1,057 | $163.07 | 19% |
| Sumur Batu | 50 | $1,026 | $180.80 | 21% |
| Kecamatan Parongpong | 14 | $1,014 | $182.15 | 23% |