Bekasi Airbnb Market Analysis 2026: Short Term Rental Data & Vacation Rental Statistics in West Java, Indonesia
Is Airbnb profitable in Bekasi in 2026? Explore comprehensive Airbnb analytics for Bekasi, West Java, Indonesia to uncover income potential. This 2026 STR market report for Bekasi, based on AirROI data from February 2025 to January 2026, reveals key trends in the niche market of 92 active listings.
Whether you're considering an Airbnb investment in Bekasi, optimizing your existing vacation rental, or exploring rental arbitrage opportunities, understanding the Bekasi Airbnb data is crucial. Leveraging the low regulation environment is key to maximizing your short term rental income potential. Let's dive into the specifics.
Key Bekasi Airbnb Performance Metrics Overview
Monthly Airbnb Revenue Variations & Income Potential in Bekasi (2026)
Understanding the monthly revenue variations for Airbnb listings in Bekasi is key to maximizing your short term rental income potential. Seasonality significantly impacts earnings. Our analysis, based on data from the past 12 months, shows that the peak revenue month for STRs in Bekasi is typically December, while January often presents the lowest earnings, highlighting opportunities for strategic pricing adjustments during shoulder and low seasons. Explore the typical Airbnb income in Bekasi across different performance tiers:
- Best-in-class properties (Top 10%) achieve $601+ monthly, often utilizing dynamic pricing and superior guest experiences.
- Strong performing properties (Top 25%) earn $378 or more, indicating effective management and desirable locations/amenities.
- Typical properties (Median) generate around $181 per month, representing the average market performance.
- Entry-level properties (Bottom 25%) see earnings around $83, often with potential for optimization.
Average Monthly Airbnb Earnings Trend in Bekasi
Bekasi Airbnb Occupancy Rate Trends (2026)
Maximize your bookings by understanding the Bekasi STR occupancy trends. Seasonal demand shifts significantly influence how often properties are booked. Typically, Aprilsees the highest demand (peak season occupancy), while January experiences the lowest (low season). Effective strategies, like adjusting minimum stays or offering promotions, can boost occupancy during slower periods. Here's how different property tiers perform in Bekasi:
- Best-in-class properties (Top 10%) achieve 64%+ occupancy, indicating high desirability and potentially optimized availability.
- Strong performing properties (Top 25%) maintain 43% or higher occupancy, suggesting good market fit and guest satisfaction.
- Typical properties (Median) have an occupancy rate around 24%.
- Entry-level properties (Bottom 25%) average 11% occupancy, potentially facing higher vacancy.
Average Monthly Occupancy Rate Trend in Bekasi
Average Daily Rate (ADR) Airbnb Trends in Bekasi (2026)
Effective short term rental pricing strategy in Bekasi involves understanding monthly ADR fluctuations. The Average Daily Rate (ADR) for Airbnb in Bekasi typically peaks in September and dips lowest during April. Leveraging Airbnb dynamic pricing tools or strategies based on this seasonality can significantly boost revenue. Here's a look at the typical nightly rates achieved:
- Best-in-class properties (Top 10%) command rates of $47+ per night, often due to premium features or locations.
- Strong performing properties (Top 25%) achieve nightly rates of $31 or more.
- Typical properties (Median) charge around $24 per night.
- Entry-level properties (Bottom 25%) earn around $18 per night.
Average Daily Rate (ADR) Trend by Month in Bekasi
Get Live Bekasi Market Intelligence 👇

Explore Real-time Analytics
Airbnb Seasonality Analysis & Trends in Bekasi (2026)
Peak Season (December, April, November)
- Revenue averages $321 per month
- Occupancy rates average 32.7%
- Daily rates average $30
Shoulder Season
- Revenue averages $273 per month
- Occupancy maintains around 30.0%
- Daily rates hold near $30
Low Season (January, May, September)
- Revenue drops to average $226 per month
- Occupancy decreases to average 25.3%
- Daily rates adjust to average $31
Seasonality Insights for Bekasi
- The Airbnb seasonality in Bekasi shows moderate seasonality with distinct peak and low periods. While the sections above show seasonal averages, it's also insightful to look at the extremes:
- During the high season, the absolute peak month showcases Bekasi's highest earning potential, with monthly revenues capable of climbing to $333, occupancy reaching a high of 36.9%, and ADRs peaking at $31.
- Conversely, the slowest single month of the year, typically falling within the low season, marks the market's lowest point. In this month, revenue might dip to $207, occupancy could drop to 23.2%, and ADRs may adjust down to $30.
- Understanding both the seasonal averages and these monthly peaks and troughs in revenue, occupancy, and ADR is crucial for maximizing your Airbnb profit potential in Bekasi.
Seasonal Strategies for Maximizing Profit
- Peak Season: Maximize revenue through premium pricing and potentially longer minimum stays. Ensure high availability.
- Low Season: Offer competitive pricing, special promotions (e.g., extended stay discounts), and flexible cancellation policies. Target off-season travelers like remote workers or budget-conscious guests.
- Shoulder Seasons: Implement dynamic pricing that balances peak and low rates. Target weekend travelers or specific events. Offer slightly more flexible terms than peak season.
- Regularly analyze your own performance against these Bekasi seasonality benchmarks and adjust your pricing and availability strategy accordingly.
Best Areas for Airbnb Investment in Bekasi (2026)
Exploring the top neighborhoods for short-term rentals in Bekasi? This section highlights key areas, outlining why they are attractive for hosts and guests, along with notable local attractions. Consider these locations based on your target guest profile and investment strategy.
| Neighborhood / Area | Why Host Here? (Target Guests & Appeal) | Key Attractions & Landmarks |
|---|---|---|
| Jakarta-Bekasi Border | Proximity to Jakarta and affordable housing make this area attractive for commuters and tourists. Popular for those seeking a quiet stay with easy access to the capital's bustling life. | Taman Mini Indonesia Indah, Summarecon Mall Bekasi, Grand Metropolitan Mall, Go! Wet Waterpark, Jakarta Aquarium |
| Cikarang | Known as an industrial area with many expatriates, Cikarang is attractive for business travelers. Many factories and multinational companies are located here. | Waterboom Lippo Cikarang, Harapan Island, Riverside Walk, Cikarang Trade Center, Lippo Cikarang Mall |
| Bekasi City Center | The heart of Bekasi with numerous local attractions and shopping options. Good for visitors who want to explore the local culture. | Bekasi Junction, Mega Bekasi Hypermall, Taman Wisata Situ Gintung, Historical Sites of Bekasi, Alun-Alun Bekasi |
| Summarecon Bekasi | A well-planned modern township that offers luxury housing and amenities. Ideal for families and tourists looking for comfort and convenience. | Summarecon Mall Bekasi, Taman Summarecon, Waterpark, Food & Culinary areas, Cultural Events |
| Harapan Indah | A serene residential area with parks and modern amenities. Offers a peaceful retreat while being close to the hustle of the city. | Harapan Indah Golf Course, Parks and recreational areas, Local eateries, Cultural events, Nearby nature reserves |
| Rawa Lumbu | A developing area with rising popularity among younger crowds, offering affordable accommodations and local dining options. | Local Markets, Stadiums for sports events, Cafes and eateries, Cultural gatherings, Community parks |
| Kota Delizioso | An upscale area with luxury accommodations and comprehensive facilities that cater to both tourists and business professionals. | Delizioso Mall, Spa and Wellness Centers, Fine dining restaurants, Cultural exhibitions, Luxury shopping |
| Bintara | A vibrant neighborhood known for its dining and entertainment options. Attracts young travelers and families looking for diverse experiences. | Modern eateries, Local street food, Family parks, Entertainment complexes, Shopping centers |
Understanding Airbnb License Requirements & STR Laws in Bekasi (2026)
While Bekasi, West Java, Indonesia currently shows low STR regulations, specific Airbnb license requirements might still exist or change. Always verify the latest short term rental regulations and Airbnb license requirements directly with local government authorities for Bekasi to ensure full compliance before hosting.
(Source: AirROI data, 2026, finding no licensed listings among those analyzed)
Top Performing Airbnb Properties in Bekasi (2026)
Benchmark your potential! Explore examples of top-performing Airbnb properties in Bekasibased on Trailing Twelve Month (TTM) revenue. Analyze their characteristics, revenue, occupancy rate, and ADR to understand what drives success in this market.
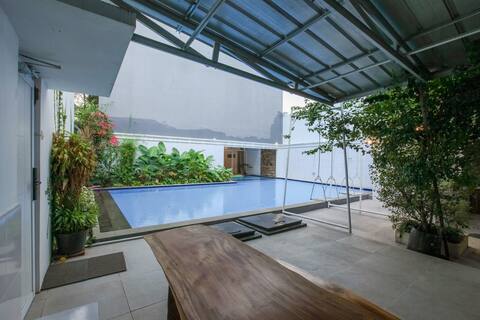
Beautiful Garden Resort Villa
Entire Place • 3 bedrooms

Villa Cerah
Entire Place • 2 bedrooms

Cozy house in Pekayon, Bekasi
Entire Place • 5 bedrooms

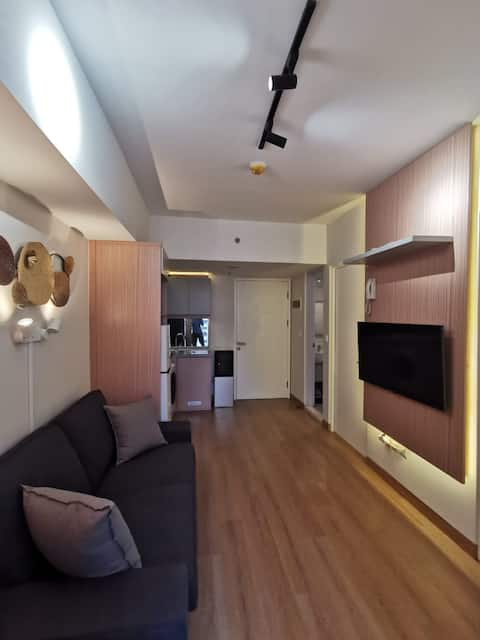
The Only 1BR Panoramic View at Kamala Lagoon
Entire Place • 1 bedroom
Cozy 3BR @ The Springlake Summarecon Bekasi
Entire Place • 3 bedrooms
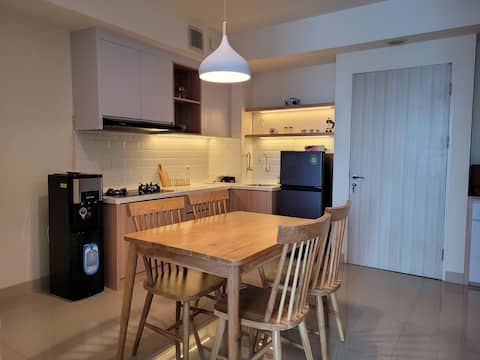
Emerald25 @kamala lagoon
Entire Place • 2 bedrooms
Note: Performance varies based on location, size, amenities, seasonality, and management quality. Data reflects the past 12 months.
Top Performing Airbnb Hosts in Bekasi (2026)
Learn from the best! This table showcases top-performing Airbnb hosts in Bekasi based on the number of properties managed and estimated total revenue over the past year. Analyze their scale and performance metrics.
| Host Name | Properties | Grossing Revenue | Stay Reviews | Avg Rating |
|---|---|---|---|---|
| Muhammad Yusuf | 1 | $15,672 | 55 | 4.75/5.0 |
| Harits | 3 | $10,459 | 109 | 4.94/5.0 |
| Anton | 2 | $10,409 | 171 | 4.93/5.0 |
| Ria | 1 | $7,165 | 14 | 4.86/5.0 |
| Fitria | 1 | $6,937 | 43 | 4.65/5.0 |
| Fanni | 2 | $5,613 | 165 | 4.99/5.0 |
| Harrys | 1 | $5,560 | 51 | 5.00/5.0 |
| Wahyu | 1 | $5,325 | 69 | 4.96/5.0 |
| Bawie | 3 | $5,322 | 701 | 4.99/5.0 |
| Liliek | 1 | $4,869 | 13 | 5.00/5.0 |
Analyzing the strategies of top hosts, such as their property selection, pricing, and guest communication, can offer valuable lessons for optimizing your own Airbnb operations in Bekasi.
Dive Deeper: Advanced Bekasi STR Market Data (2026)
Ready to unlock more insights? AirROI provides access to advanced metrics and comprehensive Airbnb data for Bekasi. Explore detailed analytics beyond this report to refine your investment strategy, optimize pricing, and maximize your vacation rental profits.
Explore Advanced MetricsBekasi Short-Term Rental Market Composition (2026): Property & Room Types
Room Type Distribution
Property Type Distribution
Market Composition Insights for Bekasi
- The Bekasi Airbnb market composition is heavily skewed towards Entire Home/Apt listings, which make up 89.1% of the 92 active rentals. This indicates strong guest preference for privacy and space.
- Looking at the property type distribution in Bekasi, Apartment/Condo properties are the most common (93.5%), reflecting the local real estate landscape.
- Smaller segments like hotel/boutique, house (combined 6.6%) offer potential for unique stay experiences.
Bekasi Airbnb Room Capacity Analysis (2026): Bedroom Distribution
Distribution of Listings by Number of Bedrooms
Room Capacity Insights for Bekasi
- The dominant room capacity in Bekasi is 1 bedroom listings, making up 41.3% of the market. This suggests a strong demand for properties suitable for couples or solo travelers.
- Together, 1 bedroom and 2 bedrooms properties represent 75.0% of the active Airbnb listings in Bekasi, indicating a high concentration in these sizes.
Bekasi Vacation Rental Guest Capacity Trends (2026)
Distribution of Listings by Guest Capacity
Guest Capacity Insights for Bekasi
- The most common guest capacity trend in Bekasi vacation rentals is listings accommodating 2 guests (41.3%). This suggests the primary traveler segment is likely couples or solo travelers.
- Properties designed for 2 guests and 4 guests dominate the Bekasi STR market, accounting for 60.9% of listings.
- A significant 41.3% of listings cater specifically to 1-2 guests, highlighting strong demand from couples and solo travelers in Bekasi.
- 10.8% of properties accommodate 6+ guests, serving the market segment for larger families or group travel in Bekasi.
- On average, properties in Bekasi are equipped to host 3.3 guests.
Bekasi Airbnb Booking Patterns (2026): Available vs. Booked Days
Available Days Distribution
Booked Days Distribution
Booking Pattern Insights for Bekasi
- The most common availability pattern in Bekasi falls within the 271-366 days range, representing 78.3% of listings. This suggests many properties have significant open periods on their calendars.
- Approximately 95.7% of listings show high availability (181+ days open annually), indicating potential for increased bookings or specific owner usage patterns.
- For booked days, the 1-30 days range is most frequent in Bekasi (41.3%), reflecting common guest stay durations or potential owner blocking patterns.
- A notable 4.3% of properties secure long booking periods (181+ days booked per year), highlighting successful long-term rental strategies or significant owner usage.
Bekasi Airbnb Minimum Stay Requirements Analysis
Distribution of Listings by Minimum Night Requirement
1 Night
74 listings
80.4% of total
2 Nights
5 listings
5.4% of total
3 Nights
2 listings
2.2% of total
4-6 Nights
2 listings
2.2% of total
7-29 Nights
4 listings
4.3% of total
30+ Nights
5 listings
5.4% of total
Key Insights
- The most prevalent minimum stay requirement in Bekasi is 1 Night, adopted by 80.4% of listings. This highlights the market's preference for shorter, flexible bookings.
- A strong majority (85.8%) of the Bekasi Airbnb data shows acceptance of very short stays (1-2 nights), indicating a dynamic, high-turnover market.
Recommendations
- Align with the market by considering a 1 Night minimum stay, as 80.4% of Bekasi hosts use this setting.
- Explore offering discounts for stays of 30+ nights to attract the 5.4% of the market seeking extended stays.
- Adjust minimum nights based on seasonality – potentially shorter during low season and longer during peak demand periods in Bekasi.
Bekasi Airbnb Cancellation Policy Trends Analysis (2026)
Limited
1 listings
1.1% of total
Flexible
55 listings
59.8% of total
Moderate
13 listings
14.1% of total
Firm
20 listings
21.7% of total
Strict
3 listings
3.3% of total
Cancellation Policy Insights for Bekasi
- The prevailing Airbnb cancellation policy trend in Bekasi is Flexible, used by 59.8% of listings.
- The market strongly favors guest-friendly terms, with 73.9% of listings offering Flexible or Moderate policies. This suggests guests in Bekasi may expect booking flexibility.
- Strict cancellation policies are quite rare (3.3%), potentially making listings with this policy less competitive unless justified by high demand or property type.
Recommendations for Hosts
- Consider adopting a Flexible policy to align with the 59.8% market standard in Bekasi.
- Given the high prevalence of Flexible policies (59.8%), offering this can enhance booking appeal, especially during shoulder seasons.
- Using a Strict policy might deter some guests, as only 3.3% of listings use it. Evaluate if potential revenue protection outweighs possible lower booking rates.
- Regularly review your cancellation policy against competitors and market demand shifts in Bekasi.
Bekasi STR Booking Lead Time Analysis (2026)
Average Booking Lead Time by Month
Booking Lead Time Insights for Bekasi
- The overall average booking lead time for vacation rentals in Bekasi is 16 days.
- Guests book furthest in advance for stays during September (average 21 days), likely coinciding with peak travel demand or local events.
- The shortest booking windows occur for stays in June (average 6 days), indicating more last-minute travel plans during this time.
- Seasonally, Fall (19 days avg.) sees the longest lead times, while Summer (12 days avg.) has the shortest, reflecting typical travel planning cycles.
Recommendations for Hosts
- Use the overall average lead time (16 days) as a baseline for your pricing and availability strategy in Bekasi.
- During June, focus on last-minute booking availability and promotions, as guests book with very short notice (6 days avg.).
- Target marketing efforts for the Fall season well in advance (at least 19 days) to capture early planners.
- Monitor your own booking lead times against these Bekasi averages to identify opportunities for dynamic pricing adjustments.
Popular & Essential Airbnb Amenities in Bekasi (2026)
Amenity Prevalence
Amenity Insights for Bekasi
- Essential amenities in Bekasi that guests expect include: Air conditioning, TV. Lacking these (any) could significantly impact bookings.
- Popular amenities like Pool, Kitchen, Wifi are common but not universal. Offering these can provide a competitive edge.
- A pool is a highly desired but not standard amenity, making it a key feature for attracting guests seeking leisure in Bekasi.
- Warning: Wifi is not universally provided but is considered essential globally. Ensure reliable Wifi is offered.
Recommendations for Hosts
- Ensure your listing includes all essential amenities for Bekasi: Air conditioning, TV.
- Prioritize adding missing essentials: TV.
- Consider adding popular differentiators like Pool or Kitchen to increase appeal.
- Highlight unique or less common amenities you offer (e.g., hot tub, dedicated workspace, EV charger) in your listing description and photos.
- Regularly check competitor amenities in Bekasi to stay competitive.
Bekasi Airbnb Guest Demographics & Profile Analysis (2026)
Guest Profile Summary for Bekasi
- The typical guest profile for Airbnb in Bekasi consists of a mix of domestic (58%) and international guests, often arriving from nearby Jakarta, typically belonging to the Post-2000s (Gen Z/Alpha) group (50%), primarily speaking English or Indonesian.
- Domestic travelers account for 58.3% of guests.
- Key international markets include Indonesia (58.3%) and United Kingdom (6.9%).
- Top languages spoken are English (44%) followed by Indonesian (35.2%).
- A significant demographic segment is the Post-2000s (Gen Z/Alpha) group, representing 50% of guests.
Recommendations for Hosts
- Balance marketing efforts between domestic and international channels based on the guest mix.
- Tailor amenities and listing descriptions to appeal to the dominant Post-2000s (Gen Z/Alpha) demographic (e.g., highlight fast WiFi, smart home features, local guides).
- Highlight unique local experiences or amenities relevant to the primary guest profile.
- Consider seasonal promotions aligned with peak travel times for key origin markets.
Nearby Short-Term Rental Market Comparison
How does the Bekasi Airbnb market stack up against its neighbors? Compare key performance metrics like average monthly revenue, ADR, and occupancy rates in surrounding areas to understand the broader regional STR landscape.
| Market | Active Properties | Monthly Revenue | Daily Rate | Avg. Occupancy |
|---|---|---|---|---|
| Kuta | 10 | $2,046 | $149.05 | 45% |
| Sukagalih | 13 | $1,306 | $157.45 | 34% |
| Citaringgul | 21 | $1,285 | $142.78 | 30% |
| Sukamanah | 12 | $1,151 | $148.28 | 28% |
| Ciburial | 191 | $1,114 | $288.50 | 18% |
| Leuwimalang | 15 | $1,109 | $203.41 | 20% |
| Wangunsari | 17 | $1,094 | $158.69 | 23% |
| Cigugur Girang | 21 | $1,057 | $163.07 | 19% |
| Sumur Batu | 50 | $1,026 | $180.80 | 21% |
| Kecamatan Parongpong | 14 | $1,014 | $182.15 | 23% |