Bandung City Airbnb Market Analysis 2026: Short Term Rental Data & Vacation Rental Statistics in West Java, Indonesia
Is Airbnb profitable in Bandung City in 2026? Explore comprehensive Airbnb analytics for Bandung City, West Java, Indonesia to uncover income potential. This 2026 STR market report for Bandung City, based on AirROI data from February 2025 to January 2026, reveals key trends in the market of 215 active listings.
Whether you're considering an Airbnb investment in Bandung City, optimizing your existing vacation rental, or exploring rental arbitrage opportunities, understanding the Bandung City Airbnb data is crucial. Leveraging the low regulation environment is key to maximizing your short term rental income potential. Let's dive into the specifics.
Key Bandung City Airbnb Performance Metrics Overview
Monthly Airbnb Revenue Variations & Income Potential in Bandung City (2026)
Understanding the monthly revenue variations for Airbnb listings in Bandung City is key to maximizing your short term rental income potential. Seasonality significantly impacts earnings. Our analysis, based on data from the past 12 months, shows that the peak revenue month for STRs in Bandung City is typically December, while January often presents the lowest earnings, highlighting opportunities for strategic pricing adjustments during shoulder and low seasons. Explore the typical Airbnb income in Bandung City across different performance tiers:
- Best-in-class properties (Top 10%) achieve $1,676+ monthly, often utilizing dynamic pricing and superior guest experiences.
- Strong performing properties (Top 25%) earn $884 or more, indicating effective management and desirable locations/amenities.
- Typical properties (Median) generate around $478 per month, representing the average market performance.
- Entry-level properties (Bottom 25%) see earnings around $234, often with potential for optimization.
Average Monthly Airbnb Earnings Trend in Bandung City
Bandung City Airbnb Occupancy Rate Trends (2026)
Maximize your bookings by understanding the Bandung City STR occupancy trends. Seasonal demand shifts significantly influence how often properties are booked. Typically, Decembersees the highest demand (peak season occupancy), while March experiences the lowest (low season). Effective strategies, like adjusting minimum stays or offering promotions, can boost occupancy during slower periods. Here's how different property tiers perform in Bandung City:
- Best-in-class properties (Top 10%) achieve 68%+ occupancy, indicating high desirability and potentially optimized availability.
- Strong performing properties (Top 25%) maintain 51% or higher occupancy, suggesting good market fit and guest satisfaction.
- Typical properties (Median) have an occupancy rate around 29%.
- Entry-level properties (Bottom 25%) average 13% occupancy, potentially facing higher vacancy.
Average Monthly Occupancy Rate Trend in Bandung City
Average Daily Rate (ADR) Airbnb Trends in Bandung City (2026)
Effective short term rental pricing strategy in Bandung City involves understanding monthly ADR fluctuations. The Average Daily Rate (ADR) for Airbnb in Bandung City typically peaks in March and dips lowest during November. Leveraging Airbnb dynamic pricing tools or strategies based on this seasonality can significantly boost revenue. Here's a look at the typical nightly rates achieved:
- Best-in-class properties (Top 10%) command rates of $153+ per night, often due to premium features or locations.
- Strong performing properties (Top 25%) achieve nightly rates of $88 or more.
- Typical properties (Median) charge around $47 per night.
- Entry-level properties (Bottom 25%) earn around $29 per night.
Average Daily Rate (ADR) Trend by Month in Bandung City
Get Live Bandung City Market Intelligence 👇

Explore Real-time Analytics
Airbnb Seasonality Analysis & Trends in Bandung City (2026)
Peak Season (December, July, April)
- Revenue averages $864 per month
- Occupancy rates average 37.1%
- Daily rates average $73
Shoulder Season
- Revenue averages $715 per month
- Occupancy maintains around 33.2%
- Daily rates hold near $73
Low Season (January, October, November)
- Revenue drops to average $603 per month
- Occupancy decreases to average 32.4%
- Daily rates adjust to average $64
Seasonality Insights for Bandung City
- The Airbnb seasonality in Bandung City shows moderate seasonality with distinct peak and low periods. While the sections above show seasonal averages, it's also insightful to look at the extremes:
- During the high season, the absolute peak month showcases Bandung City's highest earning potential, with monthly revenues capable of climbing to $910, occupancy reaching a high of 39.5%, and ADRs peaking at $77.
- Conversely, the slowest single month of the year, typically falling within the low season, marks the market's lowest point. In this month, revenue might dip to $569, occupancy could drop to 26.6%, and ADRs may adjust down to $63.
- Understanding both the seasonal averages and these monthly peaks and troughs in revenue, occupancy, and ADR is crucial for maximizing your Airbnb profit potential in Bandung City.
Seasonal Strategies for Maximizing Profit
- Peak Season: Maximize revenue through premium pricing and potentially longer minimum stays. Ensure high availability.
- Low Season: Offer competitive pricing, special promotions (e.g., extended stay discounts), and flexible cancellation policies. Target off-season travelers like remote workers or budget-conscious guests.
- Shoulder Seasons: Implement dynamic pricing that balances peak and low rates. Target weekend travelers or specific events. Offer slightly more flexible terms than peak season.
- Regularly analyze your own performance against these Bandung City seasonality benchmarks and adjust your pricing and availability strategy accordingly.
Best Areas for Airbnb Investment in Bandung City (2026)
Exploring the top neighborhoods for short-term rentals in Bandung City? This section highlights key areas, outlining why they are attractive for hosts and guests, along with notable local attractions. Consider these locations based on your target guest profile and investment strategy.
| Neighborhood / Area | Why Host Here? (Target Guests & Appeal) | Key Attractions & Landmarks |
|---|---|---|
| Dago | Popular area known for its cool climate, beautiful views, and vibrant coffee shops. A favorite among tourists looking for a relaxing getaway close to the city center. | Dago Dreampark, Tangkuban Perahu, Dago Tea House, Dago Street, Husen Sastranegara Museum |
| Cihampelas | Famous for its shopping and entertainment options, Cihampelas offers many attractions for tourists, including an array of shops and cafes. | Cihampelas Walk, Skywalk Cihampelas, Cihampelas Jeans Center, Paris Van Java Mall |
| Lembang | Known for its scenic landscapes and outdoor activities, Lembang is perfect for families and nature lovers looking for adventure. | Farm House Lembang, Tangkuban Perahu, The Lodge Maribaya, Floating Market Lembang, Sail Lembang |
| Soreang | A growing area with new developments, Soreang is becoming popular for those looking for more affordable stays while still being close to Bandung's attractions. | Soreang-Pasirjambu Bypass, Soreang Golf Course, Soreang Cultural Center |
| Setiabudi | This area is known for its education institutions and is popular among students and younger travelers. It is close to local eateries and cafes. | Setiabudi Supermarket, Jalan Setiabudi food stalls, Museum of The Asian-African Conference |
| Bandung City Center | The heart of Bandung, offering easy access to shopping, dining, and nightlife. Ideal for guests who want to be in the lively part of the city. | Trans Studio Bandung, Braga Street, Pasar Baru Trade Center, Bandung Institute of Technology |
| Batu Nunggal | A quieter residential area with a more local feel, attractive for travelers looking for a peaceful retreat yet still close to the city. | Batu Nunggal Park, Local food stalls, Cultural sites |
| Gatot Subroto | A busy area with commercial establishments and close proximity to major amenities. Ideal for business travelers and those attending events. | Bandung Bapenda Office, Bandung Virtual Reality |
Understanding Airbnb License Requirements & STR Laws in Bandung City (2026)
While Bandung City, West Java, Indonesia currently shows low STR regulations, specific Airbnb license requirements might still exist or change. Always verify the latest short term rental regulations and Airbnb license requirements directly with local government authorities for Bandung City to ensure full compliance before hosting.
(Source: AirROI data, 2026, based on 1% licensed listings)
Top Performing Airbnb Properties in Bandung City (2026)
Benchmark your potential! Explore examples of top-performing Airbnb properties in Bandung Citybased on Trailing Twelve Month (TTM) revenue. Analyze their characteristics, revenue, occupancy rate, and ADR to understand what drives success in this market.

Mahitala 3BR HeatedPool, Prime Location
Entire Place • 3 bedrooms

Bandung Group Retreat
Entire Place • 6 bedrooms

Bungalow Paradise Poolside Heaven 2 Bedrooms
Entire Place • 2 bedrooms
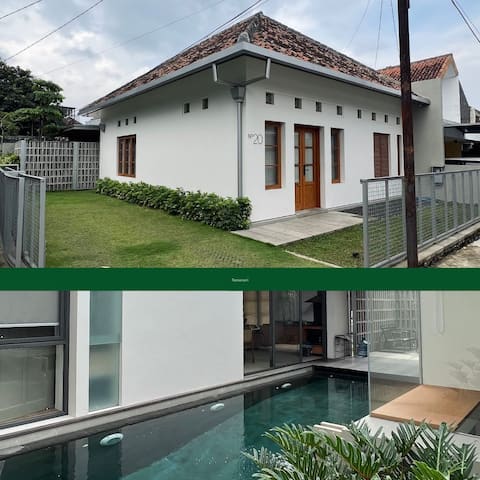
Tamanari Poolhouse
Entire Place • 3 bedrooms

RumahBojong 3BR - with Netflix, Swimming Pool
Entire Place • 3 bedrooms
Casa 42 Bandung - 15 Guests - Near City Center
Entire Place • 5 bedrooms
Note: Performance varies based on location, size, amenities, seasonality, and management quality. Data reflects the past 12 months.
Top Performing Airbnb Hosts in Bandung City (2026)
Learn from the best! This table showcases top-performing Airbnb hosts in Bandung City based on the number of properties managed and estimated total revenue over the past year. Analyze their scale and performance metrics.
| Host Name | Properties | Grossing Revenue | Stay Reviews | Avg Rating |
|---|---|---|---|---|
| Kozystay | 22 | $181,550 | 489 | 4.79/5.0 |
| Bungalow | 16 | $151,122 | 188 | 4.86/5.0 |
| Youre At | 8 | $69,316 | 63 | 4.96/5.0 |
| Rafif | 4 | $58,491 | 350 | 4.87/5.0 |
| Mahitala | 1 | $58,298 | 6 | 5.00/5.0 |
| Ronggur | 1 | $55,295 | 55 | 4.95/5.0 |
| Ikawati | 6 | $37,830 | 414 | 4.92/5.0 |
| Deddy | 4 | $36,205 | 43 | 4.87/5.0 |
| Davin | 6 | $35,884 | 169 | 4.92/5.0 |
| Steffan | 6 | $27,451 | 172 | 4.75/5.0 |
Analyzing the strategies of top hosts, such as their property selection, pricing, and guest communication, can offer valuable lessons for optimizing your own Airbnb operations in Bandung City.
Dive Deeper: Advanced Bandung City STR Market Data (2026)
Ready to unlock more insights? AirROI provides access to advanced metrics and comprehensive Airbnb data for Bandung City. Explore detailed analytics beyond this report to refine your investment strategy, optimize pricing, and maximize your vacation rental profits.
Explore Advanced MetricsBandung City Short-Term Rental Market Composition (2026): Property & Room Types
Room Type Distribution
Property Type Distribution
Market Composition Insights for Bandung City
- The Bandung City Airbnb market composition is heavily skewed towards Entire Home/Apt listings, which make up 92.1% of the 215 active rentals. This indicates strong guest preference for privacy and space.
- Looking at the property type distribution in Bandung City, Apartment/Condo properties are the most common (60%), reflecting the local real estate landscape.
- Houses represent a significant 34% portion, catering likely to families or larger groups.
- The presence of 5.6% Hotel/Boutique listings indicates integration with traditional hospitality.
- Smaller segments like others (combined 0.5%) offer potential for unique stay experiences.
Bandung City Airbnb Room Capacity Analysis (2026): Bedroom Distribution
Distribution of Listings by Number of Bedrooms
Room Capacity Insights for Bandung City
- The dominant room capacity in Bandung City is 2 bedrooms listings, making up 37.7% of the market. This suggests a strong demand for properties suitable for couples or solo travelers.
- Together, 2 bedrooms and 1 bedroom properties represent 68.9% of the active Airbnb listings in Bandung City, indicating a high concentration in these sizes.
- A significant 26.6% of listings offer 3+ bedrooms, catering to larger groups and families seeking more space in Bandung City.
Bandung City Vacation Rental Guest Capacity Trends (2026)
Distribution of Listings by Guest Capacity
Guest Capacity Insights for Bandung City
- The most common guest capacity trend in Bandung City vacation rentals is listings accommodating 4 guests (23.3%). This suggests the primary traveler segment is likely small families or groups.
- Properties designed for 4 guests and 8+ guests dominate the Bandung City STR market, accounting for 41.9% of listings.
- 35.9% of properties accommodate 6+ guests, serving the market segment for larger families or group travel in Bandung City.
- On average, properties in Bandung City are equipped to host 4.7 guests.
Bandung City Airbnb Booking Patterns (2026): Available vs. Booked Days
Available Days Distribution
Booked Days Distribution
Booking Pattern Insights for Bandung City
- The most common availability pattern in Bandung City falls within the 271-366 days range, representing 55.8% of listings. This suggests many properties have significant open periods on their calendars.
- Approximately 85.6% of listings show high availability (181+ days open annually), indicating potential for increased bookings or specific owner usage patterns.
- For booked days, the 31-90 days range is most frequent in Bandung City (34.4%), reflecting common guest stay durations or potential owner blocking patterns.
- A notable 14.9% of properties secure long booking periods (181+ days booked per year), highlighting successful long-term rental strategies or significant owner usage.
Bandung City Airbnb Minimum Stay Requirements Analysis
Distribution of Listings by Minimum Night Requirement
1 Night
186 listings
86.5% of total
2 Nights
14 listings
6.5% of total
7-29 Nights
1 listings
0.5% of total
30+ Nights
14 listings
6.5% of total
Key Insights
- The most prevalent minimum stay requirement in Bandung City is 1 Night, adopted by 86.5% of listings. This highlights the market's preference for shorter, flexible bookings.
- A strong majority (93.0%) of the Bandung City Airbnb data shows acceptance of very short stays (1-2 nights), indicating a dynamic, high-turnover market.
Recommendations
- Align with the market by considering a 1 Night minimum stay, as 86.5% of Bandung City hosts use this setting.
- Explore offering discounts for stays of 30+ nights to attract the 6.5% of the market seeking extended stays.
- Adjust minimum nights based on seasonality – potentially shorter during low season and longer during peak demand periods in Bandung City.
Bandung City Airbnb Cancellation Policy Trends Analysis (2026)
Limited
1 listings
0.5% of total
Flexible
102 listings
47.4% of total
Moderate
32 listings
14.9% of total
Firm
45 listings
20.9% of total
Strict
35 listings
16.3% of total
Cancellation Policy Insights for Bandung City
- The prevailing Airbnb cancellation policy trend in Bandung City is Flexible, used by 47.4% of listings.
- There's a relatively balanced mix between guest-friendly (62.3%) and stricter (37.2%) policies, offering choices for different guest needs.
Recommendations for Hosts
- Consider adopting a Flexible policy to align with the 47.4% market standard in Bandung City.
- Regularly review your cancellation policy against competitors and market demand shifts in Bandung City.
Bandung City STR Booking Lead Time Analysis (2026)
Average Booking Lead Time by Month
Booking Lead Time Insights for Bandung City
- The overall average booking lead time for vacation rentals in Bandung City is 21 days.
- Guests book furthest in advance for stays during December (average 32 days), likely coinciding with peak travel demand or local events.
- The shortest booking windows occur for stays in February (average 12 days), indicating more last-minute travel plans during this time.
- Seasonally, Fall (26 days avg.) sees the longest lead times, while Spring (16 days avg.) has the shortest, reflecting typical travel planning cycles.
Recommendations for Hosts
- Use the overall average lead time (21 days) as a baseline for your pricing and availability strategy in Bandung City.
- For December stays, consider implementing length-of-stay discounts or slightly higher rates for bookings made less than 32 days out to capitalize on advance planning.
- During February, focus on last-minute booking availability and promotions, as guests book with very short notice (12 days avg.).
- Target marketing efforts for the Fall season well in advance (at least 26 days) to capture early planners.
- Monitor your own booking lead times against these Bandung City averages to identify opportunities for dynamic pricing adjustments.
Popular & Essential Airbnb Amenities in Bandung City (2026)
Amenity Prevalence
Amenity Insights for Bandung City
- Essential amenities in Bandung City that guests expect include: TV, Air conditioning. Lacking these (any) could significantly impact bookings.
- Popular amenities like Wifi, Kitchen, Hot water are common but not universal. Offering these can provide a competitive edge.
- Warning: Wifi is not universally provided but is considered essential globally. Ensure reliable Wifi is offered.
Recommendations for Hosts
- Ensure your listing includes all essential amenities for Bandung City: TV, Air conditioning.
- Prioritize adding missing essentials: TV, Air conditioning.
- Consider adding popular differentiators like Wifi or Kitchen to increase appeal.
- Highlight unique or less common amenities you offer (e.g., hot tub, dedicated workspace, EV charger) in your listing description and photos.
- Regularly check competitor amenities in Bandung City to stay competitive.
Bandung City Airbnb Guest Demographics & Profile Analysis (2026)
Guest Profile Summary for Bandung City
- The typical guest profile for Airbnb in Bandung City consists of primarily domestic travelers (68%), often arriving from nearby Jakarta, typically belonging to the Post-2000s (Gen Z/Alpha) group (50%), primarily speaking English or Indonesian.
- Domestic travelers account for 67.7% of guests.
- Key international markets include Indonesia (67.7%) and Malaysia (8.6%).
- Top languages spoken are English (43.3%) followed by Indonesian (38.2%).
- A significant demographic segment is the Post-2000s (Gen Z/Alpha) group, representing 50% of guests.
Recommendations for Hosts
- Target domestic marketing efforts towards travelers from Jakarta and West Java.
- Tailor amenities and listing descriptions to appeal to the dominant Post-2000s (Gen Z/Alpha) demographic (e.g., highlight fast WiFi, smart home features, local guides).
- Highlight unique local experiences or amenities relevant to the primary guest profile.
- Consider seasonal promotions aligned with peak travel times for key origin markets.
Nearby Short-Term Rental Market Comparison
How does the Bandung City Airbnb market stack up against its neighbors? Compare key performance metrics like average monthly revenue, ADR, and occupancy rates in surrounding areas to understand the broader regional STR landscape.
| Market | Active Properties | Monthly Revenue | Daily Rate | Avg. Occupancy |
|---|---|---|---|---|
| Kuta | 10 | $2,046 | $149.05 | 45% |
| Sukagalih | 13 | $1,306 | $157.45 | 34% |
| Citaringgul | 21 | $1,285 | $142.78 | 30% |
| Sukamanah | 12 | $1,151 | $148.28 | 28% |
| Ciburial | 191 | $1,114 | $288.50 | 18% |
| Leuwimalang | 15 | $1,109 | $203.41 | 20% |
| Wangunsari | 17 | $1,094 | $158.69 | 23% |
| Cigugur Girang | 21 | $1,057 | $163.07 | 19% |
| Sumur Batu | 50 | $1,026 | $180.80 | 21% |
| Kecamatan Parongpong | 14 | $1,014 | $182.15 | 23% |