Bandung Airbnb Market Analysis 2026: Short Term Rental Data & Vacation Rental Statistics in West Java, Indonesia
Is Airbnb profitable in Bandung in 2026? Explore comprehensive Airbnb analytics for Bandung, West Java, Indonesia to uncover income potential. This 2026 STR market report for Bandung, based on AirROI data from February 2025 to January 2026, reveals key trends in the market of 879 active listings.
Whether you're considering an Airbnb investment in Bandung, optimizing your existing vacation rental, or exploring rental arbitrage opportunities, understanding the Bandung Airbnb data is crucial. Leveraging the low regulation environment is key to maximizing your short term rental income potential. Let's dive into the specifics.
Key Bandung Airbnb Performance Metrics Overview
Monthly Airbnb Revenue Variations & Income Potential in Bandung (2026)
Understanding the monthly revenue variations for Airbnb listings in Bandung is key to maximizing your short term rental income potential. Seasonality significantly impacts earnings. Our analysis, based on data from the past 12 months, shows that the peak revenue month for STRs in Bandung is typically December, while November often presents the lowest earnings, highlighting opportunities for strategic pricing adjustments during shoulder and low seasons. Explore the typical Airbnb income in Bandung across different performance tiers:
- Best-in-class properties (Top 10%) achieve $1,157+ monthly, often utilizing dynamic pricing and superior guest experiences.
- Strong performing properties (Top 25%) earn $643 or more, indicating effective management and desirable locations/amenities.
- Typical properties (Median) generate around $319 per month, representing the average market performance.
- Entry-level properties (Bottom 25%) see earnings around $139, often with potential for optimization.
Average Monthly Airbnb Earnings Trend in Bandung
Bandung Airbnb Occupancy Rate Trends (2026)
Maximize your bookings by understanding the Bandung STR occupancy trends. Seasonal demand shifts significantly influence how often properties are booked. Typically, Decembersees the highest demand (peak season occupancy), while March experiences the lowest (low season). Effective strategies, like adjusting minimum stays or offering promotions, can boost occupancy during slower periods. Here's how different property tiers perform in Bandung:
- Best-in-class properties (Top 10%) achieve 59%+ occupancy, indicating high desirability and potentially optimized availability.
- Strong performing properties (Top 25%) maintain 37% or higher occupancy, suggesting good market fit and guest satisfaction.
- Typical properties (Median) have an occupancy rate around 21%.
- Entry-level properties (Bottom 25%) average 10% occupancy, potentially facing higher vacancy.
Average Monthly Occupancy Rate Trend in Bandung
Average Daily Rate (ADR) Airbnb Trends in Bandung (2026)
Effective short term rental pricing strategy in Bandung involves understanding monthly ADR fluctuations. The Average Daily Rate (ADR) for Airbnb in Bandung typically peaks in December and dips lowest during November. Leveraging Airbnb dynamic pricing tools or strategies based on this seasonality can significantly boost revenue. Here's a look at the typical nightly rates achieved:
- Best-in-class properties (Top 10%) command rates of $131+ per night, often due to premium features or locations.
- Strong performing properties (Top 25%) achieve nightly rates of $77 or more.
- Typical properties (Median) charge around $41 per night.
- Entry-level properties (Bottom 25%) earn around $25 per night.
Average Daily Rate (ADR) Trend by Month in Bandung
Get Live Bandung Market Intelligence 👇

Explore Real-time Analytics
Airbnb Seasonality Analysis & Trends in Bandung (2026)
Peak Season (December, April, July)
- Revenue averages $614 per month
- Occupancy rates average 29.7%
- Daily rates average $65
Shoulder Season
- Revenue averages $484 per month
- Occupancy maintains around 26.4%
- Daily rates hold near $62
Low Season (January, October, November)
- Revenue drops to average $423 per month
- Occupancy decreases to average 24.3%
- Daily rates adjust to average $59
Seasonality Insights for Bandung
- The Airbnb seasonality in Bandung shows moderate seasonality with distinct peak and low periods. While the sections above show seasonal averages, it's also insightful to look at the extremes:
- During the high season, the absolute peak month showcases Bandung's highest earning potential, with monthly revenues capable of climbing to $707, occupancy reaching a high of 31.3%, and ADRs peaking at $67.
- Conversely, the slowest single month of the year, typically falling within the low season, marks the market's lowest point. In this month, revenue might dip to $418, occupancy could drop to 21.6%, and ADRs may adjust down to $57.
- Understanding both the seasonal averages and these monthly peaks and troughs in revenue, occupancy, and ADR is crucial for maximizing your Airbnb profit potential in Bandung.
Seasonal Strategies for Maximizing Profit
- Peak Season: Maximize revenue through premium pricing and potentially longer minimum stays. Ensure high availability.
- Low Season: Offer competitive pricing, special promotions (e.g., extended stay discounts), and flexible cancellation policies. Target off-season travelers like remote workers or budget-conscious guests.
- Shoulder Seasons: Implement dynamic pricing that balances peak and low rates. Target weekend travelers or specific events. Offer slightly more flexible terms than peak season.
- Regularly analyze your own performance against these Bandung seasonality benchmarks and adjust your pricing and availability strategy accordingly.
Best Areas for Airbnb Investment in Bandung (2026)
Exploring the top neighborhoods for short-term rentals in Bandung? This section highlights key areas, outlining why they are attractive for hosts and guests, along with notable local attractions. Consider these locations based on your target guest profile and investment strategy.
| Neighborhood / Area | Why Host Here? (Target Guests & Appeal) | Key Attractions & Landmarks |
|---|---|---|
| Dago | A popular area known for its natural beauty, cool climate, and vibrant lifestyle. Ideal for tourists and locals looking for a pleasant escape with plenty of recreational activities. | Dago Pakar, Dago Dreampark, Bosscha Observatory, Villa Isola, Taman Hutan Raya |
| Cihampelas | Famous for its shopping options and vibrant atmosphere, this area attracts both domestic and international tourists. It's perfect for those looking for a lively urban experience. | Cihampelas Walk, Metro Indah Mall, Cihampelas Jeans Street, Karang Setra Waterland, Skywalk Cihampelas |
| Lembang | Located in the hills, Lembang offers a cooler climate and various attractions such as theme parks and strawberry farms, making it ideal for family vacations. | Farmhouse Lembang, Tangkuban Perahu, De Ranch Lembang, Floating Market Lembang, Ciater Hot Spring |
| Bandung City Center | The heart of Bandung, offering a mix of shopping, dining, and cultural experiences. Perfect for tourists wanting to be in the center of action. | Trans Studio Bandung, Braga Street, Bandung Grand Mosque, Saung Angklung Udjo, Pasar Baru Trade Center |
| Cimahi | A suburb of Bandung offering a quieter environment with access to natural attractions. Great for travelers looking for a peaceful retreat close to the city. | Cimahi Waterfall, Puncak Ciumbuleuit, Lembang Park and Zoo, Cimahi Square, Taman Pelangi |
| Setiabudi | A strategic area with access to some of Bandung's best educational institutions and hospitals, attracting family and student rentals. | Dusun Bambu Leisure Park, Sierra Cafe & Lounge, Rumah Mode Factory Outlet, Lavigne Cafe, Taman Film |
| Kota Baru Parahyangan | A well-planned area that integrates nature with modern living, ideal for those seeking a more upscale and serene environment to stay in. | Batu cau Nature Park, Parahyangan Golf, Kota Baru Parahyangan Mall, Rainbow Garden, Sanghyang Sirna Waterfall |
| Riau | Known for shopping and food, Riau is a bustling area that combines modern lifestyle with cultural heritage, making it popular among tourists. | Riau Junction, Paris Van Java Mall, Brasco Fashion Store, Rumah Fashion, Galeri Cinde |
Understanding Airbnb License Requirements & STR Laws in Bandung (2026)
While Bandung, West Java, Indonesia currently shows low STR regulations, specific Airbnb license requirements might still exist or change. Always verify the latest short term rental regulations and Airbnb license requirements directly with local government authorities for Bandung to ensure full compliance before hosting.
(Source: AirROI data, 2026, finding no licensed listings among those analyzed)
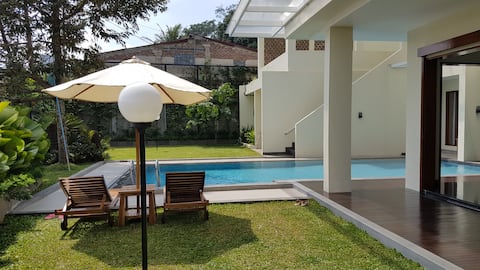
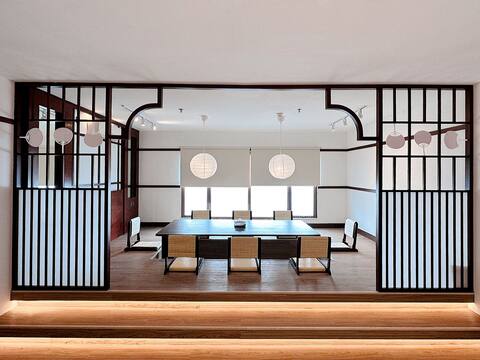
Top Performing Airbnb Properties in Bandung (2026)
Benchmark your potential! Explore examples of top-performing Airbnb properties in Bandungbased on Trailing Twelve Month (TTM) revenue. Analyze their characteristics, revenue, occupancy rate, and ADR to understand what drives success in this market.

The most affordable Luxury in Bandung
Entire Place • 4 bedrooms
Bukit Dago Palace 22
Entire Place • 7 bedrooms
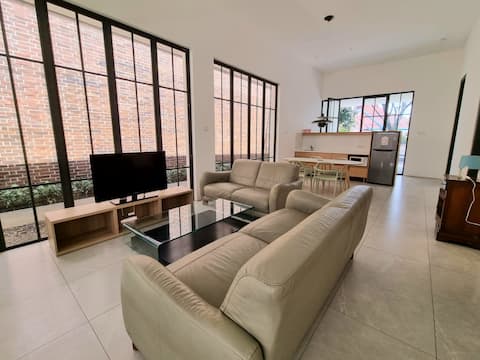
Clean Modern Brickhouse
Entire Place • 6 bedrooms

youre•at Kyoto / 3BR / Near Advent Hospital, BDG
Entire Place • 3 bedrooms

WEleven Bandung - 3BR House at Premium Location
Entire Place • 3 bedrooms
youre•at Okinawa / 4BR / 20min plus ke Lembang Zoo
Entire Place • 4 bedrooms
Note: Performance varies based on location, size, amenities, seasonality, and management quality. Data reflects the past 12 months.
Top Performing Airbnb Hosts in Bandung (2026)
Learn from the best! This table showcases top-performing Airbnb hosts in Bandung based on the number of properties managed and estimated total revenue over the past year. Analyze their scale and performance metrics.
| Host Name | Properties | Grossing Revenue | Stay Reviews | Avg Rating |
|---|---|---|---|---|
| Youre At | 68 | $413,695 | 1405 | 4.88/5.0 |
| Davin | 35 | $204,093 | 5778 | 4.89/5.0 |
| Kozystay | 22 | $161,650 | 796 | 4.84/5.0 |
| Neti | 7 | $111,260 | 387 | 4.96/5.0 |
| Steffan | 23 | $103,762 | 1261 | 4.85/5.0 |
| Rafif | 4 | $80,150 | 680 | 4.88/5.0 |
| Jesse | 4 | $69,725 | 574 | 4.83/5.0 |
| Nia | 25 | $66,187 | 3534 | 4.84/5.0 |
| Arbi | 4 | $49,818 | 39 | 4.97/5.0 |
| Heryati | 2 | $45,123 | 191 | 4.86/5.0 |
Analyzing the strategies of top hosts, such as their property selection, pricing, and guest communication, can offer valuable lessons for optimizing your own Airbnb operations in Bandung.
Dive Deeper: Advanced Bandung STR Market Data (2026)
Ready to unlock more insights? AirROI provides access to advanced metrics and comprehensive Airbnb data for Bandung. Explore detailed analytics beyond this report to refine your investment strategy, optimize pricing, and maximize your vacation rental profits.
Explore Advanced MetricsBandung Short-Term Rental Market Composition (2026): Property & Room Types
Room Type Distribution
Property Type Distribution
Market Composition Insights for Bandung
- The Bandung Airbnb market composition is heavily skewed towards Entire Home/Apt listings, which make up 87.5% of the 879 active rentals. This indicates strong guest preference for privacy and space.
- Looking at the property type distribution in Bandung, Apartment/Condo properties are the most common (66.8%), reflecting the local real estate landscape.
- Houses represent a significant 25% portion, catering likely to families or larger groups.
- The presence of 6.1% Hotel/Boutique listings indicates integration with traditional hospitality.
- Smaller segments like others, outdoor/unique, unique stays (combined 2.0%) offer potential for unique stay experiences.
Bandung Airbnb Room Capacity Analysis (2026): Bedroom Distribution
Distribution of Listings by Number of Bedrooms
Room Capacity Insights for Bandung
- The dominant room capacity in Bandung is 2 bedrooms listings, making up 31.6% of the market. This suggests a strong demand for properties suitable for couples or solo travelers.
- Together, 2 bedrooms and 1 bedroom properties represent 59.7% of the active Airbnb listings in Bandung, indicating a high concentration in these sizes.
- A significant 28.8% of listings offer 3+ bedrooms, catering to larger groups and families seeking more space in Bandung.
Bandung Vacation Rental Guest Capacity Trends (2026)
Distribution of Listings by Guest Capacity
Guest Capacity Insights for Bandung
- The most common guest capacity trend in Bandung vacation rentals is listings accommodating 8+ guests (22.2%). This suggests the primary traveler segment is likely larger groups.
- Properties designed for 8+ guests and 4 guests dominate the Bandung STR market, accounting for 42.7% of listings.
- 37.6% of properties accommodate 6+ guests, serving the market segment for larger families or group travel in Bandung.
- On average, properties in Bandung are equipped to host 4.7 guests.
Bandung Airbnb Booking Patterns (2026): Available vs. Booked Days
Available Days Distribution
Booked Days Distribution
Booking Pattern Insights for Bandung
- The most common availability pattern in Bandung falls within the 271-366 days range, representing 73.6% of listings. This suggests many properties have significant open periods on their calendars.
- Approximately 92.8% of listings show high availability (181+ days open annually), indicating potential for increased bookings or specific owner usage patterns.
- For booked days, the 31-90 days range is most frequent in Bandung (38.5%), reflecting common guest stay durations or potential owner blocking patterns.
- A notable 7.6% of properties secure long booking periods (181+ days booked per year), highlighting successful long-term rental strategies or significant owner usage.
Bandung Airbnb Minimum Stay Requirements Analysis
Distribution of Listings by Minimum Night Requirement
1 Night
715 listings
81.3% of total
2 Nights
98 listings
11.1% of total
3 Nights
3 listings
0.3% of total
4-6 Nights
9 listings
1% of total
7-29 Nights
10 listings
1.1% of total
30+ Nights
44 listings
5% of total
Key Insights
- The most prevalent minimum stay requirement in Bandung is 1 Night, adopted by 81.3% of listings. This highlights the market's preference for shorter, flexible bookings.
- A strong majority (92.4%) of the Bandung Airbnb data shows acceptance of very short stays (1-2 nights), indicating a dynamic, high-turnover market.
Recommendations
- Align with the market by considering a 1 Night minimum stay, as 81.3% of Bandung hosts use this setting.
- Adjust minimum nights based on seasonality – potentially shorter during low season and longer during peak demand periods in Bandung.
Bandung Airbnb Cancellation Policy Trends Analysis (2026)
Limited
7 listings
0.8% of total
Super Strict 60 Days
4 listings
0.5% of total
Flexible
299 listings
34.1% of total
Moderate
220 listings
25.1% of total
Firm
184 listings
21% of total
Strict
164 listings
18.7% of total
Cancellation Policy Insights for Bandung
- The prevailing Airbnb cancellation policy trend in Bandung is Flexible, used by 34.1% of listings.
- There's a relatively balanced mix between guest-friendly (59.2%) and stricter (39.7%) policies, offering choices for different guest needs.
Recommendations for Hosts
- Consider adopting a Flexible policy to align with the 34.1% market standard in Bandung.
- Regularly review your cancellation policy against competitors and market demand shifts in Bandung.
Bandung STR Booking Lead Time Analysis (2026)
Average Booking Lead Time by Month
Booking Lead Time Insights for Bandung
- The overall average booking lead time for vacation rentals in Bandung is 19 days.
- Guests book furthest in advance for stays during December (average 24 days), likely coinciding with peak travel demand or local events.
- The shortest booking windows occur for stays in June (average 14 days), indicating more last-minute travel plans during this time.
- Seasonally, Spring (20 days avg.) sees the longest lead times, while Winter (19 days avg.) has the shortest, reflecting typical travel planning cycles.
Recommendations for Hosts
- Use the overall average lead time (19 days) as a baseline for your pricing and availability strategy in Bandung.
- Target marketing efforts for the Spring season well in advance (at least 20 days) to capture early planners.
- Monitor your own booking lead times against these Bandung averages to identify opportunities for dynamic pricing adjustments.
Popular & Essential Airbnb Amenities in Bandung (2026)
Amenity Prevalence
Amenity Insights for Bandung
- Essential amenities in Bandung that guests expect include: TV. Lacking these (this) could significantly impact bookings.
- Popular amenities like Wifi, Air conditioning, Kitchen are common but not universal. Offering these can provide a competitive edge.
- Warning: Wifi is not universally provided but is considered essential globally. Ensure reliable Wifi is offered.
Recommendations for Hosts
- Ensure your listing includes all essential amenities for Bandung: TV.
- Prioritize adding missing essentials: TV.
- Consider adding popular differentiators like Wifi or Air conditioning to increase appeal.
- Highlight unique or less common amenities you offer (e.g., hot tub, dedicated workspace, EV charger) in your listing description and photos.
- Regularly check competitor amenities in Bandung to stay competitive.
Bandung Airbnb Guest Demographics & Profile Analysis (2026)
Guest Profile Summary for Bandung
- The typical guest profile for Airbnb in Bandung consists of primarily domestic travelers (67%), often arriving from nearby Jakarta, typically belonging to the Post-2000s (Gen Z/Alpha) group (50%), primarily speaking English or Indonesian.
- Domestic travelers account for 66.7% of guests.
- Key international markets include Indonesia (66.7%) and Malaysia (7.2%).
- Top languages spoken are English (43.8%) followed by Indonesian (36.9%).
- A significant demographic segment is the Post-2000s (Gen Z/Alpha) group, representing 50% of guests.
Recommendations for Hosts
- Target domestic marketing efforts towards travelers from Jakarta and West Java.
- Tailor amenities and listing descriptions to appeal to the dominant Post-2000s (Gen Z/Alpha) demographic (e.g., highlight fast WiFi, smart home features, local guides).
- Highlight unique local experiences or amenities relevant to the primary guest profile.
- Consider seasonal promotions aligned with peak travel times for key origin markets.
Nearby Short-Term Rental Market Comparison
How does the Bandung Airbnb market stack up against its neighbors? Compare key performance metrics like average monthly revenue, ADR, and occupancy rates in surrounding areas to understand the broader regional STR landscape.
| Market | Active Properties | Monthly Revenue | Daily Rate | Avg. Occupancy |
|---|---|---|---|---|
| Kuta | 10 | $2,046 | $149.05 | 45% |
| Sukagalih | 13 | $1,306 | $157.45 | 34% |
| Citaringgul | 21 | $1,285 | $142.78 | 30% |
| Sukamanah | 12 | $1,151 | $148.28 | 28% |
| Ciburial | 191 | $1,114 | $288.50 | 18% |
| Leuwimalang | 15 | $1,109 | $203.41 | 20% |
| Wangunsari | 17 | $1,094 | $158.69 | 23% |
| Cigugur Girang | 21 | $1,057 | $163.07 | 19% |
| Sumur Batu | 50 | $1,026 | $180.80 | 21% |
| Kecamatan Parongpong | 14 | $1,014 | $182.15 | 23% |