Sariharjo Airbnb Market Analysis 2026: Short Term Rental Data & Vacation Rental Statistics in Special Region of Yogyakarta, Indonesia
Is Airbnb profitable in Sariharjo in 2026? Explore comprehensive Airbnb analytics for Sariharjo, Special Region of Yogyakarta, Indonesia to uncover income potential. This 2026 STR market report for Sariharjo, based on AirROI data from February 2025 to January 2026, reveals key trends in the niche market of 160 active listings.
Whether you're considering an Airbnb investment in Sariharjo, optimizing your existing vacation rental, or exploring rental arbitrage opportunities, understanding the Sariharjo Airbnb data is crucial. Leveraging the low regulation environment is key to maximizing your short term rental income potential. Let's dive into the specifics.
Key Sariharjo Airbnb Performance Metrics Overview
Monthly Airbnb Revenue Variations & Income Potential in Sariharjo (2026)
Understanding the monthly revenue variations for Airbnb listings in Sariharjo is key to maximizing your short term rental income potential. Seasonality significantly impacts earnings. Our analysis, based on data from the past 12 months, shows that the peak revenue month for STRs in Sariharjo is typically December, while November often presents the lowest earnings, highlighting opportunities for strategic pricing adjustments during shoulder and low seasons. Explore the typical Airbnb income in Sariharjo across different performance tiers:
- Best-in-class properties (Top 10%) achieve $1,063+ monthly, often utilizing dynamic pricing and superior guest experiences.
- Strong performing properties (Top 25%) earn $634 or more, indicating effective management and desirable locations/amenities.
- Typical properties (Median) generate around $342 per month, representing the average market performance.
- Entry-level properties (Bottom 25%) see earnings around $158, often with potential for optimization.
Average Monthly Airbnb Earnings Trend in Sariharjo
Sariharjo Airbnb Occupancy Rate Trends (2026)
Maximize your bookings by understanding the Sariharjo STR occupancy trends. Seasonal demand shifts significantly influence how often properties are booked. Typically, Julysees the highest demand (peak season occupancy), while March experiences the lowest (low season). Effective strategies, like adjusting minimum stays or offering promotions, can boost occupancy during slower periods. Here's how different property tiers perform in Sariharjo:
- Best-in-class properties (Top 10%) achieve 65%+ occupancy, indicating high desirability and potentially optimized availability.
- Strong performing properties (Top 25%) maintain 44% or higher occupancy, suggesting good market fit and guest satisfaction.
- Typical properties (Median) have an occupancy rate around 24%.
- Entry-level properties (Bottom 25%) average 12% occupancy, potentially facing higher vacancy.
Average Monthly Occupancy Rate Trend in Sariharjo
Average Daily Rate (ADR) Airbnb Trends in Sariharjo (2026)
Effective short term rental pricing strategy in Sariharjo involves understanding monthly ADR fluctuations. The Average Daily Rate (ADR) for Airbnb in Sariharjo typically peaks in April and dips lowest during November. Leveraging Airbnb dynamic pricing tools or strategies based on this seasonality can significantly boost revenue. Here's a look at the typical nightly rates achieved:
- Best-in-class properties (Top 10%) command rates of $106+ per night, often due to premium features or locations.
- Strong performing properties (Top 25%) achieve nightly rates of $55 or more.
- Typical properties (Median) charge around $39 per night.
- Entry-level properties (Bottom 25%) earn around $29 per night.
Average Daily Rate (ADR) Trend by Month in Sariharjo
Get Live Sariharjo Market Intelligence 👇

Explore Real-time Analytics
Airbnb Seasonality Analysis & Trends in Sariharjo (2026)
Peak Season (December, April, July)
- Revenue averages $670 per month
- Occupancy rates average 36.2%
- Daily rates average $58
Shoulder Season
- Revenue averages $498 per month
- Occupancy maintains around 30.2%
- Daily rates hold near $56
Low Season (January, October, November)
- Revenue drops to average $405 per month
- Occupancy decreases to average 27.0%
- Daily rates adjust to average $53
Seasonality Insights for Sariharjo
- The Airbnb seasonality in Sariharjo shows moderate seasonality with distinct peak and low periods. While the sections above show seasonal averages, it's also insightful to look at the extremes:
- During the high season, the absolute peak month showcases Sariharjo's highest earning potential, with monthly revenues capable of climbing to $700, occupancy reaching a high of 36.9%, and ADRs peaking at $60.
- Conversely, the slowest single month of the year, typically falling within the low season, marks the market's lowest point. In this month, revenue might dip to $391, occupancy could drop to 25.3%, and ADRs may adjust down to $52.
- Understanding both the seasonal averages and these monthly peaks and troughs in revenue, occupancy, and ADR is crucial for maximizing your Airbnb profit potential in Sariharjo.
Seasonal Strategies for Maximizing Profit
- Peak Season: Maximize revenue through premium pricing and potentially longer minimum stays. Ensure high availability.
- Low Season: Offer competitive pricing, special promotions (e.g., extended stay discounts), and flexible cancellation policies. Target off-season travelers like remote workers or budget-conscious guests.
- Shoulder Seasons: Implement dynamic pricing that balances peak and low rates. Target weekend travelers or specific events. Offer slightly more flexible terms than peak season.
- Regularly analyze your own performance against these Sariharjo seasonality benchmarks and adjust your pricing and availability strategy accordingly.
Best Areas for Airbnb Investment in Sariharjo (2026)
Exploring the top neighborhoods for short-term rentals in Sariharjo? This section highlights key areas, outlining why they are attractive for hosts and guests, along with notable local attractions. Consider these locations based on your target guest profile and investment strategy.
| Neighborhood / Area | Why Host Here? (Target Guests & Appeal) | Key Attractions & Landmarks |
|---|---|---|
| Canggu | Popular beach destination known for its surf breaks, rice paddies, and vibrant nightlife scene. Ideal for young travelers seeking an active lifestyle and artisan cafes. | Canggu Beach, Echo Beach, Bali Equestrian Center, La Brisa Beach Club, Tanah Lot Temple |
| Ubud | Cultural heart of Bali, surrounded by lush hills, rice terraces, and a lively arts scene. A great spot for guests interested in wellness, yoga, and Balinese culture. | Ubud Monkey Forest, Tegallalang Rice Terrace, Ubud Art Market, Puri Saren Royal Palace, Campuhan Ridge Walk |
| Seminyak | A bustling area known for its upscale restaurants, beaches, and shopping. Attracts tourists looking for luxury and relaxation in close proximity to the beach. | Double Six Beach, Seminyak Beach, Eat Street, Petitenget Temple, KU DE TA Beach Club |
| Kuta | Famous for its long sandy beaches and vibrant nightlife. Perfect for budget travelers and those looking to enjoy the beach and party scene. | Kuta Beach, Waterbom Bali, Beachwalk Shopping Center, Legian Street, Kuta Night Market |
| Nusa Dua | An exclusive resort area with luxury accommodations and pristine beaches. Popular among families and honeymooners seeking relaxation and opulence. | Nusa Dua Beach, Bali Collection, Geger Beach, Water Blow, Museum Pasifika |
| Jimbaran | Known for its seafood restaurants and beautiful beaches. Ideal for travelers looking for a romantic getaway or culinary experiences by the beach. | Jimbaran Beach, Jenggala Ceramics, Bali Seafood Centre, Tuban Beach, Balangan Beach |
| Lovina | Famous for its black volcanic sand beaches and dolphin watching. A tranquil alternative to the bustling southern beaches of Bali. | Lovina Beach, Dolphin Tours, Banjar Hot Springs, Brahmavihara-Arama, Gitgit Waterfall |
| Sukoharjo | A less touristy area that offers a glimpse of local life and culture. Great for those looking for a more authentic Balinese experience away from the crowds. | Sukoharjo Market, Local Temples, Cultural Workshops, Traditional Balinese Dance Performances, Rice Field Tours |
Understanding Airbnb License Requirements & STR Laws in Sariharjo (2026)
While Sariharjo, Special Region of Yogyakarta, Indonesia currently shows low STR regulations, specific Airbnb license requirements might still exist or change. Always verify the latest short term rental regulations and Airbnb license requirements directly with local government authorities for Sariharjo to ensure full compliance before hosting.
(Source: AirROI data, 2026, finding no licensed listings among those analyzed)
Top Performing Airbnb Properties in Sariharjo (2026)
Benchmark your potential! Explore examples of top-performing Airbnb properties in Sariharjobased on Trailing Twelve Month (TTM) revenue. Analyze their characteristics, revenue, occupancy rate, and ADR to understand what drives success in this market.

Zav Villa
Entire Place • 7 bedrooms
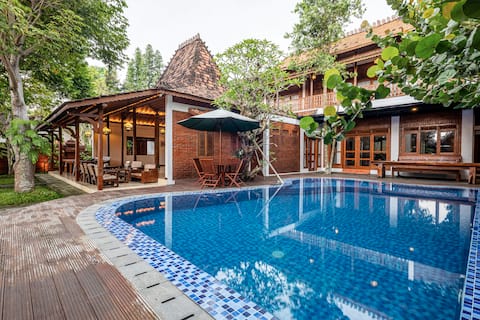
Exclusive villa&SPA 9Rooms+Breakfast +Pool
Private Room • 9 bedrooms
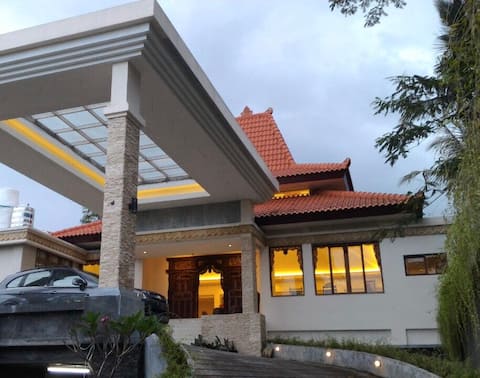
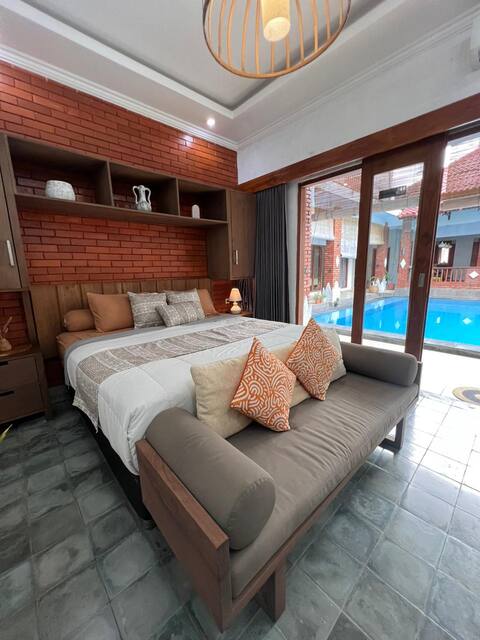
Luxurious Traditional House
Entire Place • 5 bedrooms
Eesa Villa Jogja With Private Pool
Entire Place • 6 bedrooms
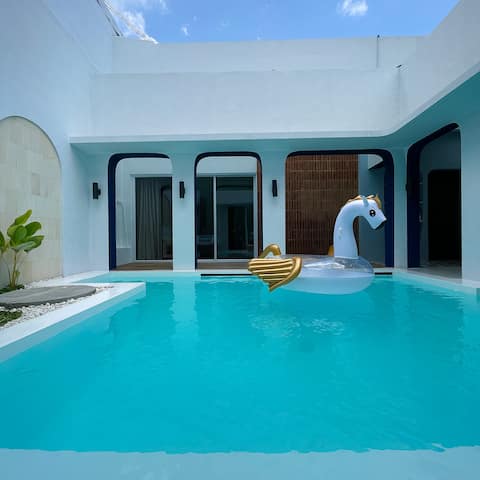
Unique Private Villa - fulton Avenue
Entire Place • 3 bedrooms
Villa Hyarta 3 Bedroom
Entire Place • 3 bedrooms
Note: Performance varies based on location, size, amenities, seasonality, and management quality. Data reflects the past 12 months.
Top Performing Airbnb Hosts in Sariharjo (2026)
Learn from the best! This table showcases top-performing Airbnb hosts in Sariharjo based on the number of properties managed and estimated total revenue over the past year. Analyze their scale and performance metrics.
| Host Name | Properties | Grossing Revenue | Stay Reviews | Avg Rating |
|---|---|---|---|---|
| Sari | 11 | $60,962 | 505 | 4.92/5.0 |
| Emi | 8 | $47,253 | 344 | 4.93/5.0 |
| Zav | 1 | $41,288 | 11 | 5.00/5.0 |
| Fulton Villa | 3 | $36,458 | 17 | 4.95/5.0 |
| Ndalem | 4 | $31,328 | 17 | 4.66/5.0 |
| Dany | 3 | $27,853 | 355 | 4.88/5.0 |
| Sarita Fraya | 3 | $24,394 | 99 | 4.98/5.0 |
| Alterstay Jogja | 1 | $23,985 | 8 | 5.00/5.0 |
| Robin | 1 | $22,547 | 24 | 4.79/5.0 |
| Yusuf | 3 | $18,051 | 244 | 4.98/5.0 |
Analyzing the strategies of top hosts, such as their property selection, pricing, and guest communication, can offer valuable lessons for optimizing your own Airbnb operations in Sariharjo.
Dive Deeper: Advanced Sariharjo STR Market Data (2026)
Ready to unlock more insights? AirROI provides access to advanced metrics and comprehensive Airbnb data for Sariharjo. Explore detailed analytics beyond this report to refine your investment strategy, optimize pricing, and maximize your vacation rental profits.
Explore Advanced MetricsSariharjo Short-Term Rental Market Composition (2026): Property & Room Types
Room Type Distribution
Property Type Distribution
Market Composition Insights for Sariharjo
- The Sariharjo Airbnb market composition is heavily skewed towards Entire Home/Apt listings, which make up 77.5% of the 160 active rentals. This indicates strong guest preference for privacy and space.
- Looking at the property type distribution in Sariharjo, Apartment/Condo properties are the most common (53.8%), reflecting the local real estate landscape.
- Houses represent a significant 40% portion, catering likely to families or larger groups.
- The presence of 5.6% Hotel/Boutique listings indicates integration with traditional hospitality.
- Smaller segments like outdoor/unique (combined 0.6%) offer potential for unique stay experiences.
Sariharjo Airbnb Room Capacity Analysis (2026): Bedroom Distribution
Distribution of Listings by Number of Bedrooms
Room Capacity Insights for Sariharjo
- The dominant room capacity in Sariharjo is 1 bedroom listings, making up 45% of the market. This suggests a strong demand for properties suitable for couples or solo travelers.
- Together, 1 bedroom and 2 bedrooms properties represent 62.5% of the active Airbnb listings in Sariharjo, indicating a high concentration in these sizes.
- A significant 24.5% of listings offer 3+ bedrooms, catering to larger groups and families seeking more space in Sariharjo.
Sariharjo Vacation Rental Guest Capacity Trends (2026)
Distribution of Listings by Guest Capacity
Guest Capacity Insights for Sariharjo
- The most common guest capacity trend in Sariharjo vacation rentals is listings accommodating 2 guests (29.4%). This suggests the primary traveler segment is likely couples or solo travelers.
- Properties designed for 2 guests and 8+ guests dominate the Sariharjo STR market, accounting for 44.4% of listings.
- 29.4% of properties accommodate 6+ guests, serving the market segment for larger families or group travel in Sariharjo.
- On average, properties in Sariharjo are equipped to host 3.8 guests.
Sariharjo Airbnb Booking Patterns (2026): Available vs. Booked Days
Available Days Distribution
Booked Days Distribution
Booking Pattern Insights for Sariharjo
- The most common availability pattern in Sariharjo falls within the 271-366 days range, representing 65% of listings. This suggests many properties have significant open periods on their calendars.
- Approximately 91.3% of listings show high availability (181+ days open annually), indicating potential for increased bookings or specific owner usage patterns.
- For booked days, the 1-30 days range is most frequent in Sariharjo (30.6%), reflecting common guest stay durations or potential owner blocking patterns.
- A notable 8.8% of properties secure long booking periods (181+ days booked per year), highlighting successful long-term rental strategies or significant owner usage.
Sariharjo Airbnb Minimum Stay Requirements Analysis
Distribution of Listings by Minimum Night Requirement
1 Night
127 listings
79.4% of total
2 Nights
16 listings
10% of total
3 Nights
4 listings
2.5% of total
30+ Nights
13 listings
8.1% of total
Key Insights
- The most prevalent minimum stay requirement in Sariharjo is 1 Night, adopted by 79.4% of listings. This highlights the market's preference for shorter, flexible bookings.
- A strong majority (89.4%) of the Sariharjo Airbnb data shows acceptance of very short stays (1-2 nights), indicating a dynamic, high-turnover market.
Recommendations
- Align with the market by considering a 1 Night minimum stay, as 79.4% of Sariharjo hosts use this setting.
- Explore offering discounts for stays of 30+ nights to attract the 8.1% of the market seeking extended stays.
- Adjust minimum nights based on seasonality – potentially shorter during low season and longer during peak demand periods in Sariharjo.
Sariharjo Airbnb Cancellation Policy Trends Analysis (2026)
Super Strict 30 Days
3 listings
1.9% of total
Limited
3 listings
1.9% of total
Flexible
68 listings
42.5% of total
Moderate
49 listings
30.6% of total
Firm
19 listings
11.9% of total
Strict
18 listings
11.3% of total
Cancellation Policy Insights for Sariharjo
- The prevailing Airbnb cancellation policy trend in Sariharjo is Flexible, used by 42.5% of listings.
- The market strongly favors guest-friendly terms, with 73.1% of listings offering Flexible or Moderate policies. This suggests guests in Sariharjo may expect booking flexibility.
Recommendations for Hosts
- Consider adopting a Flexible policy to align with the 42.5% market standard in Sariharjo.
- Using a Strict policy might deter some guests, as only 11.3% of listings use it. Evaluate if potential revenue protection outweighs possible lower booking rates.
- Regularly review your cancellation policy against competitors and market demand shifts in Sariharjo.
Sariharjo STR Booking Lead Time Analysis (2026)
Average Booking Lead Time by Month
Booking Lead Time Insights for Sariharjo
- The overall average booking lead time for vacation rentals in Sariharjo is 22 days.
- Guests book furthest in advance for stays during December (average 35 days), likely coinciding with peak travel demand or local events.
- The shortest booking windows occur for stays in January (average 15 days), indicating more last-minute travel plans during this time.
- Seasonally, Fall (24 days avg.) sees the longest lead times, while Spring (21 days avg.) has the shortest, reflecting typical travel planning cycles.
Recommendations for Hosts
- Use the overall average lead time (22 days) as a baseline for your pricing and availability strategy in Sariharjo.
- For December stays, consider implementing length-of-stay discounts or slightly higher rates for bookings made less than 35 days out to capitalize on advance planning.
- Target marketing efforts for the Fall season well in advance (at least 24 days) to capture early planners.
- Monitor your own booking lead times against these Sariharjo averages to identify opportunities for dynamic pricing adjustments.
Popular & Essential Airbnb Amenities in Sariharjo (2026)
Amenity Prevalence
Amenity Insights for Sariharjo
- Essential amenities in Sariharjo that guests expect include: Air conditioning, Free parking on premises, TV. Lacking these (any) could significantly impact bookings.
- Popular amenities like Wifi, Kitchen, Dishes and silverware are common but not universal. Offering these can provide a competitive edge.
- A pool is a highly desired but not standard amenity, making it a key feature for attracting guests seeking leisure in Sariharjo.
- Warning: Wifi is not universally provided but is considered essential globally. Ensure reliable Wifi is offered.
Recommendations for Hosts
- Ensure your listing includes all essential amenities for Sariharjo: Air conditioning, Free parking on premises, TV.
- Prioritize adding missing essentials: Air conditioning, Free parking on premises, TV.
- Consider adding popular differentiators like Wifi or Kitchen to increase appeal.
- Highlight unique or less common amenities you offer (e.g., hot tub, dedicated workspace, EV charger) in your listing description and photos.
- Regularly check competitor amenities in Sariharjo to stay competitive.
Sariharjo Airbnb Guest Demographics & Profile Analysis (2026)
Guest Profile Summary for Sariharjo
- The typical guest profile for Airbnb in Sariharjo consists of a mix of domestic (55%) and international guests, often arriving from nearby Jakarta, typically belonging to the Post-2000s (Gen Z/Alpha) group (50%), primarily speaking English or Indonesian.
- Domestic travelers account for 55.4% of guests.
- Key international markets include Indonesia (55.4%) and Australia (5.8%).
- Top languages spoken are English (42.9%) followed by Indonesian (30.4%).
- A significant demographic segment is the Post-2000s (Gen Z/Alpha) group, representing 50% of guests.
Recommendations for Hosts
- Balance marketing efforts between domestic and international channels based on the guest mix.
- Tailor amenities and listing descriptions to appeal to the dominant Post-2000s (Gen Z/Alpha) demographic (e.g., highlight fast WiFi, smart home features, local guides).
- Highlight unique local experiences or amenities relevant to the primary guest profile.
- Consider seasonal promotions aligned with peak travel times for key origin markets.
Nearby Short-Term Rental Market Comparison
How does the Sariharjo Airbnb market stack up against its neighbors? Compare key performance metrics like average monthly revenue, ADR, and occupancy rates in surrounding areas to understand the broader regional STR landscape.
| Market | Active Properties | Monthly Revenue | Daily Rate | Avg. Occupancy |
|---|---|---|---|---|
| Candibinangun | 10 | $713 | $112.01 | 18% |
| Bangunjiwo | 25 | $647 | $82.14 | 27% |
| Sardonoharjo | 11 | $490 | $120.34 | 17% |
| Sukoharjo | 16 | $469 | $90.40 | 24% |
| Maguwoharjo | 35 | $430 | $75.21 | 23% |
| Bangunharjo | 10 | $388 | $84.13 | 22% |
| Pandowoharjo | 15 | $364 | $106.80 | 16% |
| Bantul Regency | 153 | $336 | $54.68 | 24% |
| Sinduharjo | 25 | $319 | $60.83 | 27% |
| Timbulharjo | 12 | $313 | $72.72 | 24% |