Ngaglik Airbnb Market Analysis 2026: Short Term Rental Data & Vacation Rental Statistics in Special Region of Yogyakarta, Indonesia
Is Airbnb profitable in Ngaglik in 2026? Explore comprehensive Airbnb analytics for Ngaglik, Special Region of Yogyakarta, Indonesia to uncover income potential. This 2026 STR market report for Ngaglik, based on AirROI data from February 2025 to January 2026, reveals key trends in the niche market of 27 active listings.
Whether you're considering an Airbnb investment in Ngaglik, optimizing your existing vacation rental, or exploring rental arbitrage opportunities, understanding the Ngaglik Airbnb data is crucial. Leveraging the low regulation environment is key to maximizing your short term rental income potential. Let's dive into the specifics.
Key Ngaglik Airbnb Performance Metrics Overview
Monthly Airbnb Revenue Variations & Income Potential in Ngaglik (2026)
Understanding the monthly revenue variations for Airbnb listings in Ngaglik is key to maximizing your short term rental income potential. Seasonality significantly impacts earnings. Our analysis, based on data from the past 12 months, shows that the peak revenue month for STRs in Ngaglik is typically December, while September often presents the lowest earnings, highlighting opportunities for strategic pricing adjustments during shoulder and low seasons. Explore the typical Airbnb income in Ngaglik across different performance tiers:
- Best-in-class properties (Top 10%) achieve $976+ monthly, often utilizing dynamic pricing and superior guest experiences.
- Strong performing properties (Top 25%) earn $537 or more, indicating effective management and desirable locations/amenities.
- Typical properties (Median) generate around $309 per month, representing the average market performance.
- Entry-level properties (Bottom 25%) see earnings around $176, often with potential for optimization.
Average Monthly Airbnb Earnings Trend in Ngaglik
Ngaglik Airbnb Occupancy Rate Trends (2026)
Maximize your bookings by understanding the Ngaglik STR occupancy trends. Seasonal demand shifts significantly influence how often properties are booked. Typically, Decembersees the highest demand (peak season occupancy), while November experiences the lowest (low season). Effective strategies, like adjusting minimum stays or offering promotions, can boost occupancy during slower periods. Here's how different property tiers perform in Ngaglik:
- Best-in-class properties (Top 10%) achieve 45%+ occupancy, indicating high desirability and potentially optimized availability.
- Strong performing properties (Top 25%) maintain 29% or higher occupancy, suggesting good market fit and guest satisfaction.
- Typical properties (Median) have an occupancy rate around 19%.
- Entry-level properties (Bottom 25%) average 12% occupancy, potentially facing higher vacancy.
Average Monthly Occupancy Rate Trend in Ngaglik
Average Daily Rate (ADR) Airbnb Trends in Ngaglik (2026)
Effective short term rental pricing strategy in Ngaglik involves understanding monthly ADR fluctuations. The Average Daily Rate (ADR) for Airbnb in Ngaglik typically peaks in May and dips lowest during September. Leveraging Airbnb dynamic pricing tools or strategies based on this seasonality can significantly boost revenue. Here's a look at the typical nightly rates achieved:
- Best-in-class properties (Top 10%) command rates of $138+ per night, often due to premium features or locations.
- Strong performing properties (Top 25%) achieve nightly rates of $78 or more.
- Typical properties (Median) charge around $47 per night.
- Entry-level properties (Bottom 25%) earn around $34 per night.
Average Daily Rate (ADR) Trend by Month in Ngaglik
Get Live Ngaglik Market Intelligence 👇

Explore Real-time Analytics
Airbnb Seasonality Analysis & Trends in Ngaglik (2026)
Peak Season (December, April, February)
- Revenue averages $681 per month
- Occupancy rates average 31.0%
- Daily rates average $65
Shoulder Season
- Revenue averages $457 per month
- Occupancy maintains around 20.9%
- Daily rates hold near $63
Low Season (March, May, September)
- Revenue drops to average $336 per month
- Occupancy decreases to average 18.2%
- Daily rates adjust to average $62
Seasonality Insights for Ngaglik
- The Airbnb seasonality in Ngaglik shows highly seasonal trends requiring careful strategy. While the sections above show seasonal averages, it's also insightful to look at the extremes:
- During the high season, the absolute peak month showcases Ngaglik's highest earning potential, with monthly revenues capable of climbing to $887, occupancy reaching a high of 38.1%, and ADRs peaking at $66.
- Conversely, the slowest single month of the year, typically falling within the low season, marks the market's lowest point. In this month, revenue might dip to $324, occupancy could drop to 13.3%, and ADRs may adjust down to $57.
- Understanding both the seasonal averages and these monthly peaks and troughs in revenue, occupancy, and ADR is crucial for maximizing your Airbnb profit potential in Ngaglik.
Seasonal Strategies for Maximizing Profit
- Peak Season: Maximize revenue through premium pricing and potentially longer minimum stays. Ensure high availability.
- Low Season: Offer competitive pricing, special promotions (e.g., extended stay discounts), and flexible cancellation policies. Target off-season travelers like remote workers or budget-conscious guests.
- Shoulder Seasons: Implement dynamic pricing that balances peak and low rates. Target weekend travelers or specific events. Offer slightly more flexible terms than peak season.
- Regularly analyze your own performance against these Ngaglik seasonality benchmarks and adjust your pricing and availability strategy accordingly.
Best Areas for Airbnb Investment in Ngaglik (2026)
Exploring the top neighborhoods for short-term rentals in Ngaglik? This section highlights key areas, outlining why they are attractive for hosts and guests, along with notable local attractions. Consider these locations based on your target guest profile and investment strategy.
| Neighborhood / Area | Why Host Here? (Target Guests & Appeal) | Key Attractions & Landmarks |
|---|---|---|
| Sleman | A bustling district known for its cultural diversity and proximity to Yogyakarta city center. It offers easy access to numerous attractions and educational institutions, making it ideal for families and students. | Gadjah Mada University, Sleman City Hall, Sumur Gumuling, Jogja Bay Waterpark, Kota Gede, Prambanan Temple |
| Bantul | Renowned for its natural beauty and cultural heritage, Bantul attracts tourists looking for a more serene environment with traditional markets, beaches, and art villages. | Parangtritis Beach, Bantul Traditional Market, Kasongan Village, Sultan Ground, Puncak Becici, Nglanggeran Ancient Volcano |
| Pakem | A peaceful rural area great for eco-tourism and retreats, offering stunning views of rice fields and Mount Merapi, attracting nature lovers and adventure seekers. | Mount Merapi, Taman Kaliurang, Kalasan Temple, Candi Banyunibo, Gerbosari Nature Park, Taman Sari |
| Cangkringan | Located near the slopes of Mount Merapi, this area is perfect for adventure tourism and eco-lodges, attracting thrill-seekers and nature enthusiasts. | Merapi Lava Tour, The Lost World Castle, Kaliurang, Bunker Merapi, Malioboro Street, Cave Tubing |
| Godean | A suburban area known for its friendly community and local attractions, making it a good spot for family-oriented travelers and longer stays. | Godean Waterfall, Local Culinary Spots, Kalimati Hill, Candi Sari, Puncak Sari, Traditional Batik Workshops |
| Bontang | A developing area appealing to industrial tourists and business travelers due to nearby companies and facilities, with potential for short-term rentals. | Bontang Kuala, Bontang City Park, Taman Nasional Kutai, Luwu Beach, Local Seafood Markets, Cultural Festivals |
| Samigaluh | This area offers stunning views and access to unique historical sites, attracting those interested in Yogyakarta's rich history and rural experiences. | Candi Selogriyo, Gunung Sumbing, Candi Gedongsongo, Asri Waterfall, Jatisura Hill, Traditional Villages |
| Wonosari | Known for its karst hills and natural attractions, this area is growing in popularity among tourists seeking adventure and natural beauty beyond Yogyakarta. | Nglanggeran Ancient Volcano, Timang Beach, Jogyakarta Caves, Gumuk Pasir, Hiking Trails, Local Tea Plantations |
Understanding Airbnb License Requirements & STR Laws in Ngaglik (2026)
While Ngaglik, Special Region of Yogyakarta, Indonesia currently shows low STR regulations, specific Airbnb license requirements might still exist or change. Always verify the latest short term rental regulations and Airbnb license requirements directly with local government authorities for Ngaglik to ensure full compliance before hosting.
(Source: AirROI data, 2026, based on 4% licensed listings)
Top Performing Airbnb Properties in Ngaglik (2026)
Benchmark your potential! Explore examples of top-performing Airbnb properties in Ngaglikbased on Trailing Twelve Month (TTM) revenue. Analyze their characteristics, revenue, occupancy rate, and ADR to understand what drives success in this market.

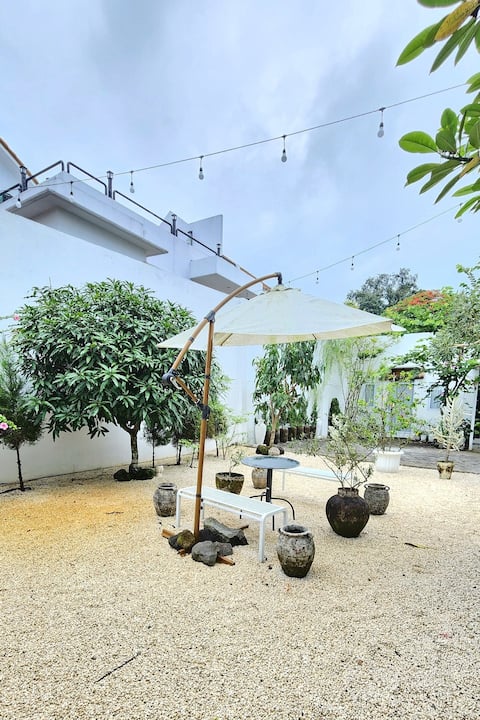
Yogyakarta Clean House
Entire Place • 6 bedrooms

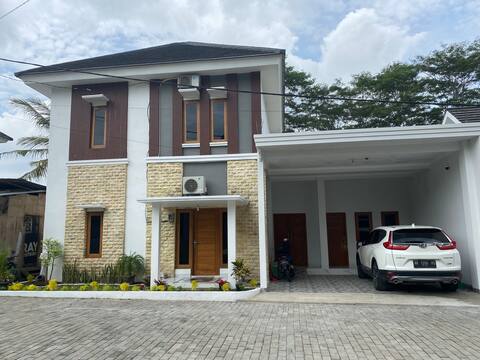
Kana Villa• Calm, Cozy, 15 minutes to city centre
Entire Place • 4 bedrooms
2BR Private Pool Floraison Living Villa Yogyakarta
Entire Place • 1 bedroom
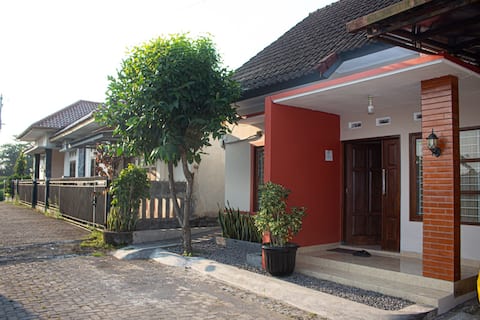
AW Lor House - Yogyakarta
Entire Place • 4 bedrooms
Little Jogja Homestay
Entire Place • 2 bedrooms

Ricefield Bird Nest - 2nd floor
Entire Place • 1 bedroom
Note: Performance varies based on location, size, amenities, seasonality, and management quality. Data reflects the past 12 months.
Top Performing Airbnb Hosts in Ngaglik (2026)
Learn from the best! This table showcases top-performing Airbnb hosts in Ngaglik based on the number of properties managed and estimated total revenue over the past year. Analyze their scale and performance metrics.
| Host Name | Properties | Grossing Revenue | Stay Reviews | Avg Rating |
|---|---|---|---|---|
| Arin | 1 | $18,441 | 10 | 5.00/5.0 |
| Luluk | 4 | $9,679 | 153 | 4.80/5.0 |
| Ann | 1 | $7,703 | 127 | 4.76/5.0 |
| Floraison | 1 | $7,327 | 2 | Not Rated |
| Anton | 1 | $6,468 | 38 | 4.87/5.0 |
| Baiq | 1 | $4,921 | 46 | 4.83/5.0 |
| Mesvara.Id | 1 | $4,019 | 2 | Not Rated |
| We Stay | 1 | $3,735 | 1 | Not Rated |
| Dios | 1 | $3,605 | 124 | 4.75/5.0 |
| Muhammad Teguh | 1 | $3,448 | 8 | 4.38/5.0 |
Analyzing the strategies of top hosts, such as their property selection, pricing, and guest communication, can offer valuable lessons for optimizing your own Airbnb operations in Ngaglik.
Dive Deeper: Advanced Ngaglik STR Market Data (2026)
Ready to unlock more insights? AirROI provides access to advanced metrics and comprehensive Airbnb data for Ngaglik. Explore detailed analytics beyond this report to refine your investment strategy, optimize pricing, and maximize your vacation rental profits.
Explore Advanced MetricsNgaglik Short-Term Rental Market Composition (2026): Property & Room Types
Room Type Distribution
Property Type Distribution
Market Composition Insights for Ngaglik
- The Ngaglik Airbnb market composition is heavily skewed towards Entire Home/Apt listings, which make up 85.2% of the 27 active rentals. This indicates strong guest preference for privacy and space.
- Looking at the property type distribution in Ngaglik, House properties are the most common (70.4%), reflecting the local real estate landscape.
- Houses represent a significant 70.4% portion, catering likely to families or larger groups.
- Smaller segments like hotel/boutique, others (combined 7.4%) offer potential for unique stay experiences.
Ngaglik Airbnb Room Capacity Analysis (2026): Bedroom Distribution
Distribution of Listings by Number of Bedrooms
Room Capacity Insights for Ngaglik
- The dominant room capacity in Ngaglik is 2 bedrooms listings, making up 29.6% of the market. This suggests a strong demand for properties suitable for couples or solo travelers.
- Together, 2 bedrooms and 1 bedroom properties represent 51.8% of the active Airbnb listings in Ngaglik, indicating a high concentration in these sizes.
- A significant 37.0% of listings offer 3+ bedrooms, catering to larger groups and families seeking more space in Ngaglik.
Ngaglik Vacation Rental Guest Capacity Trends (2026)
Distribution of Listings by Guest Capacity
Guest Capacity Insights for Ngaglik
- The most common guest capacity trend in Ngaglik vacation rentals is listings accommodating 8+ guests (22.2%). This suggests the primary traveler segment is likely larger groups.
- Properties designed for 8+ guests and 6 guests dominate the Ngaglik STR market, accounting for 44.4% of listings.
- 48.1% of properties accommodate 6+ guests, serving the market segment for larger families or group travel in Ngaglik.
- On average, properties in Ngaglik are equipped to host 4.8 guests.
Ngaglik Airbnb Booking Patterns (2026): Available vs. Booked Days
Available Days Distribution
Booked Days Distribution
Booking Pattern Insights for Ngaglik
- The most common availability pattern in Ngaglik falls within the 271-366 days range, representing 88.9% of listings. This suggests many properties have significant open periods on their calendars.
- Approximately 100.0% of listings show high availability (181+ days open annually), indicating potential for increased bookings or specific owner usage patterns.
- For booked days, the 1-30 days range is most frequent in Ngaglik (48.1%), reflecting common guest stay durations or potential owner blocking patterns.
Ngaglik Airbnb Minimum Stay Requirements Analysis
Distribution of Listings by Minimum Night Requirement
1 Night
25 listings
92.6% of total
2 Nights
1 listings
3.7% of total
30+ Nights
1 listings
3.7% of total
Key Insights
- The most prevalent minimum stay requirement in Ngaglik is 1 Night, adopted by 92.6% of listings. This highlights the market's preference for shorter, flexible bookings.
- A strong majority (96.3%) of the Ngaglik Airbnb data shows acceptance of very short stays (1-2 nights), indicating a dynamic, high-turnover market.
Recommendations
- Align with the market by considering a 1 Night minimum stay, as 92.6% of Ngaglik hosts use this setting.
- Adjust minimum nights based on seasonality – potentially shorter during low season and longer during peak demand periods in Ngaglik.
Ngaglik Airbnb Cancellation Policy Trends Analysis (2026)
Super Strict 60 Days
1 listings
3.7% of total
Flexible
10 listings
37% of total
Moderate
7 listings
25.9% of total
Firm
7 listings
25.9% of total
Strict
2 listings
7.4% of total
Cancellation Policy Insights for Ngaglik
- The prevailing Airbnb cancellation policy trend in Ngaglik is Flexible, used by 37% of listings.
- There's a relatively balanced mix between guest-friendly (62.9%) and stricter (33.3%) policies, offering choices for different guest needs.
- Strict cancellation policies are quite rare (7.4%), potentially making listings with this policy less competitive unless justified by high demand or property type.
Recommendations for Hosts
- Consider adopting a Flexible policy to align with the 37% market standard in Ngaglik.
- Using a Strict policy might deter some guests, as only 7.4% of listings use it. Evaluate if potential revenue protection outweighs possible lower booking rates.
- Regularly review your cancellation policy against competitors and market demand shifts in Ngaglik.
Ngaglik STR Booking Lead Time Analysis (2026)
Average Booking Lead Time by Month
Booking Lead Time Insights for Ngaglik
- The overall average booking lead time for vacation rentals in Ngaglik is 21 days.
- Guests book furthest in advance for stays during June (average 37 days), likely coinciding with peak travel demand or local events.
- The shortest booking windows occur for stays in July (average 8 days), indicating more last-minute travel plans during this time.
- Seasonally, Fall (22 days avg.) sees the longest lead times, while Winter (14 days avg.) has the shortest, reflecting typical travel planning cycles.
Recommendations for Hosts
- Use the overall average lead time (21 days) as a baseline for your pricing and availability strategy in Ngaglik.
- For June stays, consider implementing length-of-stay discounts or slightly higher rates for bookings made less than 37 days out to capitalize on advance planning.
- During July, focus on last-minute booking availability and promotions, as guests book with very short notice (8 days avg.).
- Target marketing efforts for the Fall season well in advance (at least 22 days) to capture early planners.
- Monitor your own booking lead times against these Ngaglik averages to identify opportunities for dynamic pricing adjustments.
Popular & Essential Airbnb Amenities in Ngaglik (2026)
Amenity Prevalence
Amenity Insights for Ngaglik
- Essential amenities in Ngaglik that guests expect include: Air conditioning, TV, Wifi, Free parking on premises. Lacking these (any) could significantly impact bookings.
- Popular amenities like Kitchen, Hot water, Refrigerator are common but not universal. Offering these can provide a competitive edge.
Recommendations for Hosts
- Ensure your listing includes all essential amenities for Ngaglik: Air conditioning, TV, Wifi, Free parking on premises.
- Prioritize adding missing essentials: TV, Wifi, Free parking on premises.
- Consider adding popular differentiators like Kitchen or Hot water to increase appeal.
- Highlight unique or less common amenities you offer (e.g., hot tub, dedicated workspace, EV charger) in your listing description and photos.
- Regularly check competitor amenities in Ngaglik to stay competitive.
Ngaglik Airbnb Guest Demographics & Profile Analysis (2026)
Guest Profile Summary for Ngaglik
- The typical guest profile for Airbnb in Ngaglik consists of primarily domestic travelers (84%), often arriving from nearby Jakarta, typically belonging to the Post-2000s (Gen Z/Alpha) group (50%), primarily speaking Indonesian or English.
- Domestic travelers account for 84.2% of guests.
- Key international markets include Indonesia (84.2%) and United Kingdom (5.3%).
- Top languages spoken are Indonesian (52.6%) followed by English (47.4%).
- A significant demographic segment is the Post-2000s (Gen Z/Alpha) group, representing 50% of guests.
Recommendations for Hosts
- Target domestic marketing efforts towards travelers from Jakarta and East Java.
- Tailor amenities and listing descriptions to appeal to the dominant Post-2000s (Gen Z/Alpha) demographic (e.g., highlight fast WiFi, smart home features, local guides).
- Highlight unique local experiences or amenities relevant to the primary guest profile.
- Consider seasonal promotions aligned with peak travel times for key origin markets.
Nearby Short-Term Rental Market Comparison
How does the Ngaglik Airbnb market stack up against its neighbors? Compare key performance metrics like average monthly revenue, ADR, and occupancy rates in surrounding areas to understand the broader regional STR landscape.
| Market | Active Properties | Monthly Revenue | Daily Rate | Avg. Occupancy |
|---|---|---|---|---|
| Candibinangun | 10 | $713 | $112.01 | 18% |
| Bangunjiwo | 25 | $647 | $82.14 | 27% |
| Sardonoharjo | 11 | $490 | $120.34 | 17% |
| Sukoharjo | 16 | $469 | $90.40 | 24% |
| Maguwoharjo | 35 | $430 | $75.21 | 23% |
| Bangunharjo | 10 | $388 | $84.13 | 22% |
| Pandowoharjo | 15 | $364 | $106.80 | 16% |
| Sariharjo | 160 | $347 | $56.11 | 28% |
| Bantul Regency | 153 | $336 | $54.68 | 24% |
| Sinduharjo | 25 | $319 | $60.83 | 27% |