Muara Airbnb Market Analysis 2026: Short Term Rental Data & Vacation Rental Statistics in Java, Indonesia
Is Airbnb profitable in Muara in 2026? Explore comprehensive Airbnb analytics for Muara, Java, Indonesia to uncover income potential. This 2026 STR market report for Muara, based on AirROI data from February 2025 to January 2026, reveals key trends in the niche market of 103 active listings.
Whether you're considering an Airbnb investment in Muara, optimizing your existing vacation rental, or exploring rental arbitrage opportunities, understanding the Muara Airbnb data is crucial. Leveraging the low regulation environment is key to maximizing your short term rental income potential. Let's dive into the specifics.
Key Muara Airbnb Performance Metrics Overview
Monthly Airbnb Revenue Variations & Income Potential in Muara (2026)
Understanding the monthly revenue variations for Airbnb listings in Muara is key to maximizing your short term rental income potential. Seasonality significantly impacts earnings. Our analysis, based on data from the past 12 months, shows that the peak revenue month for STRs in Muara is typically December, while November often presents the lowest earnings, highlighting opportunities for strategic pricing adjustments during shoulder and low seasons. Explore the typical Airbnb income in Muara across different performance tiers:
- Best-in-class properties (Top 10%) achieve $484+ monthly, often utilizing dynamic pricing and superior guest experiences.
- Strong performing properties (Top 25%) earn $305 or more, indicating effective management and desirable locations/amenities.
- Typical properties (Median) generate around $174 per month, representing the average market performance.
- Entry-level properties (Bottom 25%) see earnings around $82, often with potential for optimization.
Average Monthly Airbnb Earnings Trend in Muara
Muara Airbnb Occupancy Rate Trends (2026)
Maximize your bookings by understanding the Muara STR occupancy trends. Seasonal demand shifts significantly influence how often properties are booked. Typically, Februarysees the highest demand (peak season occupancy), while July experiences the lowest (low season). Effective strategies, like adjusting minimum stays or offering promotions, can boost occupancy during slower periods. Here's how different property tiers perform in Muara:
- Best-in-class properties (Top 10%) achieve 60%+ occupancy, indicating high desirability and potentially optimized availability.
- Strong performing properties (Top 25%) maintain 44% or higher occupancy, suggesting good market fit and guest satisfaction.
- Typical properties (Median) have an occupancy rate around 26%.
- Entry-level properties (Bottom 25%) average 13% occupancy, potentially facing higher vacancy.
Average Monthly Occupancy Rate Trend in Muara
Average Daily Rate (ADR) Airbnb Trends in Muara (2026)
Effective short term rental pricing strategy in Muara involves understanding monthly ADR fluctuations. The Average Daily Rate (ADR) for Airbnb in Muara typically peaks in December and dips lowest during February. Leveraging Airbnb dynamic pricing tools or strategies based on this seasonality can significantly boost revenue. Here's a look at the typical nightly rates achieved:
- Best-in-class properties (Top 10%) command rates of $34+ per night, often due to premium features or locations.
- Strong performing properties (Top 25%) achieve nightly rates of $28 or more.
- Typical properties (Median) charge around $19 per night.
- Entry-level properties (Bottom 25%) earn around $16 per night.
Average Daily Rate (ADR) Trend by Month in Muara
Get Live Muara Market Intelligence 👇

Explore Real-time Analytics
Airbnb Seasonality Analysis & Trends in Muara (2026)
Peak Season (December, January, June)
- Revenue averages $259 per month
- Occupancy rates average 31.0%
- Daily rates average $28
Shoulder Season
- Revenue averages $230 per month
- Occupancy maintains around 31.7%
- Daily rates hold near $27
Low Season (May, July, November)
- Revenue drops to average $206 per month
- Occupancy decreases to average 27.7%
- Daily rates adjust to average $27
Seasonality Insights for Muara
- The Airbnb seasonality in Muara shows moderate seasonality with distinct peak and low periods. While the sections above show seasonal averages, it's also insightful to look at the extremes:
- During the high season, the absolute peak month showcases Muara's highest earning potential, with monthly revenues capable of climbing to $285, occupancy reaching a high of 37.1%, and ADRs peaking at $30.
- Conversely, the slowest single month of the year, typically falling within the low season, marks the market's lowest point. In this month, revenue might dip to $205, occupancy could drop to 25.7%, and ADRs may adjust down to $26.
- Understanding both the seasonal averages and these monthly peaks and troughs in revenue, occupancy, and ADR is crucial for maximizing your Airbnb profit potential in Muara.
Seasonal Strategies for Maximizing Profit
- Peak Season: Maximize revenue through premium pricing and potentially longer minimum stays. Ensure high availability.
- Low Season: Offer competitive pricing, special promotions (e.g., extended stay discounts), and flexible cancellation policies. Target off-season travelers like remote workers or budget-conscious guests.
- Shoulder Seasons: Implement dynamic pricing that balances peak and low rates. Target weekend travelers or specific events. Offer slightly more flexible terms than peak season.
- Regularly analyze your own performance against these Muara seasonality benchmarks and adjust your pricing and availability strategy accordingly.
Best Areas for Airbnb Investment in Muara (2026)
Exploring the top neighborhoods for short-term rentals in Muara? This section highlights key areas, outlining why they are attractive for hosts and guests, along with notable local attractions. Consider these locations based on your target guest profile and investment strategy.
| Neighborhood / Area | Why Host Here? (Target Guests & Appeal) | Key Attractions & Landmarks |
|---|---|---|
| Pangandaran Beach | A popular beach destination known for its stunning coastline and vibrant culture. Ideal for tourists looking for beach activities and a laid-back atmosphere. | Pangandaran Nature Reserve, Green Canyon, Pangandaran Beach, Sunset Point, CITILink Beach |
| Yogyakarta | A cultural hub with a rich history, attracting both tourists and academics. Known for its traditional arts and heritage, it’s perfect for visitors interested in culture and history. | Borobudur Temple, Prambanan Temple, Yogyakarta Palace, Malioboro Street, Kota Gede |
| Bandung | Known for its cool climate and beautiful mountain scenery, Bandung attracts city dwellers from Jakarta looking for a weekend getaway. Popular for shopping and culinary delights. | Tangkuban Perahu, Kawah Putih Lake, Braga Street, Bandung Zoo, Dusun Bambu |
| Malang | A charming city surrounded by mountains and known for its historical sites. Popular with travelers looking for adventure and nature excursions. | Batu Secret Zoo, Jatim Park, Bromo Mountain, Malang Night Paradise, Ijen Crater |
| Bali | A world-renowned island paradise attracting tourists for its picturesque beaches, temples, and vibrant nightlife. Perfect for short-term rental investment. | Uluwatu Temple, Kuta Beach, Seminyak, Rice Terraces of Ubud, Tanah Lot |
| Batam | An emerging tourism destination close to Singapore, ideal for business and leisure travelers. Offers affordable accommodation with shopping and entertainment options. | Batam Island, Nagoya Hill Shopping Mall, Maha Vihara Duta Maitreya Temple, Barelang Bridge, Tamarin Santana Golf Club |
| Tangerang | Close to Jakarta, this area attracts business travelers and is growing in popularity with local tourists. A variety of entertainment and shopping options are available here. | AEON Mall, TangCity Mall, Summarecon Mall, Citra Raya, Kota Modern |
| Cirebon | A historical city known for its culture and heritage, Cirebon is increasingly attracting tourists interested in traditional Indonesian culture and local cuisine. | Keraton Kasepuhan, Masjid Agung Sang Cipta Rasa, Cirebon Batik, Sunan Gunung Jati Grave, Telaga Remis |
Understanding Airbnb License Requirements & STR Laws in Muara (2026)
While Muara, Java, Indonesia currently shows low STR regulations, specific Airbnb license requirements might still exist or change. Always verify the latest short term rental regulations and Airbnb license requirements directly with local government authorities for Muara to ensure full compliance before hosting.
(Source: AirROI data, 2026, finding no licensed listings among those analyzed)
Top Performing Airbnb Properties in Muara (2026)
Benchmark your potential! Explore examples of top-performing Airbnb properties in Muarabased on Trailing Twelve Month (TTM) revenue. Analyze their characteristics, revenue, occupancy rate, and ADR to understand what drives success in this market.
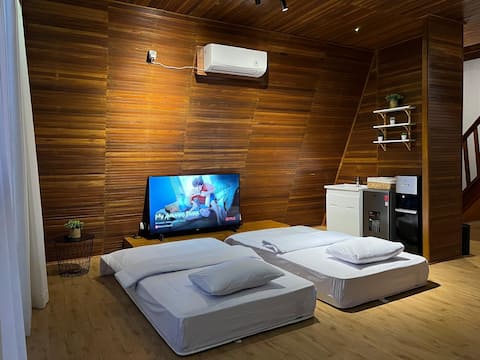
Family Cabin#1 Lake Toba for 10pax
Private Room • 3 bedrooms
3 Bed Room Tokyo Riverside PIK 2 Wifi 2 Bathroom
Entire Place • 3 bedrooms
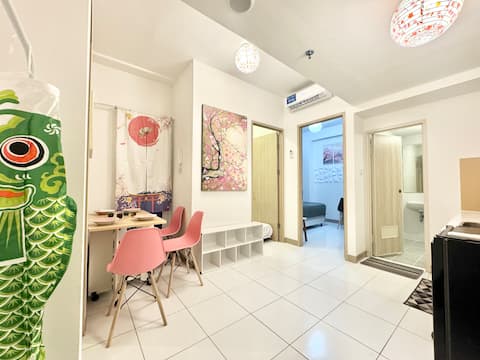
2 Rooms, Can Accommodate 4 people, Tokyo Riverside Apartment.
Entire Place • 2 bedrooms

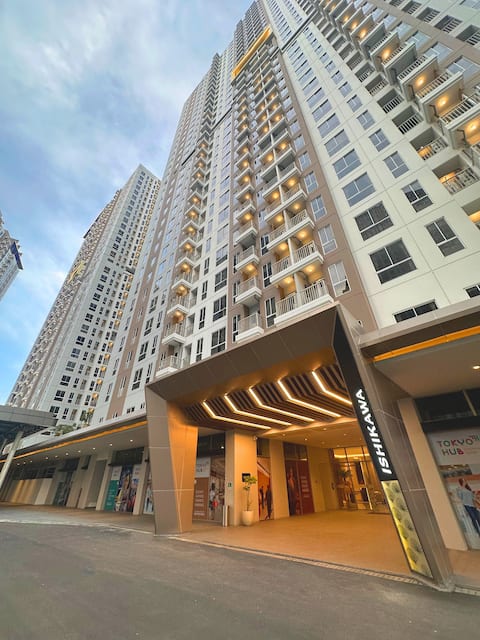
iMazinn - Beppu Suite Room, PIK2
Entire Place • 1 bedroom
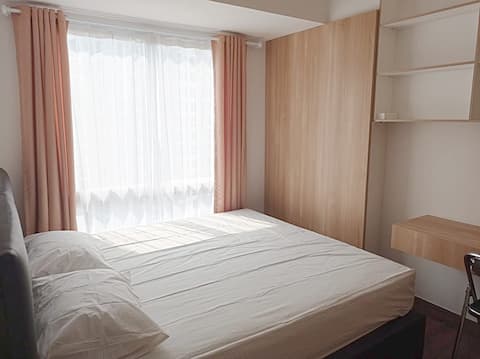
Tokyo Riverside - Cozy 2 Bedroom with Pool View
Entire Place • 2 bedrooms

Family Cabin#2 Lake Toba 10Pax
Private Room • 3 bedrooms
Note: Performance varies based on location, size, amenities, seasonality, and management quality. Data reflects the past 12 months.
Top Performing Airbnb Hosts in Muara (2026)
Learn from the best! This table showcases top-performing Airbnb hosts in Muara based on the number of properties managed and estimated total revenue over the past year. Analyze their scale and performance metrics.
| Host Name | Properties | Grossing Revenue | Stay Reviews | Avg Rating |
|---|---|---|---|---|
| Andre | 26 | $52,142 | 1509 | 4.83/5.0 |
| Steven Kah Hooi | 8 | $20,084 | 130 | 4.76/5.0 |
| ComfortZoneLiving | 8 | $16,988 | 291 | 4.85/5.0 |
| Christian | 5 | $16,979 | 239 | 4.94/5.0 |
| Alvin Rizky | 3 | $16,782 | 9 | 4.80/5.0 |
| Imazinn | 2 | $10,745 | 66 | 4.54/5.0 |
| Khal | 2 | $9,932 | 72 | 4.80/5.0 |
| Jaya | 1 | $5,997 | 33 | 5.00/5.0 |
| Willy | 1 | $5,667 | 27 | 4.93/5.0 |
| Kennedy | 1 | $5,169 | 22 | 4.77/5.0 |
Analyzing the strategies of top hosts, such as their property selection, pricing, and guest communication, can offer valuable lessons for optimizing your own Airbnb operations in Muara.
Dive Deeper: Advanced Muara STR Market Data (2026)
Ready to unlock more insights? AirROI provides access to advanced metrics and comprehensive Airbnb data for Muara. Explore detailed analytics beyond this report to refine your investment strategy, optimize pricing, and maximize your vacation rental profits.
Explore Advanced MetricsMuara Short-Term Rental Market Composition (2026): Property & Room Types
Room Type Distribution
Property Type Distribution
Market Composition Insights for Muara
- The Muara Airbnb market composition is heavily skewed towards Entire Home/Apt listings, which make up 96.1% of the 103 active rentals. This indicates strong guest preference for privacy and space.
- Looking at the property type distribution in Muara, Apartment/Condo properties are the most common (98.1%), reflecting the local real estate landscape.
- Smaller segments like outdoor/unique (combined 1.9%) offer potential for unique stay experiences.
Muara Airbnb Room Capacity Analysis (2026): Bedroom Distribution
Distribution of Listings by Number of Bedrooms
Room Capacity Insights for Muara
- The dominant room capacity in Muara is 1 bedroom listings, making up 72.8% of the market. This suggests a strong demand for properties suitable for couples or solo travelers.
- Together, 1 bedroom and 2 bedrooms properties represent 88.3% of the active Airbnb listings in Muara, indicating a high concentration in these sizes.
- With over half the market (72.8%) consisting of studios or 1-bedroom units, Muara is particularly well-suited for individuals or couples.
- Listings with 3+ bedrooms (2.9%) represent a smaller niche, potentially indicating an underserved market for larger group accommodations in Muara.
Muara Vacation Rental Guest Capacity Trends (2026)
Distribution of Listings by Guest Capacity
Guest Capacity Insights for Muara
- The most common guest capacity trend in Muara vacation rentals is listings accommodating 2 guests (65%). This suggests the primary traveler segment is likely couples or solo travelers.
- Properties designed for 2 guests and 3 guests dominate the Muara STR market, accounting for 81.5% of listings.
- A significant 67.9% of listings cater specifically to 1-2 guests, highlighting strong demand from couples and solo travelers in Muara.
- Listings for large groups (6+ guests) are relatively rare (1.9%), potentially indicating an opportunity for hosts targeting this segment in Muara.
- On average, properties in Muara are equipped to host 2.4 guests.
Muara Airbnb Booking Patterns (2026): Available vs. Booked Days
Available Days Distribution
Booked Days Distribution
Booking Pattern Insights for Muara
- The most common availability pattern in Muara falls within the 271-366 days range, representing 57.3% of listings. This suggests many properties have significant open periods on their calendars.
- Approximately 96.1% of listings show high availability (181+ days open annually), indicating potential for increased bookings or specific owner usage patterns.
- For booked days, the 91-180 days range is most frequent in Muara (43.7%), reflecting common guest stay durations or potential owner blocking patterns.
- A notable 3.9% of properties secure long booking periods (181+ days booked per year), highlighting successful long-term rental strategies or significant owner usage.
Muara Airbnb Minimum Stay Requirements Analysis
Distribution of Listings by Minimum Night Requirement
1 Night
80 listings
77.7% of total
2 Nights
10 listings
9.7% of total
3 Nights
1 listings
1% of total
4-6 Nights
2 listings
1.9% of total
7-29 Nights
3 listings
2.9% of total
30+ Nights
7 listings
6.8% of total
Key Insights
- The most prevalent minimum stay requirement in Muara is 1 Night, adopted by 77.7% of listings. This highlights the market's preference for shorter, flexible bookings.
- A strong majority (87.4%) of the Muara Airbnb data shows acceptance of very short stays (1-2 nights), indicating a dynamic, high-turnover market.
Recommendations
- Align with the market by considering a 1 Night minimum stay, as 77.7% of Muara hosts use this setting.
- Explore offering discounts for stays of 30+ nights to attract the 6.8% of the market seeking extended stays.
- Adjust minimum nights based on seasonality – potentially shorter during low season and longer during peak demand periods in Muara.
Muara Airbnb Cancellation Policy Trends Analysis (2026)
Limited
1 listings
1% of total
Flexible
50 listings
48.5% of total
Moderate
16 listings
15.5% of total
Firm
29 listings
28.2% of total
Strict
7 listings
6.8% of total
Cancellation Policy Insights for Muara
- The prevailing Airbnb cancellation policy trend in Muara is Flexible, used by 48.5% of listings.
- There's a relatively balanced mix between guest-friendly (64.0%) and stricter (35.0%) policies, offering choices for different guest needs.
- Strict cancellation policies are quite rare (6.8%), potentially making listings with this policy less competitive unless justified by high demand or property type.
Recommendations for Hosts
- Consider adopting a Flexible policy to align with the 48.5% market standard in Muara.
- Using a Strict policy might deter some guests, as only 6.8% of listings use it. Evaluate if potential revenue protection outweighs possible lower booking rates.
- Regularly review your cancellation policy against competitors and market demand shifts in Muara.
Muara STR Booking Lead Time Analysis (2026)
Average Booking Lead Time by Month
Booking Lead Time Insights for Muara
- The overall average booking lead time for vacation rentals in Muara is 10 days.
- Guests book furthest in advance for stays during December (average 21 days), likely coinciding with peak travel demand or local events.
- The shortest booking windows occur for stays in May (average 5 days), indicating more last-minute travel plans during this time.
- Seasonally, Winter (14 days avg.) sees the longest lead times, while Summer (8 days avg.) has the shortest, reflecting typical travel planning cycles.
Recommendations for Hosts
- Use the overall average lead time (10 days) as a baseline for your pricing and availability strategy in Muara.
- For December stays, consider implementing length-of-stay discounts or slightly higher rates for bookings made less than 21 days out to capitalize on advance planning.
- Target marketing efforts for the Winter season well in advance (at least 14 days) to capture early planners.
- Monitor your own booking lead times against these Muara averages to identify opportunities for dynamic pricing adjustments.
Popular & Essential Airbnb Amenities in Muara (2026)
Amenity Prevalence
Amenity Insights for Muara
- Essential amenities in Muara that guests expect include: Air conditioning, TV. Lacking these (any) could significantly impact bookings.
- Popular amenities like Wifi, Kitchen, Smoke alarm are common but not universal. Offering these can provide a competitive edge.
- Warning: Wifi is not universally provided but is considered essential globally. Ensure reliable Wifi is offered.
Recommendations for Hosts
- Ensure your listing includes all essential amenities for Muara: Air conditioning, TV.
- Prioritize adding missing essentials: TV.
- Consider adding popular differentiators like Wifi or Kitchen to increase appeal.
- Highlight unique or less common amenities you offer (e.g., hot tub, dedicated workspace, EV charger) in your listing description and photos.
- Regularly check competitor amenities in Muara to stay competitive.
Muara Airbnb Guest Demographics & Profile Analysis (2026)
Guest Profile Summary for Muara
- The typical guest profile for Airbnb in Muara consists of primarily domestic travelers (70%), often arriving from nearby Jakarta, typically belonging to the Post-2000s (Gen Z/Alpha) group (50%), primarily speaking Indonesian or English.
- Domestic travelers account for 69.5% of guests.
- Key international markets include Indonesia (69.5%) and Singapore (5.7%).
- Top languages spoken are Indonesian (42.2%) followed by English (40.5%).
- A significant demographic segment is the Post-2000s (Gen Z/Alpha) group, representing 50% of guests.
Recommendations for Hosts
- Target domestic marketing efforts towards travelers from Jakarta and Banten.
- Tailor amenities and listing descriptions to appeal to the dominant Post-2000s (Gen Z/Alpha) demographic (e.g., highlight fast WiFi, smart home features, local guides).
- Highlight unique local experiences or amenities relevant to the primary guest profile.
- Consider seasonal promotions aligned with peak travel times for key origin markets.
Nearby Short-Term Rental Market Comparison
How does the Muara Airbnb market stack up against its neighbors? Compare key performance metrics like average monthly revenue, ADR, and occupancy rates in surrounding areas to understand the broader regional STR landscape.
| Market | Active Properties | Monthly Revenue | Daily Rate | Avg. Occupancy |
|---|---|---|---|---|
| Kuta | 10 | $2,046 | $149.05 | 45% |
| Sukagalih | 13 | $1,306 | $157.45 | 34% |
| Citaringgul | 21 | $1,285 | $142.78 | 30% |
| Sukamanah | 12 | $1,151 | $148.28 | 28% |
| Ciburial | 191 | $1,114 | $288.50 | 18% |
| Leuwimalang | 15 | $1,109 | $203.41 | 20% |
| Wangunsari | 17 | $1,094 | $158.69 | 23% |
| Cigugur Girang | 21 | $1,057 | $163.07 | 19% |
| Sumur Batu | 50 | $1,026 | $180.80 | 21% |
| Kecamatan Parongpong | 14 | $1,014 | $182.15 | 23% |