Semarang Airbnb Market Analysis 2026: Short Term Rental Data & Vacation Rental Statistics in Central Java, Indonesia
Is Airbnb profitable in Semarang in 2026? Explore comprehensive Airbnb analytics for Semarang, Central Java, Indonesia to uncover income potential. This 2026 STR market report for Semarang, based on AirROI data from February 2025 to January 2026, reveals key trends in the niche market of 140 active listings.
Whether you're considering an Airbnb investment in Semarang, optimizing your existing vacation rental, or exploring rental arbitrage opportunities, understanding the Semarang Airbnb data is crucial. Leveraging the low regulation environment is key to maximizing your short term rental income potential. Let's dive into the specifics.
Key Semarang Airbnb Performance Metrics Overview
Monthly Airbnb Revenue Variations & Income Potential in Semarang (2026)
Understanding the monthly revenue variations for Airbnb listings in Semarang is key to maximizing your short term rental income potential. Seasonality significantly impacts earnings. Our analysis, based on data from the past 12 months, shows that the peak revenue month for STRs in Semarang is typically July, while January often presents the lowest earnings, highlighting opportunities for strategic pricing adjustments during shoulder and low seasons. Explore the typical Airbnb income in Semarang across different performance tiers:
- Best-in-class properties (Top 10%) achieve $913+ monthly, often utilizing dynamic pricing and superior guest experiences.
- Strong performing properties (Top 25%) earn $458 or more, indicating effective management and desirable locations/amenities.
- Typical properties (Median) generate around $201 per month, representing the average market performance.
- Entry-level properties (Bottom 25%) see earnings around $86, often with potential for optimization.
Average Monthly Airbnb Earnings Trend in Semarang
Semarang Airbnb Occupancy Rate Trends (2026)
Maximize your bookings by understanding the Semarang STR occupancy trends. Seasonal demand shifts significantly influence how often properties are booked. Typically, Octobersees the highest demand (peak season occupancy), while January experiences the lowest (low season). Effective strategies, like adjusting minimum stays or offering promotions, can boost occupancy during slower periods. Here's how different property tiers perform in Semarang:
- Best-in-class properties (Top 10%) achieve 55%+ occupancy, indicating high desirability and potentially optimized availability.
- Strong performing properties (Top 25%) maintain 33% or higher occupancy, suggesting good market fit and guest satisfaction.
- Typical properties (Median) have an occupancy rate around 17%.
- Entry-level properties (Bottom 25%) average 8% occupancy, potentially facing higher vacancy.
Average Monthly Occupancy Rate Trend in Semarang
Average Daily Rate (ADR) Airbnb Trends in Semarang (2026)
Effective short term rental pricing strategy in Semarang involves understanding monthly ADR fluctuations. The Average Daily Rate (ADR) for Airbnb in Semarang typically peaks in December and dips lowest during February. Leveraging Airbnb dynamic pricing tools or strategies based on this seasonality can significantly boost revenue. Here's a look at the typical nightly rates achieved:
- Best-in-class properties (Top 10%) command rates of $80+ per night, often due to premium features or locations.
- Strong performing properties (Top 25%) achieve nightly rates of $55 or more.
- Typical properties (Median) charge around $34 per night.
- Entry-level properties (Bottom 25%) earn around $20 per night.
Average Daily Rate (ADR) Trend by Month in Semarang
Get Live Semarang Market Intelligence 👇

Explore Real-time Analytics
Airbnb Seasonality Analysis & Trends in Semarang (2026)
Peak Season (July, April, May)
- Revenue averages $395 per month
- Occupancy rates average 24.0%
- Daily rates average $45
Shoulder Season
- Revenue averages $363 per month
- Occupancy maintains around 24.0%
- Daily rates hold near $44
Low Season (January, March, December)
- Revenue drops to average $326 per month
- Occupancy decreases to average 22.5%
- Daily rates adjust to average $44
Seasonality Insights for Semarang
- The Airbnb seasonality in Semarang shows moderate seasonality with distinct peak and low periods. While the sections above show seasonal averages, it's also insightful to look at the extremes:
- During the high season, the absolute peak month showcases Semarang's highest earning potential, with monthly revenues capable of climbing to $417, occupancy reaching a high of 28.9%, and ADRs peaking at $45.
- Conversely, the slowest single month of the year, typically falling within the low season, marks the market's lowest point. In this month, revenue might dip to $304, occupancy could drop to 21.1%, and ADRs may adjust down to $43.
- Understanding both the seasonal averages and these monthly peaks and troughs in revenue, occupancy, and ADR is crucial for maximizing your Airbnb profit potential in Semarang.
Seasonal Strategies for Maximizing Profit
- Peak Season: Maximize revenue through premium pricing and potentially longer minimum stays. Ensure high availability.
- Low Season: Offer competitive pricing, special promotions (e.g., extended stay discounts), and flexible cancellation policies. Target off-season travelers like remote workers or budget-conscious guests.
- Shoulder Seasons: Implement dynamic pricing that balances peak and low rates. Target weekend travelers or specific events. Offer slightly more flexible terms than peak season.
- Regularly analyze your own performance against these Semarang seasonality benchmarks and adjust your pricing and availability strategy accordingly.
Best Areas for Airbnb Investment in Semarang (2026)
Exploring the top neighborhoods for short-term rentals in Semarang? This section highlights key areas, outlining why they are attractive for hosts and guests, along with notable local attractions. Consider these locations based on your target guest profile and investment strategy.
| Neighborhood / Area | Why Host Here? (Target Guests & Appeal) | Key Attractions & Landmarks |
|---|---|---|
| Semarang Old Town | Historical center of Semarang featuring colonial architecture, vibrant culture, and local cuisine. It attracts tourists interested in history and local traditions, with many cafes and shops around. | Lawang Sewu, Blok Tugo, Semarang Contemporary Art Gallery, Sam Poo Kong Temple, Old Town Cafe |
| Tawang | A central business district with access to government offices, shopping centers, and transport hubs. Ideal for business travelers and accessible to various attractions. | Puri Maerokoco, Transmart Semarang, Tawang Station, Central Java Grand Mosque, Semarang Zoo |
| Simpang Lima | Known for its iconic city square, restaurants, and shopping, Simpang Lima is a bustling area that attracts both locals and tourists. It's a hub for events and nightlife activities. | Simpang Lima Square, Semarang Great Mosque, Paragon City Mall, Pavilion Resto, Kampung Pelangi |
| Ngaliyan | Emerging residential area with lower property costs and proximity to educational institutions, making it appealing for student accommodations and long-term rentals. | Diponegoro University, Universitas Negri Semarang, Taman Tabanas, Taman Beringin, Taman Mini Indonesia Indah |
| Gunungpati | Located near natural attractions and hill areas, this suburb is sought after for its scenic views and tranquility, ideal for vacation rentals. | Budha Perwara Temple, Gunungpati Hill, Taman Bunga Celosia, Taman Sari Temple, Vanilla Sky |
| Candi | Known for its cultural heritage sites and archaeological significance, Candi attracts tourists interested in history and spirituality, offering opportunities for unique stays. | Candi Borobudur, Candi Prambanan, Candi Mendut, Candi Pawon, Kraton Ratu Boko |
| Gajahmungkur | A peaceful suburbs area, ideal for those seeking a quiet retreat while still being close to city amenities. Suitable for long-term stays and family rentals. | Gajahmungkur Park, Mal Semarang, Taman Indonesia Kaya, Sukorejo, Derek Cangkringan |
| Pedurungan | A rapidly developing neighborhood with affordable housing options and proximity to shopping, making it attractive for long-term investments and family-oriented stays. | Transmart Setiabudi, Matahari Department Store, Gereja Tua Ganjuran, Taman Hutan Kota, Jl. K.H. Wahid Hasyim |
Understanding Airbnb License Requirements & STR Laws in Semarang (2026)
While Semarang, Central Java, Indonesia currently shows low STR regulations, specific Airbnb license requirements might still exist or change. Always verify the latest short term rental regulations and Airbnb license requirements directly with local government authorities for Semarang to ensure full compliance before hosting.
(Source: AirROI data, 2026, based on 1% licensed listings)
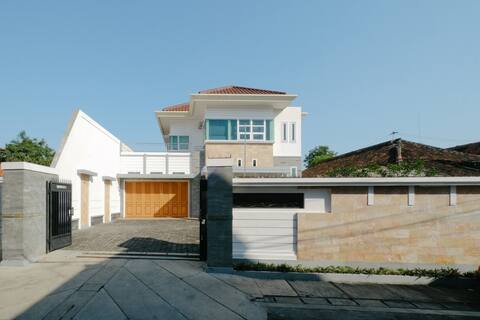
Top Performing Airbnb Properties in Semarang (2026)
Benchmark your potential! Explore examples of top-performing Airbnb properties in Semarangbased on Trailing Twelve Month (TTM) revenue. Analyze their characteristics, revenue, occupancy rate, and ADR to understand what drives success in this market.
Barusari House 5BR - Netflix, Karaoke, City Center
Entire Place • 5 bedrooms
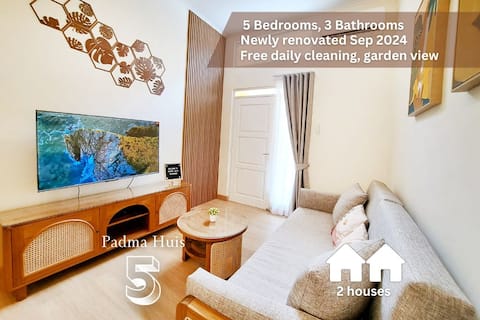
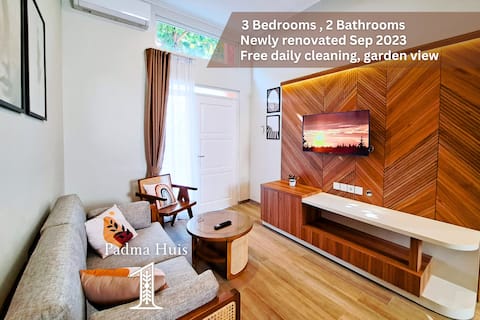
@PadmaHuis 5BR 3 Baths Graha Padma
Entire Place • 5 bedrooms
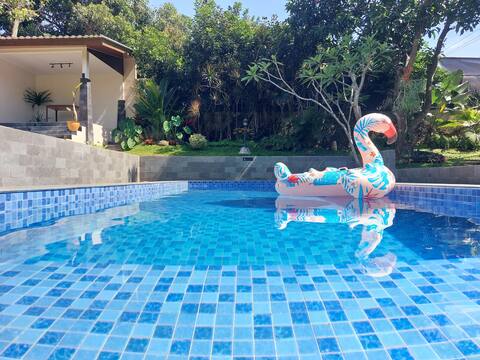
Sarèh villa. Family Villa with pool and garden
Entire Place • 6 bedrooms
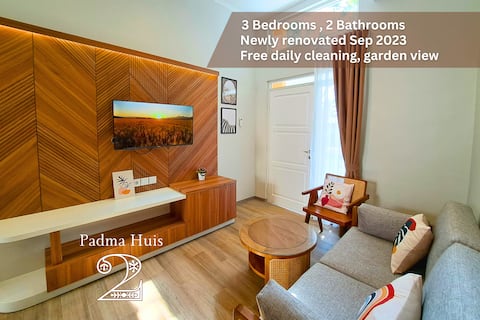
@PadmaHuis 2 | 3BR 2Baths Graha Padma
Entire Place • 3 bedrooms

Breeze Block House Semarang 2BR
Entire Place • 2 bedrooms
@PadmaHuis 1 | 3BR 2 Baths Graha Padma
Entire Place • 3 bedrooms
Note: Performance varies based on location, size, amenities, seasonality, and management quality. Data reflects the past 12 months.
Top Performing Airbnb Hosts in Semarang (2026)
Learn from the best! This table showcases top-performing Airbnb hosts in Semarang based on the number of properties managed and estimated total revenue over the past year. Analyze their scale and performance metrics.
| Host Name | Properties | Grossing Revenue | Stay Reviews | Avg Rating |
|---|---|---|---|---|
| Selvy | 5 | $63,670 | 264 | 4.96/5.0 |
| Aries | 1 | $21,626 | 62 | 4.98/5.0 |
| Mutia | 2 | $17,550 | 2 | Not Rated |
| Sofia | 9 | $15,921 | 456 | 4.77/5.0 |
| Bambang | 2 | $15,360 | 125 | 4.96/5.0 |
| Cynthia | 1 | $11,883 | 17 | 5.00/5.0 |
| Alfrizki | 1 | $11,249 | 79 | 4.95/5.0 |
| Lesnar | 5 | $10,562 | 13 | 4.44/5.0 |
| Bukit Jaya | 3 | $10,421 | 136 | 4.73/5.0 |
| Yulia | 3 | $10,416 | 616 | 4.86/5.0 |
Analyzing the strategies of top hosts, such as their property selection, pricing, and guest communication, can offer valuable lessons for optimizing your own Airbnb operations in Semarang.
Dive Deeper: Advanced Semarang STR Market Data (2026)
Ready to unlock more insights? AirROI provides access to advanced metrics and comprehensive Airbnb data for Semarang. Explore detailed analytics beyond this report to refine your investment strategy, optimize pricing, and maximize your vacation rental profits.
Explore Advanced MetricsSemarang Short-Term Rental Market Composition (2026): Property & Room Types
Room Type Distribution
Property Type Distribution
Market Composition Insights for Semarang
- The Semarang Airbnb market composition is heavily skewed towards Entire Home/Apt listings, which make up 75.7% of the 140 active rentals. This indicates strong guest preference for privacy and space.
- Looking at the property type distribution in Semarang, Apartment/Condo properties are the most common (46.4%), reflecting the local real estate landscape.
- Houses represent a significant 42.1% portion, catering likely to families or larger groups.
- The presence of 10.7% Hotel/Boutique listings indicates integration with traditional hospitality.
- Smaller segments like others (combined 0.7%) offer potential for unique stay experiences.
Semarang Airbnb Room Capacity Analysis (2026): Bedroom Distribution
Distribution of Listings by Number of Bedrooms
Room Capacity Insights for Semarang
- The dominant room capacity in Semarang is 1 bedroom listings, making up 28.6% of the market. This suggests a strong demand for properties suitable for couples or solo travelers.
- Together, 1 bedroom and 2 bedrooms properties represent 55.0% of the active Airbnb listings in Semarang, indicating a high concentration in these sizes.
- A significant 30.0% of listings offer 3+ bedrooms, catering to larger groups and families seeking more space in Semarang.
Semarang Vacation Rental Guest Capacity Trends (2026)
Distribution of Listings by Guest Capacity
Guest Capacity Insights for Semarang
- The most common guest capacity trend in Semarang vacation rentals is listings accommodating 2 guests (20%). This suggests the primary traveler segment is likely couples or solo travelers.
- Properties designed for 2 guests and 8+ guests dominate the Semarang STR market, accounting for 37.1% of listings.
- 33.5% of properties accommodate 6+ guests, serving the market segment for larger families or group travel in Semarang.
- On average, properties in Semarang are equipped to host 4.2 guests.
Semarang Airbnb Booking Patterns (2026): Available vs. Booked Days
Available Days Distribution
Booked Days Distribution
Booking Pattern Insights for Semarang
- The most common availability pattern in Semarang falls within the 271-366 days range, representing 80.7% of listings. This suggests many properties have significant open periods on their calendars.
- Approximately 95.7% of listings show high availability (181+ days open annually), indicating potential for increased bookings or specific owner usage patterns.
- For booked days, the 1-30 days range is most frequent in Semarang (45%), reflecting common guest stay durations or potential owner blocking patterns.
- A notable 4.3% of properties secure long booking periods (181+ days booked per year), highlighting successful long-term rental strategies or significant owner usage.
Semarang Airbnb Minimum Stay Requirements Analysis
Distribution of Listings by Minimum Night Requirement
1 Night
106 listings
75.7% of total
2 Nights
14 listings
10% of total
3 Nights
1 listings
0.7% of total
4-6 Nights
1 listings
0.7% of total
7-29 Nights
3 listings
2.1% of total
30+ Nights
15 listings
10.7% of total
Key Insights
- The most prevalent minimum stay requirement in Semarang is 1 Night, adopted by 75.7% of listings. This highlights the market's preference for shorter, flexible bookings.
- A strong majority (85.7%) of the Semarang Airbnb data shows acceptance of very short stays (1-2 nights), indicating a dynamic, high-turnover market.
- A significant segment (10.7%) caters to monthly stays (30+ nights) in Semarang, pointing to opportunities in the extended-stay market.
Recommendations
- Align with the market by considering a 1 Night minimum stay, as 75.7% of Semarang hosts use this setting.
- Explore offering discounts for stays of 30+ nights to attract the 10.7% of the market seeking extended stays.
- Adjust minimum nights based on seasonality – potentially shorter during low season and longer during peak demand periods in Semarang.
Semarang Airbnb Cancellation Policy Trends Analysis (2026)
Super Strict 30 Days
3 listings
2.1% of total
Flexible
53 listings
37.9% of total
Moderate
32 listings
22.9% of total
Firm
36 listings
25.7% of total
Strict
16 listings
11.4% of total
Cancellation Policy Insights for Semarang
- The prevailing Airbnb cancellation policy trend in Semarang is Flexible, used by 37.9% of listings.
- There's a relatively balanced mix between guest-friendly (60.8%) and stricter (37.1%) policies, offering choices for different guest needs.
Recommendations for Hosts
- Consider adopting a Flexible policy to align with the 37.9% market standard in Semarang.
- Using a Strict policy might deter some guests, as only 11.4% of listings use it. Evaluate if potential revenue protection outweighs possible lower booking rates.
- Regularly review your cancellation policy against competitors and market demand shifts in Semarang.
Semarang STR Booking Lead Time Analysis (2026)
Average Booking Lead Time by Month
Booking Lead Time Insights for Semarang
- The overall average booking lead time for vacation rentals in Semarang is 22 days.
- Guests book furthest in advance for stays during December (average 27 days), likely coinciding with peak travel demand or local events.
- The shortest booking windows occur for stays in February (average 12 days), indicating more last-minute travel plans during this time.
- Seasonally, Summer (20 days avg.) sees the longest lead times, while Fall (17 days avg.) has the shortest, reflecting typical travel planning cycles.
Recommendations for Hosts
- Use the overall average lead time (22 days) as a baseline for your pricing and availability strategy in Semarang.
- During February, focus on last-minute booking availability and promotions, as guests book with very short notice (12 days avg.).
- Target marketing efforts for the Summer season well in advance (at least 20 days) to capture early planners.
- Monitor your own booking lead times against these Semarang averages to identify opportunities for dynamic pricing adjustments.
Popular & Essential Airbnb Amenities in Semarang (2026)
Amenity Prevalence
Amenity Insights for Semarang
- Essential amenities in Semarang that guests expect include: Air conditioning, TV. Lacking these (any) could significantly impact bookings.
- Popular amenities like Kitchen, Wifi, Essentials are common but not universal. Offering these can provide a competitive edge.
- Warning: Wifi is not universally provided but is considered essential globally. Ensure reliable Wifi is offered.
Recommendations for Hosts
- Ensure your listing includes all essential amenities for Semarang: Air conditioning, TV.
- Prioritize adding missing essentials: Air conditioning, TV.
- Consider adding popular differentiators like Kitchen or Wifi to increase appeal.
- Highlight unique or less common amenities you offer (e.g., hot tub, dedicated workspace, EV charger) in your listing description and photos.
- Regularly check competitor amenities in Semarang to stay competitive.
Semarang Airbnb Guest Demographics & Profile Analysis (2026)
Guest Profile Summary for Semarang
- The typical guest profile for Airbnb in Semarang consists of primarily domestic travelers (69%), often arriving from nearby Jakarta, typically belonging to the Post-2000s (Gen Z/Alpha) group (50%), primarily speaking English or Indonesian.
- Domestic travelers account for 68.7% of guests.
- Key international markets include Indonesia (68.7%) and Netherlands (4.2%).
- Top languages spoken are English (41.8%) followed by Indonesian (37.1%).
- A significant demographic segment is the Post-2000s (Gen Z/Alpha) group, representing 50% of guests.
Recommendations for Hosts
- Target domestic marketing efforts towards travelers from Jakarta and Special Capital Region of Jakarta.
- Tailor amenities and listing descriptions to appeal to the dominant Post-2000s (Gen Z/Alpha) demographic (e.g., highlight fast WiFi, smart home features, local guides).
- Highlight unique local experiences or amenities relevant to the primary guest profile.
- Consider seasonal promotions aligned with peak travel times for key origin markets.
Nearby Short-Term Rental Market Comparison
How does the Semarang Airbnb market stack up against its neighbors? Compare key performance metrics like average monthly revenue, ADR, and occupancy rates in surrounding areas to understand the broader regional STR landscape.
| Market | Active Properties | Monthly Revenue | Daily Rate | Avg. Occupancy |
|---|---|---|---|---|
| Candibinangun | 10 | $713 | $112.01 | 18% |
| Bangunjiwo | 25 | $647 | $82.14 | 27% |
| Sardonoharjo | 11 | $490 | $120.34 | 17% |
| Sukoharjo | 16 | $469 | $90.40 | 24% |
| Maguwoharjo | 35 | $430 | $75.21 | 23% |
| Bangunharjo | 10 | $388 | $84.13 | 22% |
| Pandowoharjo | 15 | $364 | $106.80 | 16% |
| Sariharjo | 160 | $347 | $56.11 | 28% |
| Bantul Regency | 153 | $336 | $54.68 | 24% |
| Sinduharjo | 25 | $319 | $60.83 | 27% |