Jepara Airbnb Market Analysis 2026: Short Term Rental Data & Vacation Rental Statistics in Central Java, Indonesia
Is Airbnb profitable in Jepara in 2026? Explore comprehensive Airbnb analytics for Jepara, Central Java, Indonesia to uncover income potential. This 2026 STR market report for Jepara, based on AirROI data from February 2025 to January 2026, reveals key trends in the niche market of 54 active listings.
Whether you're considering an Airbnb investment in Jepara, optimizing your existing vacation rental, or exploring rental arbitrage opportunities, understanding the Jepara Airbnb data is crucial. Leveraging the low regulation environment is key to maximizing your short term rental income potential. Let's dive into the specifics.
Key Jepara Airbnb Performance Metrics Overview
Monthly Airbnb Revenue Variations & Income Potential in Jepara (2026)
Understanding the monthly revenue variations for Airbnb listings in Jepara is key to maximizing your short term rental income potential. Seasonality significantly impacts earnings. Our analysis, based on data from the past 12 months, shows that the peak revenue month for STRs in Jepara is typically August, while January often presents the lowest earnings, highlighting opportunities for strategic pricing adjustments during shoulder and low seasons. Explore the typical Airbnb income in Jepara across different performance tiers:
- Best-in-class properties (Top 10%) achieve $1,220+ monthly, often utilizing dynamic pricing and superior guest experiences.
- Strong performing properties (Top 25%) earn $721 or more, indicating effective management and desirable locations/amenities.
- Typical properties (Median) generate around $252 per month, representing the average market performance.
- Entry-level properties (Bottom 25%) see earnings around $101, often with potential for optimization.
Average Monthly Airbnb Earnings Trend in Jepara
Jepara Airbnb Occupancy Rate Trends (2026)
Maximize your bookings by understanding the Jepara STR occupancy trends. Seasonal demand shifts significantly influence how often properties are booked. Typically, Augustsees the highest demand (peak season occupancy), while January experiences the lowest (low season). Effective strategies, like adjusting minimum stays or offering promotions, can boost occupancy during slower periods. Here's how different property tiers perform in Jepara:
- Best-in-class properties (Top 10%) achieve 55%+ occupancy, indicating high desirability and potentially optimized availability.
- Strong performing properties (Top 25%) maintain 35% or higher occupancy, suggesting good market fit and guest satisfaction.
- Typical properties (Median) have an occupancy rate around 18%.
- Entry-level properties (Bottom 25%) average 10% occupancy, potentially facing higher vacancy.
Average Monthly Occupancy Rate Trend in Jepara
Average Daily Rate (ADR) Airbnb Trends in Jepara (2026)
Effective short term rental pricing strategy in Jepara involves understanding monthly ADR fluctuations. The Average Daily Rate (ADR) for Airbnb in Jepara typically peaks in August and dips lowest during January. Leveraging Airbnb dynamic pricing tools or strategies based on this seasonality can significantly boost revenue. Here's a look at the typical nightly rates achieved:
- Best-in-class properties (Top 10%) command rates of $98+ per night, often due to premium features or locations.
- Strong performing properties (Top 25%) achieve nightly rates of $62 or more.
- Typical properties (Median) charge around $38 per night.
- Entry-level properties (Bottom 25%) earn around $24 per night.
Average Daily Rate (ADR) Trend by Month in Jepara
Get Live Jepara Market Intelligence 👇
Explore Real-time Analytics
Airbnb Seasonality Analysis & Trends in Jepara (2026)
Peak Season (August, July, November)
- Revenue averages $805 per month
- Occupancy rates average 34.0%
- Daily rates average $50
Shoulder Season
- Revenue averages $473 per month
- Occupancy maintains around 24.3%
- Daily rates hold near $50
Low Season (January, February, March)
- Revenue drops to average $275 per month
- Occupancy decreases to average 15.2%
- Daily rates adjust to average $48
Seasonality Insights for Jepara
- The Airbnb seasonality in Jepara shows highly seasonal trends requiring careful strategy. While the sections above show seasonal averages, it's also insightful to look at the extremes:
- During the high season, the absolute peak month showcases Jepara's highest earning potential, with monthly revenues capable of climbing to $960, occupancy reaching a high of 42.4%, and ADRs peaking at $52.
- Conversely, the slowest single month of the year, typically falling within the low season, marks the market's lowest point. In this month, revenue might dip to $227, occupancy could drop to 10.2%, and ADRs may adjust down to $47.
- Understanding both the seasonal averages and these monthly peaks and troughs in revenue, occupancy, and ADR is crucial for maximizing your Airbnb profit potential in Jepara.
Seasonal Strategies for Maximizing Profit
- Peak Season: Maximize revenue through premium pricing and potentially longer minimum stays. Ensure high availability.
- Low Season: Offer competitive pricing, special promotions (e.g., extended stay discounts), and flexible cancellation policies. Target off-season travelers like remote workers or budget-conscious guests.
- Shoulder Seasons: Implement dynamic pricing that balances peak and low rates. Target weekend travelers or specific events. Offer slightly more flexible terms than peak season.
- Regularly analyze your own performance against these Jepara seasonality benchmarks and adjust your pricing and availability strategy accordingly.
Best Areas for Airbnb Investment in Jepara (2026)
Exploring the top neighborhoods for short-term rentals in Jepara? This section highlights key areas, outlining why they are attractive for hosts and guests, along with notable local attractions. Consider these locations based on your target guest profile and investment strategy.
| Neighborhood / Area | Why Host Here? (Target Guests & Appeal) | Key Attractions & Landmarks |
|---|---|---|
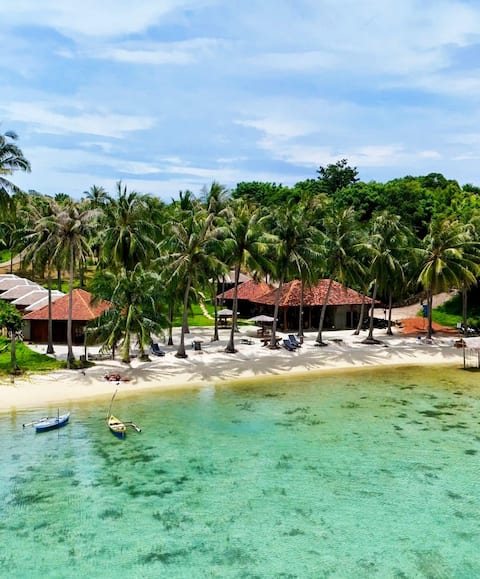
| Karimunjawa Islands | A stunning group of islands known for their pristine beaches and clear waters, perfect for beach lovers and diving enthusiasts. They attract both local and international tourists looking for a tropical getaway. | Karimunjawa National Park, Batu TOP Beach, Tanjung Gelam Beach, Pulau Menjangan Kecil, Snorkeling and diving spots |
| Jepara Beach | A beautiful coastal area popular among tourists for its serene beaches and cultural heritage. It offers a mix of relaxation and exploration, making it ideal for family vacations. | Beach resorts and cafes, Cultural performances, Historical sites, Local seafood restaurants |
| Bangka Island | Known for its unspoiled natural beauty and laid-back atmosphere, Bangka Island attracts nature lovers and those looking for a peaceful retreat from bustling city life. | Bangka White Sand Beach, Mangrove Forests, Water sports, Local fishing villages |
| Jepara City Center | The bustling center of Jepara, where visitors can explore local markets, shops, and restaurants. A convenient base for tourists looking to experience local culture and cuisine. | Jepara Monument, Local markets, Traditional restaurants, Souvenir shops |
| Cinda Sea | A rich marine life spot that attracts adventure seekers for activities like fishing and snorkeling. A hidden gem promoting eco-tourism and nature experiences. | Snorkeling, Fishing trips, Island hopping, Nature photography |
| Kampoeng Keling | A cultural village area just outside Jepara city, showcasing local crafts and traditional living. Perfect for tourists wanting to immerse themselves in local culture. | Traditional crafts workshops, Local cuisine, Cultural heritage sites |
| Semedo Beach | An emerging beach destination known for its stunning sunsets and relaxed vibe. Ideal for travelers seeking an off-the-beaten-path beach experience. | Uncrowded beaches, Fishing activities, Beachside cafes |
| Banyu Biru | A picturesque area known for its clear blue waters and natural beauty. It’s perfect for families and couples looking for a tranquil spot to unwind. | Swimming spots, Lush landscapes, Camping areas |
Understanding Airbnb License Requirements & STR Laws in Jepara (2026)
While Jepara, Central Java, Indonesia currently shows low STR regulations, specific Airbnb license requirements might still exist or change. Always verify the latest short term rental regulations and Airbnb license requirements directly with local government authorities for Jepara to ensure full compliance before hosting.
(Source: AirROI data, 2026, finding no licensed listings among those analyzed)
Top Performing Airbnb Properties in Jepara (2026)
Benchmark your potential! Explore examples of top-performing Airbnb properties in Jeparabased on Trailing Twelve Month (TTM) revenue. Analyze their characteristics, revenue, occupancy rate, and ADR to understand what drives success in this market.
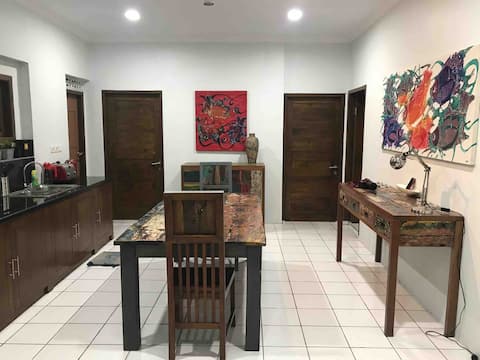
Omah Alchy Karimun Java-Cemara Cottage
Entire Place • 3 bedrooms
Villa Mirabelle Sunrise
Entire Place • 4 bedrooms
Floating Paradise - Bayside Family
Private Room • 2 bedrooms
Sea View Double Bed Bungalow at Eco Casa
Private Room • 1 bedroom

Floating Paradise - Sunset Bungalow
Private Room • 1 bedroom
Kathy's Place Villa, Karimunjawa
Entire Place • 5 bedrooms
Note: Performance varies based on location, size, amenities, seasonality, and management quality. Data reflects the past 12 months.
Top Performing Airbnb Hosts in Jepara (2026)
Learn from the best! This table showcases top-performing Airbnb hosts in Jepara based on the number of properties managed and estimated total revenue over the past year. Analyze their scale and performance metrics.
| Host Name | Properties | Grossing Revenue | Stay Reviews | Avg Rating |
|---|---|---|---|---|
| Sungatono | 3 | $38,010 | 57 | 5.00/5.0 |
| Nino | 5 | $32,088 | 37 | 4.96/5.0 |
| Stefano | 2 | $22,669 | 22 | 5.00/5.0 |
| Laurent | 3 | $18,952 | 43 | 4.98/5.0 |
| Khety | 6 | $15,319 | 64 | 4.75/5.0 |
| Margo | 5 | $11,585 | 15 | 4.86/5.0 |
| Basabasi Karimunjawa | 2 | $8,586 | 58 | 4.91/5.0 |
| The Happinezz Hills | 3 | $7,346 | 12 | 4.60/5.0 |
| Masturi | 1 | $5,521 | 1 | Not Rated |
| Sary | 2 | $3,967 | 46 | 4.66/5.0 |
Analyzing the strategies of top hosts, such as their property selection, pricing, and guest communication, can offer valuable lessons for optimizing your own Airbnb operations in Jepara.
Dive Deeper: Advanced Jepara STR Market Data (2026)
Ready to unlock more insights? AirROI provides access to advanced metrics and comprehensive Airbnb data for Jepara. Explore detailed analytics beyond this report to refine your investment strategy, optimize pricing, and maximize your vacation rental profits.
Explore Advanced MetricsJepara Short-Term Rental Market Composition (2026): Property & Room Types
Room Type Distribution
Property Type Distribution
Market Composition Insights for Jepara
- The Jepara Airbnb market composition is heavily skewed towards Private Room listings, which make up 57.4% of the 54 active rentals. This indicates strong guest preference for privacy and space.
- Looking at the property type distribution in Jepara, House properties are the most common (50%), reflecting the local real estate landscape.
- Houses represent a significant 50% portion, catering likely to families or larger groups.
- The presence of 18.5% Hotel/Boutique listings indicates integration with traditional hospitality.
- Smaller segments like others (combined 3.7%) offer potential for unique stay experiences.
Jepara Airbnb Room Capacity Analysis (2026): Bedroom Distribution
Distribution of Listings by Number of Bedrooms
Room Capacity Insights for Jepara
- The dominant room capacity in Jepara is 1 bedroom listings, making up 61.1% of the market. This suggests a strong demand for properties suitable for couples or solo travelers.
- Together, 1 bedroom and 2 bedrooms properties represent 70.4% of the active Airbnb listings in Jepara, indicating a high concentration in these sizes.
- With over half the market (61.1%) consisting of studios or 1-bedroom units, Jepara is particularly well-suited for individuals or couples.
- Listings with 3+ bedrooms (7.5%) represent a smaller niche, potentially indicating an underserved market for larger group accommodations in Jepara.
Jepara Vacation Rental Guest Capacity Trends (2026)
Distribution of Listings by Guest Capacity
Guest Capacity Insights for Jepara
- The most common guest capacity trend in Jepara vacation rentals is listings accommodating 2 guests (42.6%). This suggests the primary traveler segment is likely couples or solo travelers.
- Properties designed for 2 guests and 4 guests dominate the Jepara STR market, accounting for 51.9% of listings.
- A significant 42.6% of listings cater specifically to 1-2 guests, highlighting strong demand from couples and solo travelers in Jepara.
- 14.8% of properties accommodate 6+ guests, serving the market segment for larger families or group travel in Jepara.
- On average, properties in Jepara are equipped to host 2.7 guests.
Jepara Airbnb Booking Patterns (2026): Available vs. Booked Days
Available Days Distribution
Booked Days Distribution
Booking Pattern Insights for Jepara
- The most common availability pattern in Jepara falls within the 271-366 days range, representing 83.3% of listings. This suggests many properties have significant open periods on their calendars.
- Approximately 96.3% of listings show high availability (181+ days open annually), indicating potential for increased bookings or specific owner usage patterns.
- For booked days, the 1-30 days range is most frequent in Jepara (51.9%), reflecting common guest stay durations or potential owner blocking patterns.
- A notable 5.6% of properties secure long booking periods (181+ days booked per year), highlighting successful long-term rental strategies or significant owner usage.
Jepara Airbnb Minimum Stay Requirements Analysis
Distribution of Listings by Minimum Night Requirement
1 Night
38 listings
70.4% of total
2 Nights
11 listings
20.4% of total
30+ Nights
5 listings
9.3% of total
Key Insights
- The most prevalent minimum stay requirement in Jepara is 1 Night, adopted by 70.4% of listings. This highlights the market's preference for shorter, flexible bookings.
- A strong majority (90.8%) of the Jepara Airbnb data shows acceptance of very short stays (1-2 nights), indicating a dynamic, high-turnover market.
Recommendations
- Align with the market by considering a 1 Night minimum stay, as 70.4% of Jepara hosts use this setting.
- Explore offering discounts for stays of 30+ nights to attract the 9.3% of the market seeking extended stays.
- Adjust minimum nights based on seasonality – potentially shorter during low season and longer during peak demand periods in Jepara.
Jepara Airbnb Cancellation Policy Trends Analysis (2026)
Super Strict 30 Days
4 listings
7.4% of total
Flexible
24 listings
44.4% of total
Moderate
11 listings
20.4% of total
Firm
10 listings
18.5% of total
Strict
5 listings
9.3% of total
Cancellation Policy Insights for Jepara
- The prevailing Airbnb cancellation policy trend in Jepara is Flexible, used by 44.4% of listings.
- There's a relatively balanced mix between guest-friendly (64.8%) and stricter (27.8%) policies, offering choices for different guest needs.
- Strict cancellation policies are quite rare (9.3%), potentially making listings with this policy less competitive unless justified by high demand or property type.
Recommendations for Hosts
- Consider adopting a Flexible policy to align with the 44.4% market standard in Jepara.
- Using a Strict policy might deter some guests, as only 9.3% of listings use it. Evaluate if potential revenue protection outweighs possible lower booking rates.
- Regularly review your cancellation policy against competitors and market demand shifts in Jepara.
Jepara STR Booking Lead Time Analysis (2026)
Average Booking Lead Time by Month
Booking Lead Time Insights for Jepara
- The overall average booking lead time for vacation rentals in Jepara is 41 days.
- Guests book furthest in advance for stays during August (average 74 days), likely coinciding with peak travel demand or local events.
- The shortest booking windows occur for stays in February (average 16 days), indicating more last-minute travel plans during this time.
- Seasonally, Fall (49 days avg.) sees the longest lead times, while Winter (21 days avg.) has the shortest, reflecting typical travel planning cycles.
Recommendations for Hosts
- Use the overall average lead time (41 days) as a baseline for your pricing and availability strategy in Jepara.
- For August stays, consider implementing length-of-stay discounts or slightly higher rates for bookings made less than 74 days out to capitalize on advance planning.
- Target marketing efforts for the Fall season well in advance (at least 49 days) to capture early planners.
- Monitor your own booking lead times against these Jepara averages to identify opportunities for dynamic pricing adjustments.
Popular & Essential Airbnb Amenities in Jepara (2026)
Amenity Prevalence
Amenity Insights for Jepara
- Essential amenities in Jepara that guests expect include: Free parking on premises. Lacking these (this) could significantly impact bookings.
- Popular amenities like Essentials, Wifi, Air conditioning are common but not universal. Offering these can provide a competitive edge.
- Warning: Wifi is not universally provided but is considered essential globally. Ensure reliable Wifi is offered.
Recommendations for Hosts
- Ensure your listing includes all essential amenities for Jepara: Free parking on premises.
- Prioritize adding missing essentials: Free parking on premises.
- Consider adding popular differentiators like Essentials or Wifi to increase appeal.
- Highlight unique or less common amenities you offer (e.g., hot tub, dedicated workspace, EV charger) in your listing description and photos.
- Regularly check competitor amenities in Jepara to stay competitive.
Jepara Airbnb Guest Demographics & Profile Analysis (2026)
Guest Profile Summary for Jepara
- The typical guest profile for Airbnb in Jepara consists of predominantly international visitors (97%), with top international origins including Germany, typically belonging to the Post-2000s (Gen Z/Alpha) group (50%), primarily speaking English or French.
- Domestic travelers account for 2.9% of guests.
- Key international markets include France (28.4%) and Germany (22.5%).
- Top languages spoken are English (36.2%) followed by French (19.6%).
- A significant demographic segment is the Post-2000s (Gen Z/Alpha) group, representing 50% of guests.
Recommendations for Hosts
- Focus marketing internationally, particularly towards travelers from Germany.
- Tailor amenities and listing descriptions to appeal to the dominant Post-2000s (Gen Z/Alpha) demographic (e.g., highlight fast WiFi, smart home features, local guides).
- Highlight unique local experiences or amenities relevant to the primary guest profile.
- Consider seasonal promotions aligned with peak travel times for key origin markets.