Pakulonan Barat Airbnb Market Analysis 2026: Short Term Rental Data & Vacation Rental Statistics in Banten, Indonesia
Is Airbnb profitable in Pakulonan Barat in 2026? Explore comprehensive Airbnb analytics for Pakulonan Barat, Banten, Indonesia to uncover income potential. This 2026 STR market report for Pakulonan Barat, based on AirROI data from February 2025 to January 2026, reveals key trends in the niche market of 110 active listings.
Whether you're considering an Airbnb investment in Pakulonan Barat, optimizing your existing vacation rental, or exploring rental arbitrage opportunities, understanding the Pakulonan Barat Airbnb data is crucial. Leveraging the low regulation environment is key to maximizing your short term rental income potential. Let's dive into the specifics.
Key Pakulonan Barat Airbnb Performance Metrics Overview
Monthly Airbnb Revenue Variations & Income Potential in Pakulonan Barat (2026)
Understanding the monthly revenue variations for Airbnb listings in Pakulonan Barat is key to maximizing your short term rental income potential. Seasonality significantly impacts earnings. Our analysis, based on data from the past 12 months, shows that the peak revenue month for STRs in Pakulonan Barat is typically July, while January often presents the lowest earnings, highlighting opportunities for strategic pricing adjustments during shoulder and low seasons. Explore the typical Airbnb income in Pakulonan Barat across different performance tiers:
- Best-in-class properties (Top 10%) achieve $663+ monthly, often utilizing dynamic pricing and superior guest experiences.
- Strong performing properties (Top 25%) earn $438 or more, indicating effective management and desirable locations/amenities.
- Typical properties (Median) generate around $237 per month, representing the average market performance.
- Entry-level properties (Bottom 25%) see earnings around $110, often with potential for optimization.
Average Monthly Airbnb Earnings Trend in Pakulonan Barat
Pakulonan Barat Airbnb Occupancy Rate Trends (2026)
Maximize your bookings by understanding the Pakulonan Barat STR occupancy trends. Seasonal demand shifts significantly influence how often properties are booked. Typically, Julysees the highest demand (peak season occupancy), while January experiences the lowest (low season). Effective strategies, like adjusting minimum stays or offering promotions, can boost occupancy during slower periods. Here's how different property tiers perform in Pakulonan Barat:
- Best-in-class properties (Top 10%) achieve 68%+ occupancy, indicating high desirability and potentially optimized availability.
- Strong performing properties (Top 25%) maintain 46% or higher occupancy, suggesting good market fit and guest satisfaction.
- Typical properties (Median) have an occupancy rate around 27%.
- Entry-level properties (Bottom 25%) average 13% occupancy, potentially facing higher vacancy.
Average Monthly Occupancy Rate Trend in Pakulonan Barat
Average Daily Rate (ADR) Airbnb Trends in Pakulonan Barat (2026)
Effective short term rental pricing strategy in Pakulonan Barat involves understanding monthly ADR fluctuations. The Average Daily Rate (ADR) for Airbnb in Pakulonan Barat typically peaks in December and dips lowest during April. Leveraging Airbnb dynamic pricing tools or strategies based on this seasonality can significantly boost revenue. Here's a look at the typical nightly rates achieved:
- Best-in-class properties (Top 10%) command rates of $54+ per night, often due to premium features or locations.
- Strong performing properties (Top 25%) achieve nightly rates of $38 or more.
- Typical properties (Median) charge around $28 per night.
- Entry-level properties (Bottom 25%) earn around $22 per night.
Average Daily Rate (ADR) Trend by Month in Pakulonan Barat
Get Live Pakulonan Barat Market Intelligence 👇

Explore Real-time Analytics
Airbnb Seasonality Analysis & Trends in Pakulonan Barat (2026)
Peak Season (July, December, May)
- Revenue averages $363 per month
- Occupancy rates average 35.0%
- Daily rates average $33
Shoulder Season
- Revenue averages $312 per month
- Occupancy maintains around 32.5%
- Daily rates hold near $32
Low Season (January, February, March)
- Revenue drops to average $271 per month
- Occupancy decreases to average 29.7%
- Daily rates adjust to average $32
Seasonality Insights for Pakulonan Barat
- The Airbnb seasonality in Pakulonan Barat shows moderate seasonality with distinct peak and low periods. While the sections above show seasonal averages, it's also insightful to look at the extremes:
- During the high season, the absolute peak month showcases Pakulonan Barat's highest earning potential, with monthly revenues capable of climbing to $385, occupancy reaching a high of 37.8%, and ADRs peaking at $34.
- Conversely, the slowest single month of the year, typically falling within the low season, marks the market's lowest point. In this month, revenue might dip to $253, occupancy could drop to 24.1%, and ADRs may adjust down to $31.
- Understanding both the seasonal averages and these monthly peaks and troughs in revenue, occupancy, and ADR is crucial for maximizing your Airbnb profit potential in Pakulonan Barat.
Seasonal Strategies for Maximizing Profit
- Peak Season: Maximize revenue through premium pricing and potentially longer minimum stays. Ensure high availability.
- Low Season: Offer competitive pricing, special promotions (e.g., extended stay discounts), and flexible cancellation policies. Target off-season travelers like remote workers or budget-conscious guests.
- Shoulder Seasons: Implement dynamic pricing that balances peak and low rates. Target weekend travelers or specific events. Offer slightly more flexible terms than peak season.
- Regularly analyze your own performance against these Pakulonan Barat seasonality benchmarks and adjust your pricing and availability strategy accordingly.
Best Areas for Airbnb Investment in Pakulonan Barat (2026)
Exploring the top neighborhoods for short-term rentals in Pakulonan Barat? This section highlights key areas, outlining why they are attractive for hosts and guests, along with notable local attractions. Consider these locations based on your target guest profile and investment strategy.
| Neighborhood / Area | Why Host Here? (Target Guests & Appeal) | Key Attractions & Landmarks |
|---|---|---|
| Pakulonan Barat Village | A serene suburb close to various local attractions, ideal for families and travelers looking for a quiet retreat while being accessible to urban conveniences. | Ancol Dreamland, Taman Safari Indonesia, Cimory Riverside, Puncak Resort, Kota Wisata Cibubur |
| Cilegon | An industrial city with emerging tourism potential, known for its beaches and cultural sites. Attractive for budget travelers and business visitors. | Anyer Beach, Cina Island, Cilegon Mall, Cirebon Lighthouse, Palm Beach |
| Serang | The capital city of Banten with historical sites, it's great for visitors interested in Indonesian culture and history, providing an authentic experience. | Banten Grand Mosque, Kampung Kaos, Kujang Park, Western Banten Cultural Museum, Ujung Kulon National Park |
| Tangerang | A rapidly developing area with modern amenities, shopping centers, and close proximity to Jakarta, appealing to both business and leisure travelers. | Summarecon Mall Serpong, Lippo Mall Puri, Tangerang Old Town, Museum Benteng Heritage, Soekarno-Hatta International Airport |
| Cimahi | Known for its natural landscapes and cool climate, Cimahi offers a unique experience for guests looking for outdoor activities and relaxation. | Cimahi Waterfall, Kampung Sumber Alam, Kota Kembang Botanical Garden, Kampung Gajah Wonderland, Curug Cimahi |
| Bogor | Famous for its botanical gardens and cooler climate, Bogor is a popular getaway destination for Jakarta residents, ideal for nature lovers and families. | Bogor Botanical Gardens, Bogor Palace, Puncak Pass, Taman Safari Indonesia, Cimory Riverside |
| Karawaci | A vibrant area with shopping centers, entertainment options, and well-developed infrastructure, perfect for urban travelers and shoppers. | Summarecon Mall, Sang Penari Theater, Karawaci Golf Course, Kota Modern, Bintaro Jaya Xchange |
| Sawangan | A tranquil suburban area known for its scenic beauty and proximity to nature parks, suitable for guests looking to escape the hustle and bustle. | Nuansa Verde, Taman Wisata Situ Gintung, Caringin Park, Taman Budaya Sentul, Pancawati Nature Reserve |
Understanding Airbnb License Requirements & STR Laws in Pakulonan Barat (2026)
While Pakulonan Barat, Banten, Indonesia currently shows low STR regulations, specific Airbnb license requirements might still exist or change. Always verify the latest short term rental regulations and Airbnb license requirements directly with local government authorities for Pakulonan Barat to ensure full compliance before hosting.
(Source: AirROI data, 2026, based on 1% licensed listings)
Top Performing Airbnb Properties in Pakulonan Barat (2026)
Benchmark your potential! Explore examples of top-performing Airbnb properties in Pakulonan Baratbased on Trailing Twelve Month (TTM) revenue. Analyze their characteristics, revenue, occupancy rate, and ADR to understand what drives success in this market.

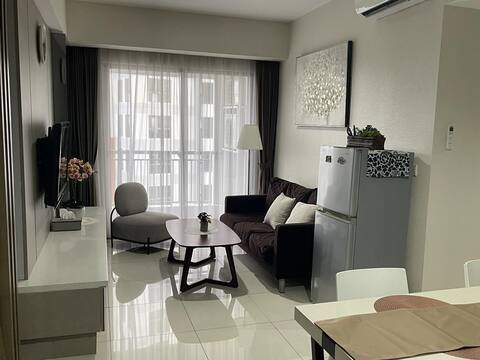
The Reserve - 45m2 Luxury Studio @Jakarta/Serpong
Entire Place • 1 bedroom
Spacious 3 BR Apt @ MTown Signature Gading Serpong
Entire Place • 3 bedrooms

Pool Access 3BR Apt @ M-Town Signature Gdg Serpong
Entire Place • 3 bedrooms

Lovely Bright 3BR Apt M-Town near Mall Serpong
Entire Place • 3 bedrooms

Spacious 2 BR Apt Near SMS Mall – 10 Min Walk
Entire Place • 2 bedrooms

New,homey& spacious 1 BR Apt,M Town Gading Serpong
Entire Place • 1 bedroom
Note: Performance varies based on location, size, amenities, seasonality, and management quality. Data reflects the past 12 months.
Top Performing Airbnb Hosts in Pakulonan Barat (2026)
Learn from the best! This table showcases top-performing Airbnb hosts in Pakulonan Barat based on the number of properties managed and estimated total revenue over the past year. Analyze their scale and performance metrics.
| Host Name | Properties | Grossing Revenue | Stay Reviews | Avg Rating |
|---|---|---|---|---|
| Savy | 11 | $34,350 | 487 | 4.87/5.0 |
| Michel | 6 | $19,465 | 319 | 4.90/5.0 |
| Kenneth | 2 | $18,180 | 103 | 4.94/5.0 |
| Gerald | 6 | $17,554 | 107 | 4.96/5.0 |
| The Reserve | 1 | $14,112 | 73 | 4.95/5.0 |
| Stevei | 3 | $11,358 | 109 | 4.93/5.0 |
| Stevei | 5 | $11,249 | 149 | 4.86/5.0 |
| Kozystay | 3 | $9,103 | 75 | 4.59/5.0 |
| Nathalia | 2 | $8,767 | 70 | 4.89/5.0 |
| Alvin | 1 | $6,890 | 38 | 4.97/5.0 |
Analyzing the strategies of top hosts, such as their property selection, pricing, and guest communication, can offer valuable lessons for optimizing your own Airbnb operations in Pakulonan Barat.
Dive Deeper: Advanced Pakulonan Barat STR Market Data (2026)
Ready to unlock more insights? AirROI provides access to advanced metrics and comprehensive Airbnb data for Pakulonan Barat. Explore detailed analytics beyond this report to refine your investment strategy, optimize pricing, and maximize your vacation rental profits.
Explore Advanced MetricsPakulonan Barat Short-Term Rental Market Composition (2026): Property & Room Types
Room Type Distribution
Property Type Distribution
Market Composition Insights for Pakulonan Barat
- The Pakulonan Barat Airbnb market composition is heavily skewed towards Entire Home/Apt listings, which make up 99.1% of the 110 active rentals. This indicates strong guest preference for privacy and space.
- Looking at the property type distribution in Pakulonan Barat, Apartment/Condo properties are the most common (99.1%), reflecting the local real estate landscape.
- Smaller segments like house (combined 0.9%) offer potential for unique stay experiences.
Pakulonan Barat Airbnb Room Capacity Analysis (2026): Bedroom Distribution
Distribution of Listings by Number of Bedrooms
Room Capacity Insights for Pakulonan Barat
- The dominant room capacity in Pakulonan Barat is 1 bedroom listings, making up 40% of the market. This suggests a strong demand for properties suitable for couples or solo travelers.
- Together, 1 bedroom and 2 bedrooms properties represent 78.2% of the active Airbnb listings in Pakulonan Barat, indicating a high concentration in these sizes.
Pakulonan Barat Vacation Rental Guest Capacity Trends (2026)
Distribution of Listings by Guest Capacity
Guest Capacity Insights for Pakulonan Barat
- The most common guest capacity trend in Pakulonan Barat vacation rentals is listings accommodating 2 guests (38.2%). This suggests the primary traveler segment is likely couples or solo travelers.
- Properties designed for 2 guests and 4 guests dominate the Pakulonan Barat STR market, accounting for 66.4% of listings.
- On average, properties in Pakulonan Barat are equipped to host 3.3 guests.
Pakulonan Barat Airbnb Booking Patterns (2026): Available vs. Booked Days
Available Days Distribution
Booked Days Distribution
Booking Pattern Insights for Pakulonan Barat
- The most common availability pattern in Pakulonan Barat falls within the 271-366 days range, representing 59.1% of listings. This suggests many properties have significant open periods on their calendars.
- Approximately 96.4% of listings show high availability (181+ days open annually), indicating potential for increased bookings or specific owner usage patterns.
- For booked days, the 91-180 days range is most frequent in Pakulonan Barat (37.3%), reflecting common guest stay durations or potential owner blocking patterns.
- A notable 5.4% of properties secure long booking periods (181+ days booked per year), highlighting successful long-term rental strategies or significant owner usage.
Pakulonan Barat Airbnb Minimum Stay Requirements Analysis
Distribution of Listings by Minimum Night Requirement
1 Night
58 listings
52.7% of total
2 Nights
19 listings
17.3% of total
3 Nights
4 listings
3.6% of total
4-6 Nights
6 listings
5.5% of total
7-29 Nights
4 listings
3.6% of total
30+ Nights
19 listings
17.3% of total
Key Insights
- The most prevalent minimum stay requirement in Pakulonan Barat is 1 Night, adopted by 52.7% of listings. This highlights the market's preference for shorter, flexible bookings.
- A strong majority (70.0%) of the Pakulonan Barat Airbnb data shows acceptance of very short stays (1-2 nights), indicating a dynamic, high-turnover market.
- A significant segment (17.3%) caters to monthly stays (30+ nights) in Pakulonan Barat, pointing to opportunities in the extended-stay market.
Recommendations
- Align with the market by considering a 1 Night minimum stay, as 52.7% of Pakulonan Barat hosts use this setting.
- Explore offering discounts for stays of 30+ nights to attract the 17.3% of the market seeking extended stays.
- Adjust minimum nights based on seasonality – potentially shorter during low season and longer during peak demand periods in Pakulonan Barat.
Pakulonan Barat Airbnb Cancellation Policy Trends Analysis (2026)
Limited
3 listings
2.7% of total
Flexible
42 listings
38.2% of total
Moderate
27 listings
24.5% of total
Firm
35 listings
31.8% of total
Strict
3 listings
2.7% of total
Cancellation Policy Insights for Pakulonan Barat
- The prevailing Airbnb cancellation policy trend in Pakulonan Barat is Flexible, used by 38.2% of listings.
- There's a relatively balanced mix between guest-friendly (62.7%) and stricter (34.5%) policies, offering choices for different guest needs.
- Strict cancellation policies are quite rare (2.7%), potentially making listings with this policy less competitive unless justified by high demand or property type.
Recommendations for Hosts
- Consider adopting a Flexible policy to align with the 38.2% market standard in Pakulonan Barat.
- Using a Strict policy might deter some guests, as only 2.7% of listings use it. Evaluate if potential revenue protection outweighs possible lower booking rates.
- Regularly review your cancellation policy against competitors and market demand shifts in Pakulonan Barat.
Pakulonan Barat STR Booking Lead Time Analysis (2026)
Average Booking Lead Time by Month
Booking Lead Time Insights for Pakulonan Barat
- The overall average booking lead time for vacation rentals in Pakulonan Barat is 16 days.
- Guests book furthest in advance for stays during December (average 24 days), likely coinciding with peak travel demand or local events.
- The shortest booking windows occur for stays in October (average 9 days), indicating more last-minute travel plans during this time.
- Seasonally, Winter (18 days avg.) sees the longest lead times, while Fall (10 days avg.) has the shortest, reflecting typical travel planning cycles.
Recommendations for Hosts
- Use the overall average lead time (16 days) as a baseline for your pricing and availability strategy in Pakulonan Barat.
- Target marketing efforts for the Winter season well in advance (at least 18 days) to capture early planners.
- Monitor your own booking lead times against these Pakulonan Barat averages to identify opportunities for dynamic pricing adjustments.
Popular & Essential Airbnb Amenities in Pakulonan Barat (2026)
Amenity Prevalence
Amenity Insights for Pakulonan Barat
- Essential amenities in Pakulonan Barat that guests expect include: Air conditioning, Pool. Lacking these (any) could significantly impact bookings.
- Popular amenities like Smoke alarm, Kitchen, Wifi are common but not universal. Offering these can provide a competitive edge.
- Warning: Wifi is not universally provided but is considered essential globally. Ensure reliable Wifi is offered.
Recommendations for Hosts
- Ensure your listing includes all essential amenities for Pakulonan Barat: Air conditioning, Pool.
- Prioritize adding missing essentials: Pool.
- Consider adding popular differentiators like Smoke alarm or Kitchen to increase appeal.
- Highlight unique or less common amenities you offer (e.g., hot tub, dedicated workspace, EV charger) in your listing description and photos.
- Regularly check competitor amenities in Pakulonan Barat to stay competitive.
Pakulonan Barat Airbnb Guest Demographics & Profile Analysis (2026)
Guest Profile Summary for Pakulonan Barat
- The typical guest profile for Airbnb in Pakulonan Barat consists of primarily domestic travelers (66%), often arriving from nearby Jakarta, typically belonging to the Post-2000s (Gen Z/Alpha) group (50%), primarily speaking English or Indonesian.
- Domestic travelers account for 66.1% of guests.
- Key international markets include Indonesia (66.1%) and Australia (4.3%).
- Top languages spoken are English (40.6%) followed by Indonesian (38.3%).
- A significant demographic segment is the Post-2000s (Gen Z/Alpha) group, representing 50% of guests.
Recommendations for Hosts
- Target domestic marketing efforts towards travelers from Jakarta and Tangerang.
- Tailor amenities and listing descriptions to appeal to the dominant Post-2000s (Gen Z/Alpha) demographic (e.g., highlight fast WiFi, smart home features, local guides).
- Highlight unique local experiences or amenities relevant to the primary guest profile.
- Consider seasonal promotions aligned with peak travel times for key origin markets.
Nearby Short-Term Rental Market Comparison
How does the Pakulonan Barat Airbnb market stack up against its neighbors? Compare key performance metrics like average monthly revenue, ADR, and occupancy rates in surrounding areas to understand the broader regional STR landscape.
| Market | Active Properties | Monthly Revenue | Daily Rate | Avg. Occupancy |
|---|---|---|---|---|
| Kuta | 10 | $2,046 | $149.05 | 45% |
| Sukagalih | 13 | $1,306 | $157.45 | 34% |
| Citaringgul | 21 | $1,285 | $142.78 | 30% |
| Sukamanah | 12 | $1,151 | $148.28 | 28% |
| Ciburial | 191 | $1,114 | $288.50 | 18% |
| Leuwimalang | 15 | $1,109 | $203.41 | 20% |
| Wangunsari | 17 | $1,094 | $158.69 | 23% |
| Cigugur Girang | 21 | $1,057 | $163.07 | 19% |
| Sumur Batu | 50 | $1,026 | $180.80 | 21% |
| Kecamatan Parongpong | 14 | $1,014 | $182.15 | 23% |