Cibogo Airbnb Market Analysis 2025: Short Term Rental Data & Vacation Rental Statistics in Banten, Indonesia
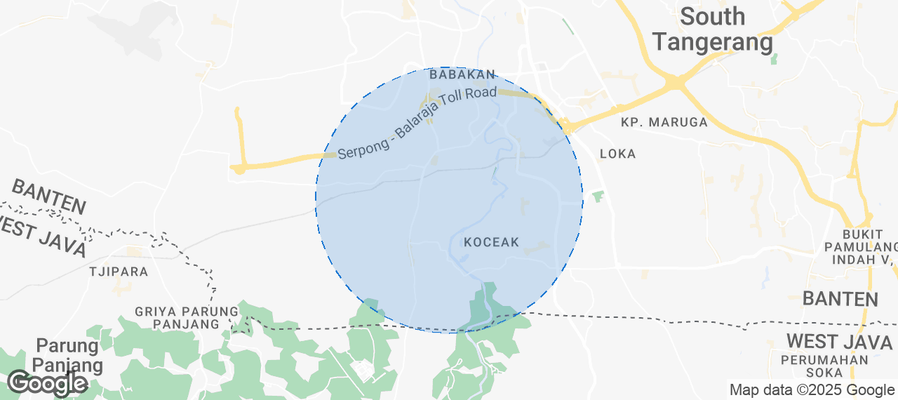
Is Airbnb profitable in Cibogo in 2025? Explore comprehensive Airbnb analytics for Cibogo, Banten, Indonesia to uncover income potential. This 2025 STR market report for Cibogo, based on AirROI data from August 2024 to July 2025, reveals key trends in the niche market of 18 active listings.
Whether you're considering an Airbnb investment in Cibogo, optimizing your existing vacation rental, or exploring rental arbitrage opportunities, understanding the Cibogo Airbnb data is crucial. Leveraging the low regulation environment is key to maximizing your short term rental income potential. Let's dive into the specifics.
Key Cibogo Airbnb Performance Metrics Overview
Monthly Airbnb Revenue Variations & Income Potential in Cibogo (2025)
Understanding the monthly revenue variations for Airbnb listings in Cibogo is key to maximizing your short term rental income potential. Seasonality significantly impacts earnings. Our analysis, based on data from the past 12 months, shows that the peak revenue month for STRs in Cibogo is typically October, while February often presents the lowest earnings, highlighting opportunities for strategic pricing adjustments during shoulder and low seasons. Explore the typical Airbnb income in Cibogo across different performance tiers:
- Best-in-class properties (Top 10%) achieve $405+ monthly, often utilizing dynamic pricing and superior guest experiences.
- Strong performing properties (Top 25%) earn $249 or more, indicating effective management and desirable locations/amenities.
- Typical properties (Median) generate around $128 per month, representing the average market performance.
- Entry-level properties (Bottom 25%) see earnings around $52, often with potential for optimization.
Average Monthly Airbnb Earnings Trend in Cibogo
Cibogo Airbnb Occupancy Rate Trends (2025)
Maximize your bookings by understanding the Cibogo STR occupancy trends. Seasonal demand shifts significantly influence how often properties are booked. Typically, Octobersees the highest demand (peak season occupancy), while February experiences the lowest (low season). Effective strategies, like adjusting minimum stays or offering promotions, can boost occupancy during slower periods. Here's how different property tiers perform in Cibogo:
- Best-in-class properties (Top 10%) achieve 69%+ occupancy, indicating high desirability and potentially optimized availability.
- Strong performing properties (Top 25%) maintain 47% or higher occupancy, suggesting good market fit and guest satisfaction.
- Typical properties (Median) have an occupancy rate around 26%.
- Entry-level properties (Bottom 25%) average 10% occupancy, potentially facing higher vacancy.
Average Monthly Occupancy Rate Trend in Cibogo
Average Daily Rate (ADR) Airbnb Trends in Cibogo (2025)
Effective short term rental pricing strategy in Cibogo involves understanding monthly ADR fluctuations. The Average Daily Rate (ADR) for Airbnb in Cibogo typically peaks in July and dips lowest during February. Leveraging Airbnb dynamic pricing tools or strategies based on this seasonality can significantly boost revenue. Here's a look at the typical nightly rates achieved:
- Best-in-class properties (Top 10%) command rates of $23+ per night, often due to premium features or locations.
- Strong performing properties (Top 25%) achieve nightly rates of $19 or more.
- Typical properties (Median) charge around $17 per night.
- Entry-level properties (Bottom 25%) earn around $14 per night.
Average Daily Rate (ADR) Trend by Month in Cibogo
Get Live Cibogo Market Intelligence 👇
Explore Real-time Analytics
Airbnb Seasonality Analysis & Trends in Cibogo (2025)
Peak Season (October, July, March)
- Revenue averages $221 per month
- Occupancy rates average 39.1%
- Daily rates average $18
Shoulder Season
- Revenue averages $170 per month
- Occupancy maintains around 30.4%
- Daily rates hold near $17
Low Season (February, August, November)
- Revenue drops to average $132 per month
- Occupancy decreases to average 25.3%
- Daily rates adjust to average $16
Seasonality Insights for Cibogo
- The Airbnb seasonality in Cibogo shows moderate seasonality with distinct peak and low periods. While the sections above show seasonal averages, it's also insightful to look at the extremes:
- During the high season, the absolute peak month showcases Cibogo's highest earning potential, with monthly revenues capable of climbing to $242, occupancy reaching a high of 49.4%, and ADRs peaking at $19.
- Conversely, the slowest single month of the year, typically falling within the low season, marks the market's lowest point. In this month, revenue might dip to $129, occupancy could drop to 21.8%, and ADRs may adjust down to $16.
- Understanding both the seasonal averages and these monthly peaks and troughs in revenue, occupancy, and ADR is crucial for maximizing your Airbnb profit potential in Cibogo.
Seasonal Strategies for Maximizing Profit
- Peak Season: Maximize revenue through premium pricing and potentially longer minimum stays. Ensure high availability.
- Low Season: Offer competitive pricing, special promotions (e.g., extended stay discounts), and flexible cancellation policies. Target off-season travelers like remote workers or budget-conscious guests.
- Shoulder Seasons: Implement dynamic pricing that balances peak and low rates. Target weekend travelers or specific events. Offer slightly more flexible terms than peak season.
- Regularly analyze your own performance against these Cibogo seasonality benchmarks and adjust your pricing and availability strategy accordingly.
Best Areas for Airbnb Investment in Cibogo (2025)
Exploring the top neighborhoods for short-term rentals in Cibogo? This section highlights key areas, outlining why they are attractive for hosts and guests, along with notable local attractions. Consider these locations based on your target guest profile and investment strategy.
| Neighborhood / Area | Why Host Here? (Target Guests & Appeal) | Key Attractions & Landmarks |
|---|---|---|
| Cibogo Highland | Scenic area known for its beautiful landscapes and cooler climate. Ideal for guests looking to escape the city heat and enjoy nature with easy access to trekking and outdoor activities. | Mount Pangrango, Cibodas Botanical Garden, Puncak Tea Plantations, Waterfall Cimeluk, Cibogo Strawberry Farm |
| Cibogo Village | A traditional village offering cultural experiences and local hospitality. Attracts guests interested in authentic Indonesian culture and local cuisine. | Local Warungs, Traditional Markets, Village Tours, Cultural Festivals, Rice Fields |
| Situ Cibereum | A tranquil lake area that offers recreational activities like fishing and picnicking. Great for families and those seeking relaxation in nature. | Situ Cibereum Lake, Lake-side Cafes, Fishing Spots, Bird Watching, Walking Trails |
| Cibogo Nature Park | A protected area with diverse flora and fauna, perfect for eco-tourism and nature lovers. Hosts educational tours and activities. | Eco-Tours, Nature Trails, Birdwatching, Botanical Tours, Camping Sites |
| Puncak Pass | A popular tourist destination located near Cibogo, known for stunning views and fresh air. Great for short trips from Jakarta. | Puncak Tea Plantation, Cimory Riverside, Taman Safari Indonesia, Cibeureum Waterfall, Hiking Trails |
| Cibogo Waterfall | Known for its beautiful waterfall and scenic surroundings, it's a perfect spot for nature enthusiasts and photographers. | Cibogo Waterfall, Hiking Trails, Natural Swimming Pools, Picnic Spots, Photography Opportunities |
| Green Valley Cibogo | A serene residential area offering privacy and lush surroundings, ideal for an exclusive getaway. | Private Villas, Lush Gardens, Nature Views, Quiet Atmosphere, Proximity to Nature |
| Cibogo Hot Springs | A unique attraction that draws visitors looking for relaxation and wellness experiences in natural hot springs. | Hot Spring Pools, Spa Services, Natural Surroundings, Relaxing Retreats, Nearby Hiking |
Understanding Airbnb License Requirements & STR Laws in Cibogo (2025)
While Cibogo, Banten, Indonesia currently shows low STR regulations, specific Airbnb license requirements might still exist or change. Always verify the latest short term rental regulations and Airbnb license requirements directly with local government authorities for Cibogo to ensure full compliance before hosting.
(Source: AirROI data, 2025, finding no licensed listings among those analyzed)
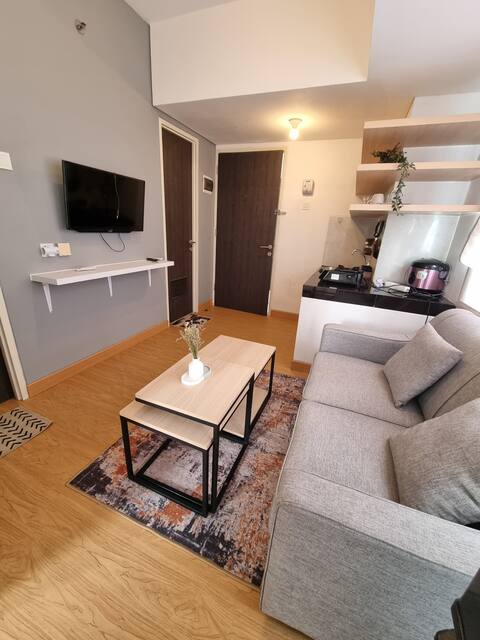
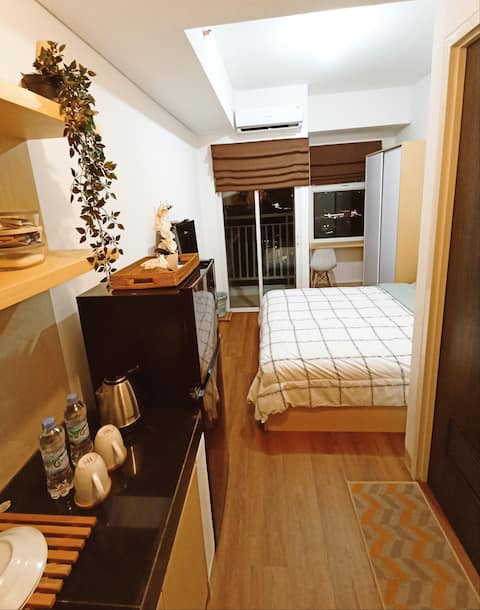
Top Performing Airbnb Properties in Cibogo (2025)
Benchmark your potential! Explore examples of top-performing Airbnb properties in Cibogobased on Trailing Twelve Month (TTM) revenue. Analyze their characteristics, revenue, occupancy rate, and ADR to understand what drives success in this market.

Sanmaru- Serpong Garden apt. 2 Br become 1 bigroom
Entire Place • 1 bedroom

Homey 2BR Apt - 4min St Cisauk
Entire Place • 2 bedrooms
2BR Apartment near AEON, ICE BSD
Entire Place • 2 bedrooms

1Bedroom Apart Serpong Garden BSD Mashley Room Pro
Entire Place • 1 bedroom

Apartment Serpong Garden- Lovely & cozy 2 bedrooms
Entire Place • 2 bedrooms
Serpong Garden Apartment Cisauk Affordable & Worth
Private Room • 1 bedroom
Note: Performance varies based on location, size, amenities, seasonality, and management quality. Data reflects the past 12 months.
Top Performing Airbnb Hosts in Cibogo (2025)
Learn from the best! This table showcases top-performing Airbnb hosts in Cibogo based on the number of properties managed and estimated total revenue over the past year. Analyze their scale and performance metrics.
| Host Name | Properties | Grossing Revenue | Stay Reviews | Avg Rating |
|---|---|---|---|---|
| Mudita | 1 | $3,985 | 32 | 4.59/5.0 |
| Anastashia | 1 | $3,595 | 49 | 4.86/5.0 |
| Intan | 1 | $1,348 | 13 | 4.46/5.0 |
| Joshua | 1 | $811 | 10 | 4.90/5.0 |
| Rizqy Fachri | 1 | $698 | 24 | 4.96/5.0 |
| Suite Spot | 3 | $684 | 9 | 4.50/5.0 |
| Februyanto | 1 | $650 | 21 | 4.90/5.0 |
| Erwin | 1 | $587 | 10 | 4.60/5.0 |
| Budiortiz | 1 | $570 | 3 | 5.00/5.0 |
| Bot | 1 | $441 | 1 | Not Rated |
Analyzing the strategies of top hosts, such as their property selection, pricing, and guest communication, can offer valuable lessons for optimizing your own Airbnb operations in Cibogo.
Dive Deeper: Advanced Cibogo STR Market Data (2025)
Ready to unlock more insights? AirROI provides access to advanced metrics and comprehensive Airbnb data for Cibogo. Explore detailed analytics beyond this report to refine your investment strategy, optimize pricing, and maximize your vacation rental profits.
Explore Advanced MetricsCibogo Short-Term Rental Market Composition (2025): Property & Room Types
Room Type Distribution
Property Type Distribution
Market Composition Insights for Cibogo
- The Cibogo Airbnb market composition is heavily skewed towards Entire Home/Apt listings, which make up 77.8% of the 18 active rentals. This indicates strong guest preference for privacy and space.
- Looking at the property type distribution in Cibogo, Apartment/Condo properties are the most common (100%), reflecting the local real estate landscape.
Cibogo Airbnb Room Capacity Analysis (2025): Bedroom Distribution
Distribution of Listings by Number of Bedrooms
Room Capacity Insights for Cibogo
- The dominant room capacity in Cibogo is 1 bedroom listings, making up 61.1% of the market. This suggests a strong demand for properties suitable for couples or solo travelers.
- Together, 1 bedroom and 2 bedrooms properties represent 88.9% of the active Airbnb listings in Cibogo, indicating a high concentration in these sizes.
- With over half the market (61.1%) consisting of studios or 1-bedroom units, Cibogo is particularly well-suited for individuals or couples.
Cibogo Vacation Rental Guest Capacity Trends (2025)
Distribution of Listings by Guest Capacity
Guest Capacity Insights for Cibogo
- The most common guest capacity trend in Cibogo vacation rentals is listings accommodating 2 guests (50%). This suggests the primary traveler segment is likely couples or solo travelers.
- Properties designed for 2 guests and 3 guests dominate the Cibogo STR market, accounting for 88.9% of listings.
- A significant 55.6% of listings cater specifically to 1-2 guests, highlighting strong demand from couples and solo travelers in Cibogo.
- On average, properties in Cibogo are equipped to host 2.2 guests.
Cibogo Airbnb Booking Patterns (2025): Available vs. Booked Days
Available Days Distribution
Booked Days Distribution
Booking Pattern Insights for Cibogo
- The most common availability pattern in Cibogo falls within the 271-366 days range, representing 88.9% of listings. This suggests many properties have significant open periods on their calendars.
- Approximately 88.9% of listings show high availability (181+ days open annually), indicating potential for increased bookings or specific owner usage patterns.
- For booked days, the 1-30 days range is most frequent in Cibogo (61.1%), reflecting common guest stay durations or potential owner blocking patterns.
- A notable 11.1% of properties secure long booking periods (181+ days booked per year), highlighting successful long-term rental strategies or significant owner usage.
Cibogo Airbnb Minimum Stay Requirements Analysis
Distribution of Listings by Minimum Night Requirement
1 Night
14 listings
77.8% of total
2 Nights
2 listings
11.1% of total
4-6 Nights
1 listings
5.6% of total
30+ Nights
1 listings
5.6% of total
Key Insights
- The most prevalent minimum stay requirement in Cibogo is 1 Night, adopted by 77.8% of listings. This highlights the market's preference for shorter, flexible bookings.
- A strong majority (88.9%) of the Cibogo Airbnb data shows acceptance of very short stays (1-2 nights), indicating a dynamic, high-turnover market.
Recommendations
- Align with the market by considering a 1 Night minimum stay, as 77.8% of Cibogo hosts use this setting.
- Explore offering discounts for stays of 30+ nights to attract the 5.6% of the market seeking extended stays.
- Adjust minimum nights based on seasonality – potentially shorter during low season and longer during peak demand periods in Cibogo.
Cibogo Airbnb Cancellation Policy Trends Analysis (2025)
Flexible
13 listings
76.5% of total
Moderate
1 listings
5.9% of total
Firm
1 listings
5.9% of total
Strict
2 listings
11.8% of total
Cancellation Policy Insights for Cibogo
- The prevailing Airbnb cancellation policy trend in Cibogo is Flexible, used by 76.5% of listings.
- The market strongly favors guest-friendly terms, with 82.4% of listings offering Flexible or Moderate policies. This suggests guests in Cibogo may expect booking flexibility.
Recommendations for Hosts
- Consider adopting a Flexible policy to align with the 76.5% market standard in Cibogo.
- Given the high prevalence of Flexible policies (76.5%), offering this can enhance booking appeal, especially during shoulder seasons.
- Using a Strict policy might deter some guests, as only 11.8% of listings use it. Evaluate if potential revenue protection outweighs possible lower booking rates.
- Regularly review your cancellation policy against competitors and market demand shifts in Cibogo.
Cibogo STR Booking Lead Time Analysis (2025)
Average Booking Lead Time by Month
Booking Lead Time Insights for Cibogo
- The overall average booking lead time for vacation rentals in Cibogo is 10 days.
- Guests book furthest in advance for stays during May (average 34 days), likely coinciding with peak travel demand or local events.
- The shortest booking windows occur for stays in January (average 7 days), indicating more last-minute travel plans during this time.
- Seasonally, Spring (19 days avg.) sees the longest lead times, while Winter (10 days avg.) has the shortest, reflecting typical travel planning cycles.
Recommendations for Hosts
- Use the overall average lead time (10 days) as a baseline for your pricing and availability strategy in Cibogo.
- For May stays, consider implementing length-of-stay discounts or slightly higher rates for bookings made less than 34 days out to capitalize on advance planning.
- Target marketing efforts for the Spring season well in advance (at least 19 days) to capture early planners.
- Monitor your own booking lead times against these Cibogo averages to identify opportunities for dynamic pricing adjustments.
Popular & Essential Airbnb Amenities in Cibogo (2025)
Amenity Prevalence
Amenity Insights for Cibogo
- Essential amenities in Cibogo that guests expect include: Air conditioning. Lacking these (this) could significantly impact bookings.
- Popular amenities like Pool, TV, Kitchen are common but not universal. Offering these can provide a competitive edge.
- A pool is a highly desired but not standard amenity, making it a key feature for attracting guests seeking leisure in Cibogo.
- Warning: Wifi is not universally provided but is considered essential globally. Ensure reliable Wifi is offered.
Recommendations for Hosts
- Ensure your listing includes all essential amenities for Cibogo: Air conditioning.
- Consider adding popular differentiators like Pool or TV to increase appeal.
- Highlight unique or less common amenities you offer (e.g., hot tub, dedicated workspace, EV charger) in your listing description and photos.
- Regularly check competitor amenities in Cibogo to stay competitive.
Cibogo Airbnb Guest Demographics & Profile Analysis (2025)
Guest Profile Summary for Cibogo
- The typical guest profile for Airbnb in Cibogo consists of primarily domestic travelers (78%), often arriving from nearby Jakarta, typically belonging to the Post-2000s (Gen Z/Alpha) group (50%), primarily speaking Indonesian or English.
- Domestic travelers account for 78.3% of guests.
- Key international markets include Indonesia (78.3%) and Singapore (13%).
- Top languages spoken are Indonesian (38.3%) followed by English (34%).
- A significant demographic segment is the Post-2000s (Gen Z/Alpha) group, representing 50% of guests.
Recommendations for Hosts
- Target domestic marketing efforts towards travelers from Jakarta and Bandung.
- Tailor amenities and listing descriptions to appeal to the dominant Post-2000s (Gen Z/Alpha) demographic (e.g., highlight fast WiFi, smart home features, local guides).
- Highlight unique local experiences or amenities relevant to the primary guest profile.
- Consider seasonal promotions aligned with peak travel times for key origin markets.
Nearby Short-Term Rental Market Comparison
How does the Cibogo Airbnb market stack up against its neighbors? Compare key performance metrics like average monthly revenue, ADR, and occupancy rates in surrounding areas to understand the broader regional STR landscape.
| Market | Active Properties | Monthly Revenue | Daily Rate | Avg. Occupancy |
|---|---|---|---|---|
| Kuta | 11 | $2,173 | $143.27 | 50% |
| Cigugur Girang | 21 | $1,359 | $174.66 | 27% |
| Citaringgul | 22 | $1,328 | $145.03 | 30% |
| Ciburial | 200 | $1,317 | $294.33 | 20% |
| Wangunsari | 17 | $1,311 | $165.73 | 25% |
| Sumur Batu | 52 | $1,251 | $205.22 | 24% |
| Leuwimalang | 16 | $1,221 | $201.76 | 23% |
| Cihideung | 49 | $1,124 | $230.30 | 22% |
| Karyawangi | 10 | $1,037 | $268.24 | 23% |
| Sukamanah | 11 | $989 | $153.26 | 28% |