Toyapakeh Airbnb Market Analysis 2026: Short Term Rental Data & Vacation Rental Statistics in Bali, Indonesia
Is Airbnb profitable in Toyapakeh in 2026? Explore comprehensive Airbnb analytics for Toyapakeh, Bali, Indonesia to uncover income potential. This 2026 STR market report for Toyapakeh, based on AirROI data from February 2025 to January 2026, reveals key trends in the niche market of 140 active listings.
Whether you're considering an Airbnb investment in Toyapakeh, optimizing your existing vacation rental, or exploring rental arbitrage opportunities, understanding the Toyapakeh Airbnb data is crucial. Leveraging the low regulation environment is key to maximizing your short term rental income potential. Let's dive into the specifics.
Key Toyapakeh Airbnb Performance Metrics Overview
Monthly Airbnb Revenue Variations & Income Potential in Toyapakeh (2026)
Understanding the monthly revenue variations for Airbnb listings in Toyapakeh is key to maximizing your short term rental income potential. Seasonality significantly impacts earnings. Our analysis, based on data from the past 12 months, shows that the peak revenue month for STRs in Toyapakeh is typically August, while February often presents the lowest earnings, highlighting opportunities for strategic pricing adjustments during shoulder and low seasons. Explore the typical Airbnb income in Toyapakeh across different performance tiers:
- Best-in-class properties (Top 10%) achieve $2,525+ monthly, often utilizing dynamic pricing and superior guest experiences.
- Strong performing properties (Top 25%) earn $951 or more, indicating effective management and desirable locations/amenities.
- Typical properties (Median) generate around $290 per month, representing the average market performance.
- Entry-level properties (Bottom 25%) see earnings around $111, often with potential for optimization.
Average Monthly Airbnb Earnings Trend in Toyapakeh
Toyapakeh Airbnb Occupancy Rate Trends (2026)
Maximize your bookings by understanding the Toyapakeh STR occupancy trends. Seasonal demand shifts significantly influence how often properties are booked. Typically, Augustsees the highest demand (peak season occupancy), while December experiences the lowest (low season). Effective strategies, like adjusting minimum stays or offering promotions, can boost occupancy during slower periods. Here's how different property tiers perform in Toyapakeh:
- Best-in-class properties (Top 10%) achieve 58%+ occupancy, indicating high desirability and potentially optimized availability.
- Strong performing properties (Top 25%) maintain 35% or higher occupancy, suggesting good market fit and guest satisfaction.
- Typical properties (Median) have an occupancy rate around 16%.
- Entry-level properties (Bottom 25%) average 9% occupancy, potentially facing higher vacancy.
Average Monthly Occupancy Rate Trend in Toyapakeh
Average Daily Rate (ADR) Airbnb Trends in Toyapakeh (2026)
Effective short term rental pricing strategy in Toyapakeh involves understanding monthly ADR fluctuations. The Average Daily Rate (ADR) for Airbnb in Toyapakeh typically peaks in July and dips lowest during November. Leveraging Airbnb dynamic pricing tools or strategies based on this seasonality can significantly boost revenue. Here's a look at the typical nightly rates achieved:
- Best-in-class properties (Top 10%) command rates of $246+ per night, often due to premium features or locations.
- Strong performing properties (Top 25%) achieve nightly rates of $129 or more.
- Typical properties (Median) charge around $65 per night.
- Entry-level properties (Bottom 25%) earn around $33 per night.
Average Daily Rate (ADR) Trend by Month in Toyapakeh
Get Live Toyapakeh Market Intelligence 👇

Explore Real-time Analytics
Airbnb Seasonality Analysis & Trends in Toyapakeh (2026)
Peak Season (August, July, May)
- Revenue averages $1,299 per month
- Occupancy rates average 30.9%
- Daily rates average $122
Shoulder Season
- Revenue averages $936 per month
- Occupancy maintains around 24.3%
- Daily rates hold near $104
Low Season (February, March, December)
- Revenue drops to average $696 per month
- Occupancy decreases to average 19.6%
- Daily rates adjust to average $108
Seasonality Insights for Toyapakeh
- The Airbnb seasonality in Toyapakeh shows highly seasonal trends requiring careful strategy. While the sections above show seasonal averages, it's also insightful to look at the extremes:
- During the high season, the absolute peak month showcases Toyapakeh's highest earning potential, with monthly revenues capable of climbing to $1,379, occupancy reaching a high of 33.9%, and ADRs peaking at $123.
- Conversely, the slowest single month of the year, typically falling within the low season, marks the market's lowest point. In this month, revenue might dip to $668, occupancy could drop to 16.4%, and ADRs may adjust down to $87.
- Understanding both the seasonal averages and these monthly peaks and troughs in revenue, occupancy, and ADR is crucial for maximizing your Airbnb profit potential in Toyapakeh.
Seasonal Strategies for Maximizing Profit
- Peak Season: Maximize revenue through premium pricing and potentially longer minimum stays. Ensure high availability.
- Low Season: Offer competitive pricing, special promotions (e.g., extended stay discounts), and flexible cancellation policies. Target off-season travelers like remote workers or budget-conscious guests.
- Shoulder Seasons: Implement dynamic pricing that balances peak and low rates. Target weekend travelers or specific events. Offer slightly more flexible terms than peak season.
- Regularly analyze your own performance against these Toyapakeh seasonality benchmarks and adjust your pricing and availability strategy accordingly.
Best Areas for Airbnb Investment in Toyapakeh (2026)
Exploring the top neighborhoods for short-term rentals in Toyapakeh? This section highlights key areas, outlining why they are attractive for hosts and guests, along with notable local attractions. Consider these locations based on your target guest profile and investment strategy.
| Neighborhood / Area | Why Host Here? (Target Guests & Appeal) | Key Attractions & Landmarks |
|---|---|---|
| Toyapakeh Beach | Beautiful beach area popular for its stunning marine life and diving spots. It's a perfect location for tourists looking for relaxation and water activities. | Toyapakeh Beach, Diving spots, Snorkeling sites, Nearby coral reefs |
| Nusa Penida Island | A must-visit destination for travelers exploring Bali, Nusa Penida offers breathtaking landscapes and unique attractions. | Kelingking Beach, Angel's Billabong, Broken Beach, Atuh Beach, snorkeling and diving tours |
| Crystal Bay | Famous for its crystal-clear waters and excellent snorkeling opportunities, this area attracts beach lovers and underwater enthusiasts. | Crystal Bay Beach, Snorkeling tours, Diving schools, Sunset views |
| Ped | A quieter area with a local vibe, Ped is ideal for visitors looking for a more authentic experience away from the crowds. | Local eateries, Quaint beaches, Cultural sites, Scenic routes |
| Batu Kelebit | Known for its stunning rice terraces and panoramic views, it's a great area for nature lovers and photographers. | Rice terraces, Scenic viewpoints, Local hiking trails |
| Goa Giri Putri Temple | A unique cave temple attracting spiritual tourists and those interested in Balinese culture. | Goa Giri Putri Temple, Cultural events, Local rituals |
| Nusa Lembongan | A neighboring island known for its beautiful beaches and vibrant nightlife, appealing to younger travelers. | Dream Beach, Devil's Tear, Local bars and restaurants, Surfing spots |
| Mangrove Forests | A natural reserve with rich biodiversity and eco-tourism options, perfect for those who love nature. | Mangrove kayaking, Bird watching, Nature tours |
Understanding Airbnb License Requirements & STR Laws in Toyapakeh (2026)
While Toyapakeh, Bali, Indonesia currently shows low STR regulations, specific Airbnb license requirements might still exist or change. Always verify the latest short term rental regulations and Airbnb license requirements directly with local government authorities for Toyapakeh to ensure full compliance before hosting.
(Source: AirROI data, 2026, finding no licensed listings among those analyzed)
Top Performing Airbnb Properties in Toyapakeh (2026)
Benchmark your potential! Explore examples of top-performing Airbnb properties in Toyapakehbased on Trailing Twelve Month (TTM) revenue. Analyze their characteristics, revenue, occupancy rate, and ADR to understand what drives success in this market.

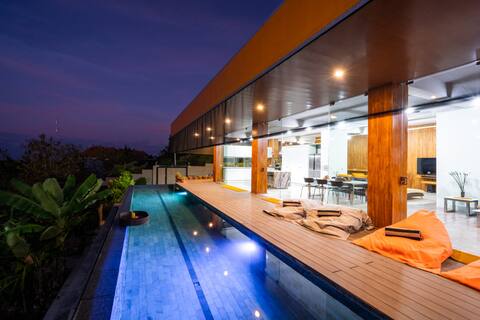
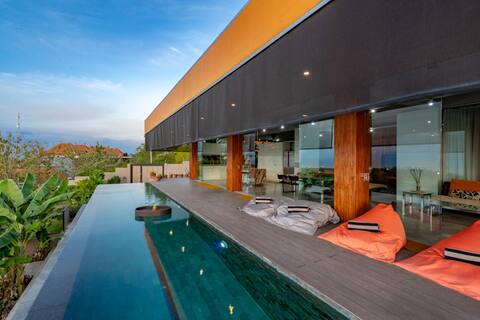
Honeymoon Place~Infinity view 360°on the roof Pool
Entire Place • 1 bedroom
The Arancia Luxury Villa 4BR with seaviews Penida
Entire Place • 4 bedrooms
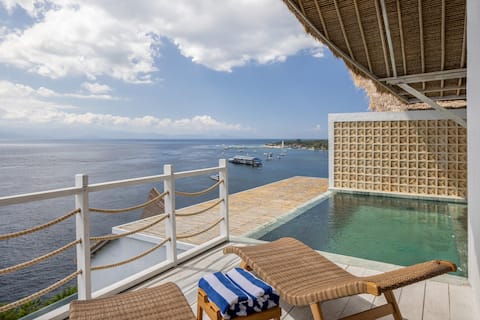
Oceanfront Pool Villa in Nusa Penida
Private Room • 1 bedroom
The Arancia Luxury Villa 3BR with seaviews Penida
Entire Place • 3 bedrooms
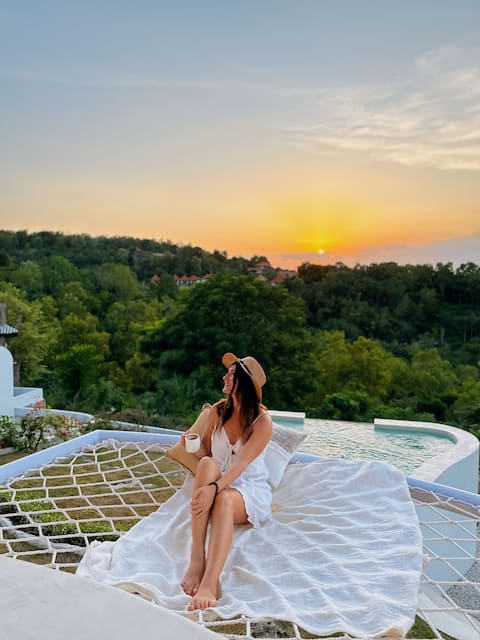
Honeymoon Approve~magical view for romantic couple
Entire Place • 1 bedroom
The Arancia Luxury Villa 2BR with seaviews Penida
Entire Place • 2 bedrooms
Note: Performance varies based on location, size, amenities, seasonality, and management quality. Data reflects the past 12 months.
Top Performing Airbnb Hosts in Toyapakeh (2026)
Learn from the best! This table showcases top-performing Airbnb hosts in Toyapakeh based on the number of properties managed and estimated total revenue over the past year. Analyze their scale and performance metrics.
| Host Name | Properties | Grossing Revenue | Stay Reviews | Avg Rating |
|---|---|---|---|---|
| Nomad Holiday Rentals | 3 | $203,501 | 144 | 4.66/5.0 |
| Camanta Penida | 2 | $154,258 | 117 | 4.80/5.0 |
| Kadek Arik Juana | 17 | $76,174 | 224 | 4.40/5.0 |
| I Wayan | 1 | $70,028 | 8 | 4.75/5.0 |
| Ni Komang | 5 | $42,049 | 377 | 4.82/5.0 |
| Miguel | 1 | $41,846 | 95 | 4.83/5.0 |
| I Kadek Parwata | 7 | $32,814 | 305 | 4.83/5.0 |
| Djitu Hospitality Solution | 1 | $29,843 | 2 | Not Rated |
| I Komang | 1 | $29,343 | 55 | 4.67/5.0 |
| Cintia | 7 | $27,057 | 83 | 4.61/5.0 |
Analyzing the strategies of top hosts, such as their property selection, pricing, and guest communication, can offer valuable lessons for optimizing your own Airbnb operations in Toyapakeh.
Dive Deeper: Advanced Toyapakeh STR Market Data (2026)
Ready to unlock more insights? AirROI provides access to advanced metrics and comprehensive Airbnb data for Toyapakeh. Explore detailed analytics beyond this report to refine your investment strategy, optimize pricing, and maximize your vacation rental profits.
Explore Advanced MetricsToyapakeh Short-Term Rental Market Composition (2026): Property & Room Types
Room Type Distribution
Property Type Distribution
Market Composition Insights for Toyapakeh
- The Toyapakeh Airbnb market composition is heavily skewed towards Private Room listings, which make up 82.9% of the 140 active rentals. This indicates strong guest preference for privacy and space.
- Looking at the property type distribution in Toyapakeh, Hotel/Boutique properties are the most common (52.9%), reflecting the local real estate landscape.
- Houses represent a significant 32.9% portion, catering likely to families or larger groups.
- The presence of 52.9% Hotel/Boutique listings indicates integration with traditional hospitality.
- Smaller segments like unique stays, apartment/condo (combined 5.0%) offer potential for unique stay experiences.
Toyapakeh Airbnb Room Capacity Analysis (2026): Bedroom Distribution
Distribution of Listings by Number of Bedrooms
Room Capacity Insights for Toyapakeh
- The dominant room capacity in Toyapakeh is 1 bedroom listings, making up 59.3% of the market. This suggests a strong demand for properties suitable for couples or solo travelers.
- Together, 1 bedroom and 2 bedrooms properties represent 70.0% of the active Airbnb listings in Toyapakeh, indicating a high concentration in these sizes.
- With over half the market (59.3%) consisting of studios or 1-bedroom units, Toyapakeh is particularly well-suited for individuals or couples.
Toyapakeh Vacation Rental Guest Capacity Trends (2026)
Distribution of Listings by Guest Capacity
Guest Capacity Insights for Toyapakeh
- The most common guest capacity trend in Toyapakeh vacation rentals is listings accommodating 2 guests (58.6%). This suggests the primary traveler segment is likely couples or solo travelers.
- Properties designed for 2 guests and 4 guests dominate the Toyapakeh STR market, accounting for 67.9% of listings.
- A significant 58.6% of listings cater specifically to 1-2 guests, highlighting strong demand from couples and solo travelers in Toyapakeh.
- 12.9% of properties accommodate 6+ guests, serving the market segment for larger families or group travel in Toyapakeh.
- On average, properties in Toyapakeh are equipped to host 2.5 guests.
Toyapakeh Airbnb Booking Patterns (2026): Available vs. Booked Days
Available Days Distribution
Booked Days Distribution
Booking Pattern Insights for Toyapakeh
- The most common availability pattern in Toyapakeh falls within the 271-366 days range, representing 83.6% of listings. This suggests many properties have significant open periods on their calendars.
- Approximately 90.7% of listings show high availability (181+ days open annually), indicating potential for increased bookings or specific owner usage patterns.
- For booked days, the 1-30 days range is most frequent in Toyapakeh (50%), reflecting common guest stay durations or potential owner blocking patterns.
- A notable 10.0% of properties secure long booking periods (181+ days booked per year), highlighting successful long-term rental strategies or significant owner usage.
Toyapakeh Airbnb Minimum Stay Requirements Analysis
Distribution of Listings by Minimum Night Requirement
1 Night
132 listings
94.3% of total
2 Nights
2 listings
1.4% of total
3 Nights
1 listings
0.7% of total
30+ Nights
5 listings
3.6% of total
Key Insights
- The most prevalent minimum stay requirement in Toyapakeh is 1 Night, adopted by 94.3% of listings. This highlights the market's preference for shorter, flexible bookings.
- A strong majority (95.7%) of the Toyapakeh Airbnb data shows acceptance of very short stays (1-2 nights), indicating a dynamic, high-turnover market.
Recommendations
- Align with the market by considering a 1 Night minimum stay, as 94.3% of Toyapakeh hosts use this setting.
- Adjust minimum nights based on seasonality – potentially shorter during low season and longer during peak demand periods in Toyapakeh.
Toyapakeh Airbnb Cancellation Policy Trends Analysis (2026)
Super Strict 60 Days
2 listings
1.4% of total
Super Strict 30 Days
3 listings
2.1% of total
Flexible
50 listings
35.7% of total
Moderate
34 listings
24.3% of total
Firm
23 listings
16.4% of total
Strict
28 listings
20% of total
Cancellation Policy Insights for Toyapakeh
- The prevailing Airbnb cancellation policy trend in Toyapakeh is Flexible, used by 35.7% of listings.
- There's a relatively balanced mix between guest-friendly (60.0%) and stricter (36.4%) policies, offering choices for different guest needs.
Recommendations for Hosts
- Consider adopting a Flexible policy to align with the 35.7% market standard in Toyapakeh.
- Regularly review your cancellation policy against competitors and market demand shifts in Toyapakeh.
Toyapakeh STR Booking Lead Time Analysis (2026)
Average Booking Lead Time by Month
Booking Lead Time Insights for Toyapakeh
- The overall average booking lead time for vacation rentals in Toyapakeh is 37 days.
- Guests book furthest in advance for stays during August (average 57 days), likely coinciding with peak travel demand or local events.
- The shortest booking windows occur for stays in June (average 28 days), indicating more last-minute travel plans during this time.
- Seasonally, Fall (45 days avg.) sees the longest lead times, while Winter (30 days avg.) has the shortest, reflecting typical travel planning cycles.
Recommendations for Hosts
- Use the overall average lead time (37 days) as a baseline for your pricing and availability strategy in Toyapakeh.
- For August stays, consider implementing length-of-stay discounts or slightly higher rates for bookings made less than 57 days out to capitalize on advance planning.
- Target marketing efforts for the Fall season well in advance (at least 45 days) to capture early planners.
- Monitor your own booking lead times against these Toyapakeh averages to identify opportunities for dynamic pricing adjustments.
Popular & Essential Airbnb Amenities in Toyapakeh (2026)
Amenity Prevalence
Amenity Insights for Toyapakeh
- Essential amenities in Toyapakeh that guests expect include: Wifi, Air conditioning, Free parking on premises. Lacking these (any) could significantly impact bookings.
- Popular amenities like Essentials, Shampoo, Hangers are common but not universal. Offering these can provide a competitive edge.
- A pool is a highly desired but not standard amenity, making it a key feature for attracting guests seeking leisure in Toyapakeh.
Recommendations for Hosts
- Ensure your listing includes all essential amenities for Toyapakeh: Wifi, Air conditioning, Free parking on premises.
- Prioritize adding missing essentials: Air conditioning, Free parking on premises.
- Consider adding popular differentiators like Essentials or Shampoo to increase appeal.
- Highlight unique or less common amenities you offer (e.g., hot tub, dedicated workspace, EV charger) in your listing description and photos.
- Regularly check competitor amenities in Toyapakeh to stay competitive.
Toyapakeh Airbnb Guest Demographics & Profile Analysis (2026)
Guest Profile Summary for Toyapakeh
- The typical guest profile for Airbnb in Toyapakeh consists of predominantly international visitors (100%), with top international origins including United States, typically belonging to the Post-2000s (Gen Z/Alpha) group (50%), primarily speaking English or French.
- Domestic travelers account for 0.2% of guests.
- Key international markets include France (19.1%) and United States (11.4%).
- Top languages spoken are English (42.8%) followed by French (14.6%).
- A significant demographic segment is the Post-2000s (Gen Z/Alpha) group, representing 50% of guests.
Recommendations for Hosts
- Focus marketing internationally, particularly towards travelers from United States.
- Tailor amenities and listing descriptions to appeal to the dominant Post-2000s (Gen Z/Alpha) demographic (e.g., highlight fast WiFi, smart home features, local guides).
- Highlight unique local experiences or amenities relevant to the primary guest profile.
- Consider seasonal promotions aligned with peak travel times for key origin markets.
Nearby Short-Term Rental Market Comparison
How does the Toyapakeh Airbnb market stack up against its neighbors? Compare key performance metrics like average monthly revenue, ADR, and occupancy rates in surrounding areas to understand the broader regional STR landscape.
| Market | Active Properties | Monthly Revenue | Daily Rate | Avg. Occupancy |
|---|---|---|---|---|
| Pejeng | 11 | $6,447 | $575.53 | 43% |
| Padangaji | 16 | $6,120 | $300.47 | 64% |
| BATAS DESA BATU JANGKIH | 13 | $4,822 | $309.81 | 55% |
| Kecamatan Praya Barat | 30 | $3,939 | $414.82 | 39% |
| Bedulu | 34 | $3,142 | $269.69 | 42% |
| Tangkas | 16 | $2,982 | $276.74 | 30% |
| Pejeng Kawan | 105 | $2,909 | $237.67 | 41% |
| Pecatu | 1,743 | $2,845 | $229.93 | 48% |
| Uluwatu | 30 | $2,806 | $254.53 | 56% |
| Seminyak | 1,680 | $2,790 | $282.61 | 42% |