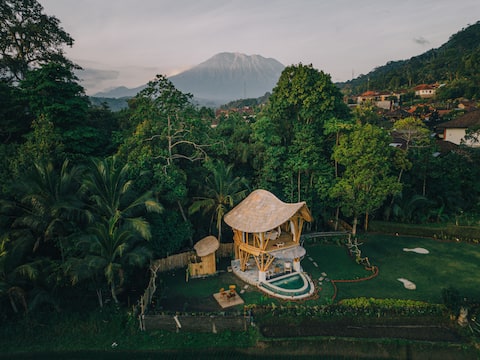
Sidemen Airbnb Market Analysis 2026: Short Term Rental Data & Vacation Rental Statistics in Bali, Indonesia
Is Airbnb profitable in Sidemen in 2026? Explore comprehensive Airbnb analytics for Sidemen, Bali, Indonesia to uncover income potential. This 2026 STR market report for Sidemen, based on AirROI data from February 2025 to January 2026, reveals key trends in the niche market of 68 active listings.
Whether you're considering an Airbnb investment in Sidemen, optimizing your existing vacation rental, or exploring rental arbitrage opportunities, understanding the Sidemen Airbnb data is crucial. Leveraging the low regulation environment is key to maximizing your short term rental income potential. Let's dive into the specifics.
Key Sidemen Airbnb Performance Metrics Overview
Monthly Airbnb Revenue Variations & Income Potential in Sidemen (2026)
Understanding the monthly revenue variations for Airbnb listings in Sidemen is key to maximizing your short term rental income potential. Seasonality significantly impacts earnings. Our analysis, based on data from the past 12 months, shows that the peak revenue month for STRs in Sidemen is typically February, while November often presents the lowest earnings, highlighting opportunities for strategic pricing adjustments during shoulder and low seasons. Explore the typical Airbnb income in Sidemen across different performance tiers:
- Best-in-class properties (Top 10%) achieve $4,789+ monthly, often utilizing dynamic pricing and superior guest experiences.
- Strong performing properties (Top 25%) earn $2,480 or more, indicating effective management and desirable locations/amenities.
- Typical properties (Median) generate around $630 per month, representing the average market performance.
- Entry-level properties (Bottom 25%) see earnings around $216, often with potential for optimization.
Average Monthly Airbnb Earnings Trend in Sidemen
Sidemen Airbnb Occupancy Rate Trends (2026)
Maximize your bookings by understanding the Sidemen STR occupancy trends. Seasonal demand shifts significantly influence how often properties are booked. Typically, Augustsees the highest demand (peak season occupancy), while January experiences the lowest (low season). Effective strategies, like adjusting minimum stays or offering promotions, can boost occupancy during slower periods. Here's how different property tiers perform in Sidemen:
- Best-in-class properties (Top 10%) achieve 74%+ occupancy, indicating high desirability and potentially optimized availability.
- Strong performing properties (Top 25%) maintain 56% or higher occupancy, suggesting good market fit and guest satisfaction.
- Typical properties (Median) have an occupancy rate around 33%.
- Entry-level properties (Bottom 25%) average 13% occupancy, potentially facing higher vacancy.
Average Monthly Occupancy Rate Trend in Sidemen
Average Daily Rate (ADR) Airbnb Trends in Sidemen (2026)
Effective short term rental pricing strategy in Sidemen involves understanding monthly ADR fluctuations. The Average Daily Rate (ADR) for Airbnb in Sidemen typically peaks in October and dips lowest during February. Leveraging Airbnb dynamic pricing tools or strategies based on this seasonality can significantly boost revenue. Here's a look at the typical nightly rates achieved:
- Best-in-class properties (Top 10%) command rates of $294+ per night, often due to premium features or locations.
- Strong performing properties (Top 25%) achieve nightly rates of $141 or more.
- Typical properties (Median) charge around $74 per night.
- Entry-level properties (Bottom 25%) earn around $42 per night.
Average Daily Rate (ADR) Trend by Month in Sidemen
Get Live Sidemen Market Intelligence 👇

Explore Real-time Analytics
Airbnb Seasonality Analysis & Trends in Sidemen (2026)
Peak Season (February, June, August)
- Revenue averages $2,456 per month
- Occupancy rates average 46.3%
- Daily rates average $120
Shoulder Season
- Revenue averages $1,761 per month
- Occupancy maintains around 37.1%
- Daily rates hold near $120
Low Season (January, November, December)
- Revenue drops to average $1,294 per month
- Occupancy decreases to average 24.8%
- Daily rates adjust to average $122
Seasonality Insights for Sidemen
- The Airbnb seasonality in Sidemen shows highly seasonal trends requiring careful strategy. While the sections above show seasonal averages, it's also insightful to look at the extremes:
- During the high season, the absolute peak month showcases Sidemen's highest earning potential, with monthly revenues capable of climbing to $2,962, occupancy reaching a high of 54.2%, and ADRs peaking at $129.
- Conversely, the slowest single month of the year, typically falling within the low season, marks the market's lowest point. In this month, revenue might dip to $1,229, occupancy could drop to 22.4%, and ADRs may adjust down to $116.
- Understanding both the seasonal averages and these monthly peaks and troughs in revenue, occupancy, and ADR is crucial for maximizing your Airbnb profit potential in Sidemen.
Seasonal Strategies for Maximizing Profit
- Peak Season: Maximize revenue through premium pricing and potentially longer minimum stays. Ensure high availability.
- Low Season: Offer competitive pricing, special promotions (e.g., extended stay discounts), and flexible cancellation policies. Target off-season travelers like remote workers or budget-conscious guests.
- Shoulder Seasons: Implement dynamic pricing that balances peak and low rates. Target weekend travelers or specific events. Offer slightly more flexible terms than peak season.
- Regularly analyze your own performance against these Sidemen seasonality benchmarks and adjust your pricing and availability strategy accordingly.
Best Areas for Airbnb Investment in Sidemen (2026)
Exploring the top neighborhoods for short-term rentals in Sidemen? This section highlights key areas, outlining why they are attractive for hosts and guests, along with notable local attractions. Consider these locations based on your target guest profile and investment strategy.
| Neighborhood / Area | Why Host Here? (Target Guests & Appeal) | Key Attractions & Landmarks |
|---|---|---|
| Bukit Asah | A stunning cliffside area providing breathtaking views of the ocean and the surrounding countryside. Perfect for tourists seeking tranquility and natural beauty, with opportunities for photography and relaxation. | Bukit Asah Hill, Sickling Hill, Beautiful rice terraces, Tirta Gangga Water Palace, Traditional Balinese villages |
| Sidemen Rice Fields | Known for its lush green landscapes and terraced rice paddies, this area attracts guests looking to experience the serene Balinese countryside and its traditional culture. | Rice field treks, Local pottery workshops, Tukad Cepung Waterfall, Sidemen Village tours, Balinese cooking classes |
| Bali Countryside Retreat | An immersive experience into Balinese traditions and rural life, offering guests a peaceful retreat away from the hustle and bustle of tourist hotspots. | Villages of Sidemen, Temples and cultural sites, Cycling tours of the countryside, Local markets, Volcano views |
| Tukad Cepung Waterfall | A natural wonder, this hidden waterfall attracts travelers looking for an adventure and stunning photo opportunities in a unique setting. | Hidden waterfall, Natural pools, Jungle trekking, Photography spots, Serene environment |
| Karangasem | A culturally rich area known for its historical sites and beautiful landscapes, attracting those interested in Balinese heritage and nature. | Besakih Temple, Tirta Gangga, Mount Agung, Landslides of rice fields, Snorkeling spots in Amed |
| Lembang, | A scenic area known for its clear air and stunning views, popular with nature lovers and those seeking a peaceful escape. | Natural hot springs, Countryside tours, Stargazing, Herbal gardens, Local cuisine |
| Restorative Retreats | A collection of wellness spas and health retreats that attract travelers looking for relaxation and rejuvenation in a serene environment. | Meditation and yoga centers, Healthy dining options, Spa treatments, Healing workshops, Nature walks |
| Cultural Hub of Sidemen | A center for Bali's cultural heritage with traditional dances, music, and arts, attracting tourists eager to learn and experience the authentic Balinese way of life. | Local dance performances, Artistry workshops, Craft markets, Historical tours, Balinese festivals |
Understanding Airbnb License Requirements & STR Laws in Sidemen (2026)
While Sidemen, Bali, Indonesia currently shows low STR regulations, specific Airbnb license requirements might still exist or change. Always verify the latest short term rental regulations and Airbnb license requirements directly with local government authorities for Sidemen to ensure full compliance before hosting.
(Source: AirROI data, 2026, finding no licensed listings among those analyzed)
Top Performing Airbnb Properties in Sidemen (2026)
Benchmark your potential! Explore examples of top-performing Airbnb properties in Sidemenbased on Trailing Twelve Month (TTM) revenue. Analyze their characteristics, revenue, occupancy rate, and ADR to understand what drives success in this market.

Veluvana Bali - Scorpio House
Entire Place • 1 bedroom

Laputa Villa #1 "The Bamboo Castle in the Sky"
Entire Place • 2 bedrooms

Veluvana Bali - Manta House
Entire Place • 1 bedroom

Rice Barn Private Pool Villa
Private Room • 1 bedroom

Brand New! Opening Rate! Sauca#2 Bamboo Villa
Entire Place • 1 bedroom
Sauca Bamboo Villa: A Tranquil Getaway
Entire Place • 1 bedroom
Note: Performance varies based on location, size, amenities, seasonality, and management quality. Data reflects the past 12 months.
Top Performing Airbnb Hosts in Sidemen (2026)
Learn from the best! This table showcases top-performing Airbnb hosts in Sidemen based on the number of properties managed and estimated total revenue over the past year. Analyze their scale and performance metrics.
| Host Name | Properties | Grossing Revenue | Stay Reviews | Avg Rating |
|---|---|---|---|---|
| Cito | 4 | $191,031 | 1001 | 4.91/5.0 |
| Ni Komang | 5 | $144,599 | 12 | 5.00/5.0 |
| Veluvana | 2 | $140,028 | 169 | 4.87/5.0 |
| Wira | 7 | $42,377 | 121 | 4.64/5.0 |
| Nyoman | 2 | $36,479 | 303 | 4.95/5.0 |
| Gin | 1 | $28,990 | 22 | 4.91/5.0 |
| Loris | 3 | $26,892 | 85 | 4.88/5.0 |
| Sarah | 6 | $20,555 | 99 | 4.41/5.0 |
| Takako | 1 | $12,041 | 3 | 4.67/5.0 |
| Arifin | 2 | $9,697 | 7 | 5.00/5.0 |
Analyzing the strategies of top hosts, such as their property selection, pricing, and guest communication, can offer valuable lessons for optimizing your own Airbnb operations in Sidemen.
Dive Deeper: Advanced Sidemen STR Market Data (2026)
Ready to unlock more insights? AirROI provides access to advanced metrics and comprehensive Airbnb data for Sidemen. Explore detailed analytics beyond this report to refine your investment strategy, optimize pricing, and maximize your vacation rental profits.
Explore Advanced MetricsSidemen Short-Term Rental Market Composition (2026): Property & Room Types
Room Type Distribution
Property Type Distribution
Market Composition Insights for Sidemen
- The Sidemen Airbnb market composition is heavily skewed towards Private Room listings, which make up 51.5% of the 68 active rentals. This indicates strong guest preference for privacy and space.
- Looking at the property type distribution in Sidemen, House properties are the most common (38.2%), reflecting the local real estate landscape.
- Houses represent a significant 38.2% portion, catering likely to families or larger groups.
- The presence of 36.8% Hotel/Boutique listings indicates integration with traditional hospitality.
Sidemen Airbnb Room Capacity Analysis (2026): Bedroom Distribution
Distribution of Listings by Number of Bedrooms
Room Capacity Insights for Sidemen
- The dominant room capacity in Sidemen is 1 bedroom listings, making up 58.8% of the market. This suggests a strong demand for properties suitable for couples or solo travelers.
- Together, 1 bedroom and 2 bedrooms properties represent 73.5% of the active Airbnb listings in Sidemen, indicating a high concentration in these sizes.
- With over half the market (58.8%) consisting of studios or 1-bedroom units, Sidemen is particularly well-suited for individuals or couples.
- Listings with 3+ bedrooms (4.4%) represent a smaller niche, potentially indicating an underserved market for larger group accommodations in Sidemen.
Sidemen Vacation Rental Guest Capacity Trends (2026)
Distribution of Listings by Guest Capacity
Guest Capacity Insights for Sidemen
- The most common guest capacity trend in Sidemen vacation rentals is listings accommodating 2 guests (52.9%). This suggests the primary traveler segment is likely couples or solo travelers.
- Properties designed for 2 guests and 4 guests dominate the Sidemen STR market, accounting for 69.1% of listings.
- A significant 52.9% of listings cater specifically to 1-2 guests, highlighting strong demand from couples and solo travelers in Sidemen.
- Listings for large groups (6+ guests) are relatively rare (4.4%), potentially indicating an opportunity for hosts targeting this segment in Sidemen.
- On average, properties in Sidemen are equipped to host 2.1 guests.
Sidemen Airbnb Booking Patterns (2026): Available vs. Booked Days
Available Days Distribution
Booked Days Distribution
Booking Pattern Insights for Sidemen
- The most common availability pattern in Sidemen falls within the 271-366 days range, representing 73.5% of listings. This suggests many properties have significant open periods on their calendars.
- Approximately 91.1% of listings show high availability (181+ days open annually), indicating potential for increased bookings or specific owner usage patterns.
- For booked days, the 1-30 days range is most frequent in Sidemen (38.2%), reflecting common guest stay durations or potential owner blocking patterns.
- A notable 8.9% of properties secure long booking periods (181+ days booked per year), highlighting successful long-term rental strategies or significant owner usage.
Sidemen Airbnb Minimum Stay Requirements Analysis
Distribution of Listings by Minimum Night Requirement
1 Night
63 listings
92.6% of total
2 Nights
5 listings
7.4% of total
Key Insights
- The most prevalent minimum stay requirement in Sidemen is 1 Night, adopted by 92.6% of listings. This highlights the market's preference for shorter, flexible bookings.
- A strong majority (100.0%) of the Sidemen Airbnb data shows acceptance of very short stays (1-2 nights), indicating a dynamic, high-turnover market.
Recommendations
- Align with the market by considering a 1 Night minimum stay, as 92.6% of Sidemen hosts use this setting.
- Adjust minimum nights based on seasonality – potentially shorter during low season and longer during peak demand periods in Sidemen.
Sidemen Airbnb Cancellation Policy Trends Analysis (2026)
Limited
1 listings
1.5% of total
Super Strict 30 Days
1 listings
1.5% of total
Flexible
23 listings
33.8% of total
Moderate
4 listings
5.9% of total
Firm
25 listings
36.8% of total
Strict
14 listings
20.6% of total
Cancellation Policy Insights for Sidemen
- The prevailing Airbnb cancellation policy trend in Sidemen is Firm, used by 36.8% of listings.
- A majority (57.4%) of hosts in Sidemen utilize Firm or Strict policies, indicating a market where hosts prioritize booking security.
Recommendations for Hosts
- Consider adopting a Firm policy to align with the 36.8% market standard in Sidemen.
- Regularly review your cancellation policy against competitors and market demand shifts in Sidemen.
Sidemen STR Booking Lead Time Analysis (2026)
Average Booking Lead Time by Month
Booking Lead Time Insights for Sidemen
- The overall average booking lead time for vacation rentals in Sidemen is 42 days.
- Guests book furthest in advance for stays during September (average 55 days), likely coinciding with peak travel demand or local events.
- The shortest booking windows occur for stays in December (average 24 days), indicating more last-minute travel plans during this time.
- Seasonally, Fall (50 days avg.) sees the longest lead times, while Winter (32 days avg.) has the shortest, reflecting typical travel planning cycles.
Recommendations for Hosts
- Use the overall average lead time (42 days) as a baseline for your pricing and availability strategy in Sidemen.
- For September stays, consider implementing length-of-stay discounts or slightly higher rates for bookings made less than 55 days out to capitalize on advance planning.
- Target marketing efforts for the Fall season well in advance (at least 50 days) to capture early planners.
- Monitor your own booking lead times against these Sidemen averages to identify opportunities for dynamic pricing adjustments.
Popular & Essential Airbnb Amenities in Sidemen (2026)
Amenity Prevalence
Amenity Insights for Sidemen
- Essential amenities in Sidemen that guests expect include: Wifi. Lacking these (this) could significantly impact bookings.
- Popular amenities like Free parking on premises, Air conditioning, Hot water are common but not universal. Offering these can provide a competitive edge.
- A pool is a highly desired but not standard amenity, making it a key feature for attracting guests seeking leisure in Sidemen.
Recommendations for Hosts
- Ensure your listing includes all essential amenities for Sidemen: Wifi.
- Consider adding popular differentiators like Free parking on premises or Air conditioning to increase appeal.
- Highlight unique or less common amenities you offer (e.g., hot tub, dedicated workspace, EV charger) in your listing description and photos.
- Regularly check competitor amenities in Sidemen to stay competitive.
Sidemen Airbnb Guest Demographics & Profile Analysis (2026)
Guest Profile Summary for Sidemen
- The typical guest profile for Airbnb in Sidemen consists of predominantly international visitors (99%), with top international origins including Germany, typically belonging to the Post-2000s (Gen Z/Alpha) group (50%), primarily speaking English or French.
- Domestic travelers account for 1.3% of guests.
- Key international markets include France (29.1%) and Germany (12.2%).
- Top languages spoken are English (40.9%) followed by French (19.4%).
- A significant demographic segment is the Post-2000s (Gen Z/Alpha) group, representing 50% of guests.
Recommendations for Hosts
- Focus marketing internationally, particularly towards travelers from Germany.
- Tailor amenities and listing descriptions to appeal to the dominant Post-2000s (Gen Z/Alpha) demographic (e.g., highlight fast WiFi, smart home features, local guides).
- Highlight unique local experiences or amenities relevant to the primary guest profile.
- Consider seasonal promotions aligned with peak travel times for key origin markets.
Nearby Short-Term Rental Market Comparison
How does the Sidemen Airbnb market stack up against its neighbors? Compare key performance metrics like average monthly revenue, ADR, and occupancy rates in surrounding areas to understand the broader regional STR landscape.
| Market | Active Properties | Monthly Revenue | Daily Rate | Avg. Occupancy |
|---|---|---|---|---|
| Pejeng | 11 | $6,447 | $575.53 | 43% |
| Padangaji | 16 | $6,120 | $300.47 | 64% |
| BATAS DESA BATU JANGKIH | 13 | $4,822 | $309.81 | 55% |
| Kecamatan Praya Barat | 30 | $3,939 | $414.82 | 39% |
| Bedulu | 34 | $3,142 | $269.69 | 42% |
| Tangkas | 16 | $2,982 | $276.74 | 30% |
| Pejeng Kawan | 105 | $2,909 | $237.67 | 41% |
| Pecatu | 1,743 | $2,845 | $229.93 | 48% |
| Uluwatu | 30 | $2,806 | $254.53 | 56% |
| Seminyak | 1,680 | $2,790 | $282.61 | 42% |