Kemenuh Airbnb Market Analysis 2026: Short Term Rental Data & Vacation Rental Statistics in Bali, Indonesia
Is Airbnb profitable in Kemenuh in 2026? Explore comprehensive Airbnb analytics for Kemenuh, Bali, Indonesia to uncover income potential. This 2026 STR market report for Kemenuh, based on AirROI data from February 2025 to January 2026, reveals key trends in the niche market of 72 active listings.
Whether you're considering an Airbnb investment in Kemenuh, optimizing your existing vacation rental, or exploring rental arbitrage opportunities, understanding the Kemenuh Airbnb data is crucial. Leveraging the low regulation environment is key to maximizing your short term rental income potential. Let's dive into the specifics.
Key Kemenuh Airbnb Performance Metrics Overview
Monthly Airbnb Revenue Variations & Income Potential in Kemenuh (2026)
Understanding the monthly revenue variations for Airbnb listings in Kemenuh is key to maximizing your short term rental income potential. Seasonality significantly impacts earnings. Our analysis, based on data from the past 12 months, shows that the peak revenue month for STRs in Kemenuh is typically August, while January often presents the lowest earnings, highlighting opportunities for strategic pricing adjustments during shoulder and low seasons. Explore the typical Airbnb income in Kemenuh across different performance tiers:
- Best-in-class properties (Top 10%) achieve $2,353+ monthly, often utilizing dynamic pricing and superior guest experiences.
- Strong performing properties (Top 25%) earn $1,127 or more, indicating effective management and desirable locations/amenities.
- Typical properties (Median) generate around $516 per month, representing the average market performance.
- Entry-level properties (Bottom 25%) see earnings around $214, often with potential for optimization.
Average Monthly Airbnb Earnings Trend in Kemenuh
Kemenuh Airbnb Occupancy Rate Trends (2026)
Maximize your bookings by understanding the Kemenuh STR occupancy trends. Seasonal demand shifts significantly influence how often properties are booked. Typically, Augustsees the highest demand (peak season occupancy), while January experiences the lowest (low season). Effective strategies, like adjusting minimum stays or offering promotions, can boost occupancy during slower periods. Here's how different property tiers perform in Kemenuh:
- Best-in-class properties (Top 10%) achieve 64%+ occupancy, indicating high desirability and potentially optimized availability.
- Strong performing properties (Top 25%) maintain 39% or higher occupancy, suggesting good market fit and guest satisfaction.
- Typical properties (Median) have an occupancy rate around 21%.
- Entry-level properties (Bottom 25%) average 10% occupancy, potentially facing higher vacancy.
Average Monthly Occupancy Rate Trend in Kemenuh
Average Daily Rate (ADR) Airbnb Trends in Kemenuh (2026)
Effective short term rental pricing strategy in Kemenuh involves understanding monthly ADR fluctuations. The Average Daily Rate (ADR) for Airbnb in Kemenuh typically peaks in June and dips lowest during January. Leveraging Airbnb dynamic pricing tools or strategies based on this seasonality can significantly boost revenue. Here's a look at the typical nightly rates achieved:
- Best-in-class properties (Top 10%) command rates of $207+ per night, often due to premium features or locations.
- Strong performing properties (Top 25%) achieve nightly rates of $128 or more.
- Typical properties (Median) charge around $70 per night.
- Entry-level properties (Bottom 25%) earn around $39 per night.
Average Daily Rate (ADR) Trend by Month in Kemenuh
Get Live Kemenuh Market Intelligence 👇

Explore Real-time Analytics
Airbnb Seasonality Analysis & Trends in Kemenuh (2026)
Peak Season (August, July, April)
- Revenue averages $1,309 per month
- Occupancy rates average 35.6%
- Daily rates average $99
Shoulder Season
- Revenue averages $835 per month
- Occupancy maintains around 27.5%
- Daily rates hold near $97
Low Season (January, October, December)
- Revenue drops to average $595 per month
- Occupancy decreases to average 20.2%
- Daily rates adjust to average $90
Seasonality Insights for Kemenuh
- The Airbnb seasonality in Kemenuh shows highly seasonal trends requiring careful strategy. While the sections above show seasonal averages, it's also insightful to look at the extremes:
- During the high season, the absolute peak month showcases Kemenuh's highest earning potential, with monthly revenues capable of climbing to $1,481, occupancy reaching a high of 40.2%, and ADRs peaking at $101.
- Conversely, the slowest single month of the year, typically falling within the low season, marks the market's lowest point. In this month, revenue might dip to $500, occupancy could drop to 16.2%, and ADRs may adjust down to $89.
- Understanding both the seasonal averages and these monthly peaks and troughs in revenue, occupancy, and ADR is crucial for maximizing your Airbnb profit potential in Kemenuh.
Seasonal Strategies for Maximizing Profit
- Peak Season: Maximize revenue through premium pricing and potentially longer minimum stays. Ensure high availability.
- Low Season: Offer competitive pricing, special promotions (e.g., extended stay discounts), and flexible cancellation policies. Target off-season travelers like remote workers or budget-conscious guests.
- Shoulder Seasons: Implement dynamic pricing that balances peak and low rates. Target weekend travelers or specific events. Offer slightly more flexible terms than peak season.
- Regularly analyze your own performance against these Kemenuh seasonality benchmarks and adjust your pricing and availability strategy accordingly.
Best Areas for Airbnb Investment in Kemenuh (2026)
Exploring the top neighborhoods for short-term rentals in Kemenuh? This section highlights key areas, outlining why they are attractive for hosts and guests, along with notable local attractions. Consider these locations based on your target guest profile and investment strategy.
| Neighborhood / Area | Why Host Here? (Target Guests & Appeal) | Key Attractions & Landmarks |
|---|---|---|
| Ubud Village | Cultural heart of Bali, Ubud is known for its traditional crafts, art scene, and lush landscapes. It attracts tourists looking for authentic Balinese experiences, wellness retreats, and scenic rice terraces. | Monkey Forest, Ubud Art Market, Tegalalang Rice Terrace, Ubud Palace, Campuhan Ridge Walk, Agung Rai Museum of Art |
| Tegalalang | Famous for its stunning rice terraces and picturesque landscapes, Tegalalang is a top destination for nature lovers and photographers. It offers tranquility away from the busier tourist areas while still being close to Ubud. | Tegalalang Rice Terrace, Bali Pulina Coffee Plantation, Tirta Empul Temple, Gunung Kawi Temple, Ubud's Art Scene, Waterfalls like Tegunungan |
| Nusa Dua | Nusa Dua is known for its luxury resorts, clean beaches, and water sports. It's a prime location for families and luxury travelers looking for upscale leisure experiences in Bali. | Nusa Dua Beach, Waterblow, Bali Collection, Geger Beach, Museum Pasifika, Devdan Show |
| Seminyak | Trendy and upscale area known for its high-end boutiques, beach clubs, and vibrant nightlife. Seminyak attracts both tourists and expats looking for a lively atmosphere and luxurious amenities. | Seminyak Beach, Potato Head Beach Club, Bali Spa, Eat Street, Seminyak Village, Sunset Point |
| Canggu | Popular with digital nomads and surfers, Canggu has a laid-back vibe with surf breaks, beach clubs, and a burgeoning café scene. It attracts young travelers and those seeking a relaxed lifestyle. | Echo Beach, La Brisa Beach Club, Batu Bolong Beach, Canggu Club, Old Man's, Surfing Lessons |
| Kuta | Famous for its nightlife and surf culture, Kuta is a bustling area attracting younger travelers. It's known for its beach and vibrant atmosphere, making it a hotspot for party-goers and surfers alike. | Kuta Beach, Waterbom Bali, Beachwalk Shopping Center, Kuta Square, Legian Beach, Sunset at Kuta |
| Jimbaran | Known for its seafood restaurants and beautiful beaches, Jimbaran offers a more tranquil side of Bali. It is great for families and couples looking for a serene getaway with beautiful sunset views. | Jimbaran Beach, Seafood Restaurants on the Beach, Samasta Lifestyle Village, Bukit Peninsula, Uluwatu Temple, Balangan Beach |
| Uluwatu | Famous for its stunning cliffs and surfing spots, Uluwatu is a top destination for beachgoers and those seeking breathtaking views. It's known for its culture and the famous Kecak dance performances. | Uluwatu Temple, Padang Padang Beach, Suluban Beach, Single Fin, Bingin Beach, Kecak Fire Dance |
Understanding Airbnb License Requirements & STR Laws in Kemenuh (2026)
While Kemenuh, Bali, Indonesia currently shows low STR regulations, specific Airbnb license requirements might still exist or change. Always verify the latest short term rental regulations and Airbnb license requirements directly with local government authorities for Kemenuh to ensure full compliance before hosting.
(Source: AirROI data, 2026, finding no licensed listings among those analyzed)
Top Performing Airbnb Properties in Kemenuh (2026)
Benchmark your potential! Explore examples of top-performing Airbnb properties in Kemenuhbased on Trailing Twelve Month (TTM) revenue. Analyze their characteristics, revenue, occupancy rate, and ADR to understand what drives success in this market.
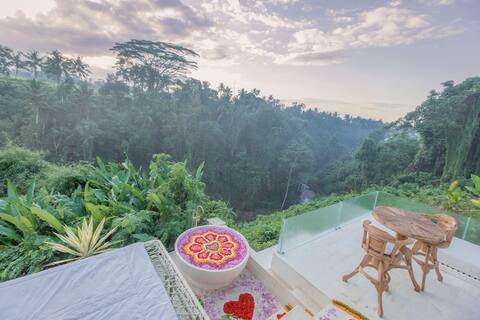
Lux Jungle/River Retreat @ VillaCellaBella
Private Room • 1 bedroom

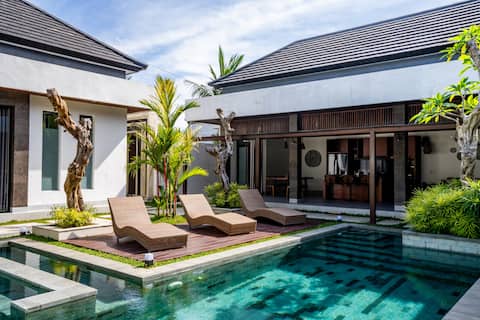
Jungle View Villa with Rooftop Pool & Red Room
Entire Place • 2 bedrooms
NEW! 3BR Luxurious villa near Ubud waterfalls
Entire Place • 3 bedrooms
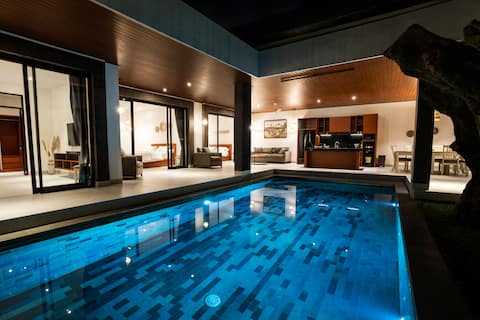
Luxury 3BR Villa Near Waterfalls Modern & Spacious
Entire Place • 3 bedrooms

Namaste Kemenuh 4 Bedrooms Villa
Entire Place • 4 bedrooms
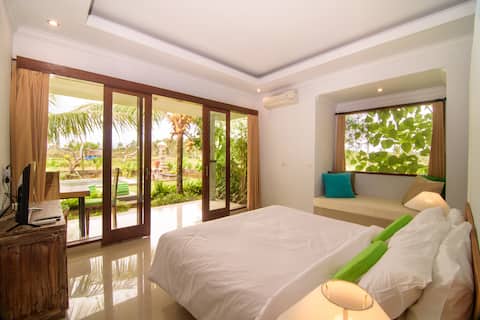
Spacious 2bedrooms Private Pool Endless Ricefield
Entire Place • 2 bedrooms
Note: Performance varies based on location, size, amenities, seasonality, and management quality. Data reflects the past 12 months.
Top Performing Airbnb Hosts in Kemenuh (2026)
Learn from the best! This table showcases top-performing Airbnb hosts in Kemenuh based on the number of properties managed and estimated total revenue over the past year. Analyze their scale and performance metrics.
| Host Name | Properties | Grossing Revenue | Stay Reviews | Avg Rating |
|---|---|---|---|---|
| Leon | 18 | $111,065 | 1472 | 4.75/5.0 |
| Escobar Villas | 2 | $57,647 | 76 | 4.96/5.0 |
| Clan Living The Founder | 2 | $54,568 | 39 | 4.39/5.0 |
| I Gusti Made | 2 | $51,739 | 269 | 4.86/5.0 |
| William | 2 | $22,531 | 18 | 3.63/5.0 |
| Ketut | 1 | $18,169 | 240 | 4.73/5.0 |
| Leon Wayan | 2 | $14,723 | 15 | 4.83/5.0 |
| Vinny Putu | 2 | $14,132 | 8 | 4.43/5.0 |
| ILys Bali Villas | 2 | $13,743 | 15 | 4.92/5.0 |
| I Wayan | 1 | $11,548 | 42 | 4.67/5.0 |
Analyzing the strategies of top hosts, such as their property selection, pricing, and guest communication, can offer valuable lessons for optimizing your own Airbnb operations in Kemenuh.
Dive Deeper: Advanced Kemenuh STR Market Data (2026)
Ready to unlock more insights? AirROI provides access to advanced metrics and comprehensive Airbnb data for Kemenuh. Explore detailed analytics beyond this report to refine your investment strategy, optimize pricing, and maximize your vacation rental profits.
Explore Advanced MetricsKemenuh Short-Term Rental Market Composition (2026): Property & Room Types
Room Type Distribution
Property Type Distribution
Market Composition Insights for Kemenuh
- The Kemenuh Airbnb market composition is heavily skewed towards Entire Home/Apt listings, which make up 55.6% of the 72 active rentals. This indicates strong guest preference for privacy and space.
- However, a notable 44.4% share for Private Rooms suggests opportunities for budget-conscious travelers or hosts renting out spare rooms.
- Looking at the property type distribution in Kemenuh, House properties are the most common (72.2%), reflecting the local real estate landscape.
- Houses represent a significant 72.2% portion, catering likely to families or larger groups.
- The presence of 22.2% Hotel/Boutique listings indicates integration with traditional hospitality.
- Smaller segments like others, outdoor/unique (combined 5.6%) offer potential for unique stay experiences.
Kemenuh Airbnb Room Capacity Analysis (2026): Bedroom Distribution
Distribution of Listings by Number of Bedrooms
Room Capacity Insights for Kemenuh
- The dominant room capacity in Kemenuh is 1 bedroom listings, making up 37.5% of the market. This suggests a strong demand for properties suitable for couples or solo travelers.
- Together, 1 bedroom and 3 bedrooms properties represent 54.2% of the active Airbnb listings in Kemenuh, indicating a high concentration in these sizes.
- A significant 26.4% of listings offer 3+ bedrooms, catering to larger groups and families seeking more space in Kemenuh.
Kemenuh Vacation Rental Guest Capacity Trends (2026)
Distribution of Listings by Guest Capacity
Guest Capacity Insights for Kemenuh
- The most common guest capacity trend in Kemenuh vacation rentals is listings accommodating 2 guests (38.9%). This suggests the primary traveler segment is likely couples or solo travelers.
- Properties designed for 2 guests and 4 guests dominate the Kemenuh STR market, accounting for 52.8% of listings.
- 23.6% of properties accommodate 6+ guests, serving the market segment for larger families or group travel in Kemenuh.
- On average, properties in Kemenuh are equipped to host 3.1 guests.
Kemenuh Airbnb Booking Patterns (2026): Available vs. Booked Days
Available Days Distribution
Booked Days Distribution
Booking Pattern Insights for Kemenuh
- The most common availability pattern in Kemenuh falls within the 271-366 days range, representing 73.6% of listings. This suggests many properties have significant open periods on their calendars.
- Approximately 95.8% of listings show high availability (181+ days open annually), indicating potential for increased bookings or specific owner usage patterns.
- For booked days, the 1-30 days range is most frequent in Kemenuh (40.3%), reflecting common guest stay durations or potential owner blocking patterns.
- A notable 4.2% of properties secure long booking periods (181+ days booked per year), highlighting successful long-term rental strategies or significant owner usage.
Kemenuh Airbnb Minimum Stay Requirements Analysis
Distribution of Listings by Minimum Night Requirement
1 Night
55 listings
76.4% of total
2 Nights
5 listings
6.9% of total
3 Nights
5 listings
6.9% of total
7-29 Nights
3 listings
4.2% of total
30+ Nights
4 listings
5.6% of total
Key Insights
- The most prevalent minimum stay requirement in Kemenuh is 1 Night, adopted by 76.4% of listings. This highlights the market's preference for shorter, flexible bookings.
- A strong majority (83.3%) of the Kemenuh Airbnb data shows acceptance of very short stays (1-2 nights), indicating a dynamic, high-turnover market.
Recommendations
- Align with the market by considering a 1 Night minimum stay, as 76.4% of Kemenuh hosts use this setting.
- Explore offering discounts for stays of 30+ nights to attract the 5.6% of the market seeking extended stays.
- Adjust minimum nights based on seasonality – potentially shorter during low season and longer during peak demand periods in Kemenuh.
Kemenuh Airbnb Cancellation Policy Trends Analysis (2026)
Flexible
23 listings
32.4% of total
Moderate
23 listings
32.4% of total
Firm
14 listings
19.7% of total
Strict
11 listings
15.5% of total
Cancellation Policy Insights for Kemenuh
- The prevailing Airbnb cancellation policy trend in Kemenuh is Flexible, used by 32.4% of listings.
- There's a relatively balanced mix between guest-friendly (64.8%) and stricter (35.2%) policies, offering choices for different guest needs.
Recommendations for Hosts
- Consider adopting a Flexible policy to align with the 32.4% market standard in Kemenuh.
- Regularly review your cancellation policy against competitors and market demand shifts in Kemenuh.
Kemenuh STR Booking Lead Time Analysis (2026)
Average Booking Lead Time by Month
Booking Lead Time Insights for Kemenuh
- The overall average booking lead time for vacation rentals in Kemenuh is 48 days.
- Guests book furthest in advance for stays during August (average 64 days), likely coinciding with peak travel demand or local events.
- The shortest booking windows occur for stays in February (average 33 days), indicating more last-minute travel plans during this time.
- Seasonally, Fall (57 days avg.) sees the longest lead times, while Winter (36 days avg.) has the shortest, reflecting typical travel planning cycles.
Recommendations for Hosts
- Use the overall average lead time (48 days) as a baseline for your pricing and availability strategy in Kemenuh.
- For August stays, consider implementing length-of-stay discounts or slightly higher rates for bookings made less than 64 days out to capitalize on advance planning.
- Target marketing efforts for the Fall season well in advance (at least 57 days) to capture early planners.
- Monitor your own booking lead times against these Kemenuh averages to identify opportunities for dynamic pricing adjustments.
Popular & Essential Airbnb Amenities in Kemenuh (2026)
Amenity Prevalence
Amenity Insights for Kemenuh
- Essential amenities in Kemenuh that guests expect include: Wifi, Air conditioning, Free parking on premises. Lacking these (any) could significantly impact bookings.
- Popular amenities like Pool, Hot water, Hangers are common but not universal. Offering these can provide a competitive edge.
- A pool is a highly desired but not standard amenity, making it a key feature for attracting guests seeking leisure in Kemenuh.
Recommendations for Hosts
- Ensure your listing includes all essential amenities for Kemenuh: Wifi, Air conditioning, Free parking on premises.
- Prioritize adding missing essentials: Air conditioning, Free parking on premises.
- Consider adding popular differentiators like Pool or Hot water to increase appeal.
- Highlight unique or less common amenities you offer (e.g., hot tub, dedicated workspace, EV charger) in your listing description and photos.
- Regularly check competitor amenities in Kemenuh to stay competitive.
Kemenuh Airbnb Guest Demographics & Profile Analysis (2026)
Guest Profile Summary for Kemenuh
- The typical guest profile for Airbnb in Kemenuh consists of predominantly international visitors (97%), with top international origins including Australia, typically belonging to the Post-2000s (Gen Z/Alpha) group (50%), primarily speaking English or Spanish.
- Domestic travelers account for 2.9% of guests.
- Key international markets include United States (11.5%) and Australia (10.8%).
- Top languages spoken are English (42.1%) followed by Spanish (8.2%).
- A significant demographic segment is the Post-2000s (Gen Z/Alpha) group, representing 50% of guests.
Recommendations for Hosts
- Focus marketing internationally, particularly towards travelers from Australia.
- Tailor amenities and listing descriptions to appeal to the dominant Post-2000s (Gen Z/Alpha) demographic (e.g., highlight fast WiFi, smart home features, local guides).
- Highlight unique local experiences or amenities relevant to the primary guest profile.
- Consider seasonal promotions aligned with peak travel times for key origin markets.
Nearby Short-Term Rental Market Comparison
How does the Kemenuh Airbnb market stack up against its neighbors? Compare key performance metrics like average monthly revenue, ADR, and occupancy rates in surrounding areas to understand the broader regional STR landscape.
| Market | Active Properties | Monthly Revenue | Daily Rate | Avg. Occupancy |
|---|---|---|---|---|
| Pejeng | 11 | $6,447 | $575.53 | 43% |
| Padangaji | 16 | $6,120 | $300.47 | 64% |
| BATAS DESA BATU JANGKIH | 13 | $4,822 | $309.81 | 55% |
| Kecamatan Praya Barat | 30 | $3,939 | $414.82 | 39% |
| Bedulu | 34 | $3,142 | $269.69 | 42% |
| Tangkas | 16 | $2,982 | $276.74 | 30% |
| Pejeng Kawan | 105 | $2,909 | $237.67 | 41% |
| Pecatu | 1,743 | $2,845 | $229.93 | 48% |
| Uluwatu | 30 | $2,806 | $254.53 | 56% |
| Seminyak | 1,680 | $2,790 | $282.61 | 42% |