Kecamatan Ubud Airbnb Market Analysis 2026: Short Term Rental Data & Vacation Rental Statistics in Bali, Indonesia
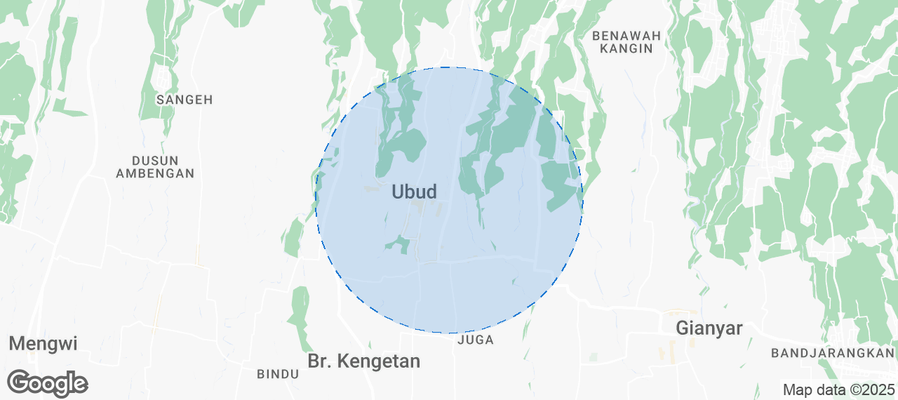
Is Airbnb profitable in Kecamatan Ubud in 2026? Explore comprehensive Airbnb analytics for Kecamatan Ubud, Bali, Indonesia to uncover income potential. This 2026 STR market report for Kecamatan Ubud, based on AirROI data from February 2025 to January 2026, reveals key trends in the market of 262 active listings.
Whether you're considering an Airbnb investment in Kecamatan Ubud, optimizing your existing vacation rental, or exploring rental arbitrage opportunities, understanding the Kecamatan Ubud Airbnb data is crucial. Leveraging the low regulation environment is key to maximizing your short term rental income potential. Let's dive into the specifics.
Key Kecamatan Ubud Airbnb Performance Metrics Overview
Monthly Airbnb Revenue Variations & Income Potential in Kecamatan Ubud (2026)
Understanding the monthly revenue variations for Airbnb listings in Kecamatan Ubud is key to maximizing your short term rental income potential. Seasonality significantly impacts earnings. Our analysis, based on data from the past 12 months, shows that the peak revenue month for STRs in Kecamatan Ubud is typically June, while February often presents the lowest earnings, highlighting opportunities for strategic pricing adjustments during shoulder and low seasons. Explore the typical Airbnb income in Kecamatan Ubud across different performance tiers:
- Best-in-class properties (Top 10%) achieve $4,342+ monthly, often utilizing dynamic pricing and superior guest experiences.
- Strong performing properties (Top 25%) earn $2,242 or more, indicating effective management and desirable locations/amenities.
- Typical properties (Median) generate around $1,070 per month, representing the average market performance.
- Entry-level properties (Bottom 25%) see earnings around $468, often with potential for optimization.
Average Monthly Airbnb Earnings Trend in Kecamatan Ubud
Kecamatan Ubud Airbnb Occupancy Rate Trends (2026)
Maximize your bookings by understanding the Kecamatan Ubud STR occupancy trends. Seasonal demand shifts significantly influence how often properties are booked. Typically, Junesees the highest demand (peak season occupancy), while February experiences the lowest (low season). Effective strategies, like adjusting minimum stays or offering promotions, can boost occupancy during slower periods. Here's how different property tiers perform in Kecamatan Ubud:
- Best-in-class properties (Top 10%) achieve 67%+ occupancy, indicating high desirability and potentially optimized availability.
- Strong performing properties (Top 25%) maintain 56% or higher occupancy, suggesting good market fit and guest satisfaction.
- Typical properties (Median) have an occupancy rate around 40%.
- Entry-level properties (Bottom 25%) average 24% occupancy, potentially facing higher vacancy.
Average Monthly Occupancy Rate Trend in Kecamatan Ubud
Average Daily Rate (ADR) Airbnb Trends in Kecamatan Ubud (2026)
Effective short term rental pricing strategy in Kecamatan Ubud involves understanding monthly ADR fluctuations. The Average Daily Rate (ADR) for Airbnb in Kecamatan Ubud typically peaks in September and dips lowest during November. Leveraging Airbnb dynamic pricing tools or strategies based on this seasonality can significantly boost revenue. Here's a look at the typical nightly rates achieved:
- Best-in-class properties (Top 10%) command rates of $316+ per night, often due to premium features or locations.
- Strong performing properties (Top 25%) achieve nightly rates of $185 or more.
- Typical properties (Median) charge around $90 per night.
- Entry-level properties (Bottom 25%) earn around $54 per night.
Average Daily Rate (ADR) Trend by Month in Kecamatan Ubud
Get Live Kecamatan Ubud Market Intelligence 👇
Explore Real-time Analytics
Airbnb Seasonality Analysis & Trends in Kecamatan Ubud (2026)
Peak Season (June, August, September)
- Revenue averages $2,594 per month
- Occupancy rates average 56.4%
- Daily rates average $148
Shoulder Season
- Revenue averages $1,615 per month
- Occupancy maintains around 37.2%
- Daily rates hold near $128
Low Season (February, March, April)
- Revenue drops to average $17 per month
- Occupancy decreases to average 1.2%
- Daily rates adjust to average $148
Seasonality Insights for Kecamatan Ubud
- The Airbnb seasonality in Kecamatan Ubud shows highly seasonal trends requiring careful strategy. While the sections above show seasonal averages, it's also insightful to look at the extremes:
- During the high season, the absolute peak month showcases Kecamatan Ubud's highest earning potential, with monthly revenues capable of climbing to $2,676, occupancy reaching a high of 60.1%, and ADRs peaking at $149.
- Conversely, the slowest single month of the year, typically falling within the low season, marks the market's lowest point. In this month, revenue might dip to $0, occupancy could drop to 0.0%, and ADRs may adjust down to $113.
- Understanding both the seasonal averages and these monthly peaks and troughs in revenue, occupancy, and ADR is crucial for maximizing your Airbnb profit potential in Kecamatan Ubud.
Seasonal Strategies for Maximizing Profit
- Peak Season: Maximize revenue through premium pricing and potentially longer minimum stays. Ensure high availability.
- Low Season: Offer competitive pricing, special promotions (e.g., extended stay discounts), and flexible cancellation policies. Target off-season travelers like remote workers or budget-conscious guests.
- Shoulder Seasons: Implement dynamic pricing that balances peak and low rates. Target weekend travelers or specific events. Offer slightly more flexible terms than peak season.
- Regularly analyze your own performance against these Kecamatan Ubud seasonality benchmarks and adjust your pricing and availability strategy accordingly.
Best Areas for Airbnb Investment in Kecamatan Ubud (2026)
Exploring the top neighborhoods for short-term rentals in Kecamatan Ubud? This section highlights key areas, outlining why they are attractive for hosts and guests, along with notable local attractions. Consider these locations based on your target guest profile and investment strategy.
| Neighborhood / Area | Why Host Here? (Target Guests & Appeal) | Key Attractions & Landmarks |
|---|---|---|
| Campuhan Ridge | Stunning views and lush greenery make Campuhan Ridge a popular area for those seeking tranquility and nature walks. It attracts visitors who want a peaceful retreat close to Ubud's cultural sites. | Campuhan Ridge Walk, Pura Gunung Lebah, The Blanco Renaissance Museum, Tjampuhan River, Ubud Traditional Market |
| Ubud Center | The heart of Ubud known for its art markets, cafes, and proximity to cultural landmarks. This area is highly sought after by tourists who want to experience Ubud's artistic vibe. | Ubud Monkey Forest, Ubud Art Market, Puri Saren Palace, Tegallalang Rice Terraces, Yoga Barn |
| Penestanan | A charming village known for its artistic community and beautiful rice field views. It attracts artists, yogis, and travelers looking for a unique local experience. | Penestanan Rice Fields, Neka Art Museum, Sari Organik, Pura Dalem Penestanan |
| Sayan | Known for its luxury villas and serene environment, Sayan is perfect for those seeking a high-end getaway close to nature yet only a short drive from Ubud's attractions. | Sayan Ridge, Karsa Spa, Bali Elephant Camp, Ayung River Rafting, Kecak Fire Dance |
| Kedewatan | Offering a more tranquil and luxurious setting, Kedewatan boasts beautiful views of the Ayung River and is ideal for visitors wanting a peaceful and upscale experience. | Ayung River, Bali Swing, Kedewatan Temple, Bali rafting tours |
| Tegalalang | Famous for its iconic rice terraces, Tegalalang offers stunning landscapes and is perfect for nature lovers and photographers. It's also close to various cultural sites. | Tegallalang Rice Terraces, Bali Reptile Park, Scenic viewpoints, Traditional Balinese villages |
| Mas | Known for its traditional wood carving workshops and artistic community, Mas offers visitors insight into Balinese craftsmanship along with a charming atmosphere. | Mas Carving Village, Bali Wood Carving Class, Pura Taman Pule |
| Banjarsari | A lesser-known area that offers a local experience away from the tourist crowds, Banjarsari is surrounded by nature and offers a glimpse into traditional Balinese life. | Local temples, Rice fields, Traditional Balinese homes |
Understanding Airbnb License Requirements & STR Laws in Kecamatan Ubud (2026)
While Kecamatan Ubud, Bali, Indonesia currently shows low STR regulations, specific Airbnb license requirements might still exist or change. Always verify the latest short term rental regulations and Airbnb license requirements directly with local government authorities for Kecamatan Ubud to ensure full compliance before hosting.
(Source: AirROI data, 2026, finding no licensed listings among those analyzed)
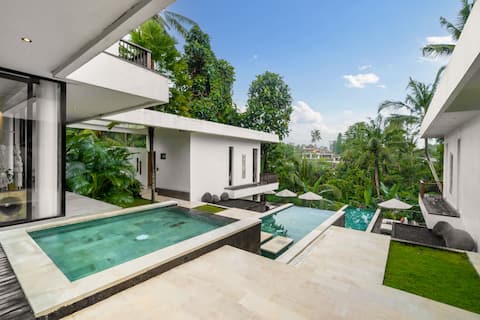
Top Performing Airbnb Properties in Kecamatan Ubud (2026)
Benchmark your potential! Explore examples of top-performing Airbnb properties in Kecamatan Ubudbased on Trailing Twelve Month (TTM) revenue. Analyze their characteristics, revenue, occupancy rate, and ADR to understand what drives success in this market.

Villa Theia : 6 BR Your Ultimate Sanctuary in Ubud
Entire Place • 6 bedrooms

Villa Rice Home : 6 BR Pool w/ GYM and Jungle View
Entire Place • 6 bedrooms
Villa Figaro : 6BR w/ Pool and Jungle View in Ubud
Entire Place • 6 bedrooms

Noi Special 4BR Tropical Villa with Ricefield View
Entire Place • 4 bedrooms

Modern Luxury Villa | 6 BDR | Chic Design
Entire Place • 6 bedrooms

Cozy Villa w/ Rooftop Jacuzzi&Pool in Central Ubud
Entire Place • 5 bedrooms
Note: Performance varies based on location, size, amenities, seasonality, and management quality. Data reflects the past 12 months.
Top Performing Airbnb Hosts in Kecamatan Ubud (2026)
Learn from the best! This table showcases top-performing Airbnb hosts in Kecamatan Ubud based on the number of properties managed and estimated total revenue over the past year. Analyze their scale and performance metrics.
| Host Name | Properties | Grossing Revenue | Stay Reviews | Avg Rating |
|---|---|---|---|---|
| BaliSuperHost | 32 | $1,491,043 | 3281 | 4.83/5.0 |
| DNA Villa Management | 33 | $269,755 | 647 | 4.85/5.0 |
| Bali Sands | 12 | $133,747 | 276 | 4.85/5.0 |
| I Ketut | 4 | $131,981 | 165 | 4.80/5.0 |
| Joshua | 3 | $126,458 | 50 | 4.86/5.0 |
| Farsight Management | 11 | $109,440 | 75 | 4.79/5.0 |
| Vida | 2 | $74,320 | 66 | 4.89/5.0 |
| Agnes | 3 | $67,681 | 43 | 4.96/5.0 |
| Helene'S House Bali | 1 | $66,855 | 7 | 5.00/5.0 |
| Esther | 1 | $64,874 | 7 | 5.00/5.0 |
Analyzing the strategies of top hosts, such as their property selection, pricing, and guest communication, can offer valuable lessons for optimizing your own Airbnb operations in Kecamatan Ubud.
Dive Deeper: Advanced Kecamatan Ubud STR Market Data (2026)
Ready to unlock more insights? AirROI provides access to advanced metrics and comprehensive Airbnb data for Kecamatan Ubud. Explore detailed analytics beyond this report to refine your investment strategy, optimize pricing, and maximize your vacation rental profits.
Explore Advanced MetricsKecamatan Ubud Short-Term Rental Market Composition (2026): Property & Room Types
Room Type Distribution
Property Type Distribution
Market Composition Insights for Kecamatan Ubud
- The Kecamatan Ubud Airbnb market composition is heavily skewed towards Entire Home/Apt listings, which make up 84.7% of the 262 active rentals. This indicates strong guest preference for privacy and space.
- Looking at the property type distribution in Kecamatan Ubud, House properties are the most common (79%), reflecting the local real estate landscape.
- Houses represent a significant 79% portion, catering likely to families or larger groups.
- The presence of 12.2% Hotel/Boutique listings indicates integration with traditional hospitality.
- Smaller segments like unique stays, outdoor/unique (combined 2.6%) offer potential for unique stay experiences.
Kecamatan Ubud Airbnb Room Capacity Analysis (2026): Bedroom Distribution
Distribution of Listings by Number of Bedrooms
Room Capacity Insights for Kecamatan Ubud
- The dominant room capacity in Kecamatan Ubud is 1 bedroom listings, making up 42% of the market. This suggests a strong demand for properties suitable for couples or solo travelers.
- Together, 1 bedroom and 2 bedrooms properties represent 68.0% of the active Airbnb listings in Kecamatan Ubud, indicating a high concentration in these sizes.
- A significant 24.0% of listings offer 3+ bedrooms, catering to larger groups and families seeking more space in Kecamatan Ubud.
Kecamatan Ubud Vacation Rental Guest Capacity Trends (2026)
Distribution of Listings by Guest Capacity
Guest Capacity Insights for Kecamatan Ubud
- The most common guest capacity trend in Kecamatan Ubud vacation rentals is listings accommodating 2 guests (41.2%). This suggests the primary traveler segment is likely couples or solo travelers.
- Properties designed for 2 guests and 4 guests dominate the Kecamatan Ubud STR market, accounting for 65.2% of listings.
- A significant 41.2% of listings cater specifically to 1-2 guests, highlighting strong demand from couples and solo travelers in Kecamatan Ubud.
- 23.7% of properties accommodate 6+ guests, serving the market segment for larger families or group travel in Kecamatan Ubud.
- On average, properties in Kecamatan Ubud are equipped to host 3.6 guests.
Kecamatan Ubud Airbnb Booking Patterns (2026): Available vs. Booked Days
Available Days Distribution
Booked Days Distribution
Booking Pattern Insights for Kecamatan Ubud
- The most common availability pattern in Kecamatan Ubud falls within the 181-270 days range, representing 46.9% of listings. This suggests many properties have significant open periods on their calendars.
- Approximately 91.6% of listings show high availability (181+ days open annually), indicating potential for increased bookings or specific owner usage patterns.
- For booked days, the 91-180 days range is most frequent in Kecamatan Ubud (48.5%), reflecting common guest stay durations or potential owner blocking patterns.
- A notable 8.8% of properties secure long booking periods (181+ days booked per year), highlighting successful long-term rental strategies or significant owner usage.
Kecamatan Ubud Airbnb Minimum Stay Requirements Analysis
Distribution of Listings by Minimum Night Requirement
1 Night
152 listings
58% of total
2 Nights
19 listings
7.3% of total
3 Nights
1 listings
0.4% of total
4-6 Nights
1 listings
0.4% of total
7-29 Nights
2 listings
0.8% of total
30+ Nights
87 listings
33.2% of total
Key Insights
- The most prevalent minimum stay requirement in Kecamatan Ubud is 1 Night, adopted by 58% of listings. This highlights the market's preference for shorter, flexible bookings.
- A strong majority (65.3%) of the Kecamatan Ubud Airbnb data shows acceptance of very short stays (1-2 nights), indicating a dynamic, high-turnover market.
- A significant segment (33.2%) caters to monthly stays (30+ nights) in Kecamatan Ubud, pointing to opportunities in the extended-stay market.
Recommendations
- Align with the market by considering a 1 Night minimum stay, as 58% of Kecamatan Ubud hosts use this setting.
- Explore offering discounts for stays of 30+ nights to attract the 33.2% of the market seeking extended stays.
- Adjust minimum nights based on seasonality – potentially shorter during low season and longer during peak demand periods in Kecamatan Ubud.
Kecamatan Ubud Airbnb Cancellation Policy Trends Analysis (2026)
Super Strict 30 Days
5 listings
1.9% of total
Super Strict 60 Days
2 listings
0.8% of total
Limited
5 listings
1.9% of total
Flexible
111 listings
42.4% of total
Moderate
40 listings
15.3% of total
Firm
89 listings
34% of total
Strict
10 listings
3.8% of total
Cancellation Policy Insights for Kecamatan Ubud
- The prevailing Airbnb cancellation policy trend in Kecamatan Ubud is Flexible, used by 42.4% of listings.
- There's a relatively balanced mix between guest-friendly (57.7%) and stricter (37.8%) policies, offering choices for different guest needs.
- Strict cancellation policies are quite rare (3.8%), potentially making listings with this policy less competitive unless justified by high demand or property type.
Recommendations for Hosts
- Consider adopting a Flexible policy to align with the 42.4% market standard in Kecamatan Ubud.
- Using a Strict policy might deter some guests, as only 3.8% of listings use it. Evaluate if potential revenue protection outweighs possible lower booking rates.
- Regularly review your cancellation policy against competitors and market demand shifts in Kecamatan Ubud.
Kecamatan Ubud STR Booking Lead Time Analysis (2026)
Average Booking Lead Time by Month
Booking Lead Time Insights for Kecamatan Ubud
- The overall average booking lead time for vacation rentals in Kecamatan Ubud is 27 days.
- Guests book furthest in advance for stays during February (average 47 days), likely coinciding with peak travel demand or local events.
- The shortest booking windows occur for stays in April (average 0 days), indicating more last-minute travel plans during this time.
- Seasonally, Fall (37 days avg.) sees the longest lead times, while Spring (0 days avg.) has the shortest, reflecting typical travel planning cycles.
Recommendations for Hosts
- Use the overall average lead time (27 days) as a baseline for your pricing and availability strategy in Kecamatan Ubud.
- For February stays, consider implementing length-of-stay discounts or slightly higher rates for bookings made less than 47 days out to capitalize on advance planning.
- During April, focus on last-minute booking availability and promotions, as guests book with very short notice (0 days avg.).
- Target marketing efforts for the Fall season well in advance (at least 37 days) to capture early planners.
- Monitor your own booking lead times against these Kecamatan Ubud averages to identify opportunities for dynamic pricing adjustments.
Popular & Essential Airbnb Amenities in Kecamatan Ubud (2026)
Amenity Prevalence
Amenity Insights for Kecamatan Ubud
- Essential amenities in Kecamatan Ubud that guests expect include: Wifi, Air conditioning. Lacking these (any) could significantly impact bookings.
- Popular amenities like Pool, Kitchen, Hot water are common but not universal. Offering these can provide a competitive edge.
- A pool is a highly desired but not standard amenity, making it a key feature for attracting guests seeking leisure in Kecamatan Ubud.
Recommendations for Hosts
- Ensure your listing includes all essential amenities for Kecamatan Ubud: Wifi, Air conditioning.
- Prioritize adding missing essentials: Wifi, Air conditioning.
- Consider adding popular differentiators like Pool or Kitchen to increase appeal.
- Highlight unique or less common amenities you offer (e.g., hot tub, dedicated workspace, EV charger) in your listing description and photos.
- Regularly check competitor amenities in Kecamatan Ubud to stay competitive.
Kecamatan Ubud Airbnb Guest Demographics & Profile Analysis (2026)
Guest Profile Summary for Kecamatan Ubud
- The typical guest profile for Airbnb in Kecamatan Ubud consists of predominantly international visitors (94%), with top international origins including Australia, typically belonging to the Post-2000s (Gen Z/Alpha) group (50%), primarily speaking English or French.
- Domestic travelers account for 5.9% of guests.
- Key international markets include United States (12.2%) and Australia (12%).
- Top languages spoken are English (44.7%) followed by French (10.7%).
- A significant demographic segment is the Post-2000s (Gen Z/Alpha) group, representing 50% of guests.
Recommendations for Hosts
- Focus marketing internationally, particularly towards travelers from Australia.
- Tailor amenities and listing descriptions to appeal to the dominant Post-2000s (Gen Z/Alpha) demographic (e.g., highlight fast WiFi, smart home features, local guides).
- Highlight unique local experiences or amenities relevant to the primary guest profile.
- Consider seasonal promotions aligned with peak travel times for key origin markets.
Nearby Short-Term Rental Market Comparison
How does the Kecamatan Ubud Airbnb market stack up against its neighbors? Compare key performance metrics like average monthly revenue, ADR, and occupancy rates in surrounding areas to understand the broader regional STR landscape.
| Market | Active Properties | Monthly Revenue | Daily Rate | Avg. Occupancy |
|---|---|---|---|---|
| Pejeng | 11 | $6,447 | $575.53 | 43% |
| Padangaji | 16 | $6,120 | $300.47 | 64% |
| BATAS DESA BATU JANGKIH | 13 | $4,822 | $309.81 | 55% |
| Kecamatan Praya Barat | 30 | $3,939 | $414.82 | 39% |
| Bedulu | 34 | $3,142 | $269.69 | 42% |
| Tangkas | 16 | $2,982 | $276.74 | 30% |
| Pejeng Kawan | 105 | $2,909 | $237.67 | 41% |
| Pecatu | 1,743 | $2,845 | $229.93 | 48% |
| Uluwatu | 30 | $2,806 | $254.53 | 56% |
| Seminyak | 1,680 | $2,790 | $282.61 | 42% |