Jungutbatu Airbnb Market Analysis 2026: Short Term Rental Data & Vacation Rental Statistics in Bali, Indonesia
Is Airbnb profitable in Jungutbatu in 2026? Explore comprehensive Airbnb analytics for Jungutbatu, Bali, Indonesia to uncover income potential. This 2026 STR market report for Jungutbatu, based on AirROI data from February 2025 to January 2026, reveals key trends in the market of 562 active listings.
Whether you're considering an Airbnb investment in Jungutbatu, optimizing your existing vacation rental, or exploring rental arbitrage opportunities, understanding the Jungutbatu Airbnb data is crucial. Leveraging the low regulation environment is key to maximizing your short term rental income potential. Let's dive into the specifics.
Key Jungutbatu Airbnb Performance Metrics Overview
Monthly Airbnb Revenue Variations & Income Potential in Jungutbatu (2026)
Understanding the monthly revenue variations for Airbnb listings in Jungutbatu is key to maximizing your short term rental income potential. Seasonality significantly impacts earnings. Our analysis, based on data from the past 12 months, shows that the peak revenue month for STRs in Jungutbatu is typically July, while January often presents the lowest earnings, highlighting opportunities for strategic pricing adjustments during shoulder and low seasons. Explore the typical Airbnb income in Jungutbatu across different performance tiers:
- Best-in-class properties (Top 10%) achieve $7,519+ monthly, often utilizing dynamic pricing and superior guest experiences.
- Strong performing properties (Top 25%) earn $3,510 or more, indicating effective management and desirable locations/amenities.
- Typical properties (Median) generate around $864 per month, representing the average market performance.
- Entry-level properties (Bottom 25%) see earnings around $246, often with potential for optimization.
Average Monthly Airbnb Earnings Trend in Jungutbatu
Jungutbatu Airbnb Occupancy Rate Trends (2026)
Maximize your bookings by understanding the Jungutbatu STR occupancy trends. Seasonal demand shifts significantly influence how often properties are booked. Typically, Julysees the highest demand (peak season occupancy), while January experiences the lowest (low season). Effective strategies, like adjusting minimum stays or offering promotions, can boost occupancy during slower periods. Here's how different property tiers perform in Jungutbatu:
- Best-in-class properties (Top 10%) achieve 81%+ occupancy, indicating high desirability and potentially optimized availability.
- Strong performing properties (Top 25%) maintain 61% or higher occupancy, suggesting good market fit and guest satisfaction.
- Typical properties (Median) have an occupancy rate around 30%.
- Entry-level properties (Bottom 25%) average 14% occupancy, potentially facing higher vacancy.
Average Monthly Occupancy Rate Trend in Jungutbatu
Average Daily Rate (ADR) Airbnb Trends in Jungutbatu (2026)
Effective short term rental pricing strategy in Jungutbatu involves understanding monthly ADR fluctuations. The Average Daily Rate (ADR) for Airbnb in Jungutbatu typically peaks in July and dips lowest during November. Leveraging Airbnb dynamic pricing tools or strategies based on this seasonality can significantly boost revenue. Here's a look at the typical nightly rates achieved:
- Best-in-class properties (Top 10%) command rates of $345+ per night, often due to premium features or locations.
- Strong performing properties (Top 25%) achieve nightly rates of $166 or more.
- Typical properties (Median) charge around $70 per night.
- Entry-level properties (Bottom 25%) earn around $35 per night.
Average Daily Rate (ADR) Trend by Month in Jungutbatu
Get Live Jungutbatu Market Intelligence 👇

Explore Real-time Analytics
Airbnb Seasonality Analysis & Trends in Jungutbatu (2026)
Peak Season (July, August, September)
- Revenue averages $3,323 per month
- Occupancy rates average 46.4%
- Daily rates average $157
Shoulder Season
- Revenue averages $2,698 per month
- Occupancy maintains around 38.3%
- Daily rates hold near $145
Low Season (January, February, December)
- Revenue drops to average $2,067 per month
- Occupancy decreases to average 29.7%
- Daily rates adjust to average $145
Seasonality Insights for Jungutbatu
- The Airbnb seasonality in Jungutbatu shows moderate seasonality with distinct peak and low periods. While the sections above show seasonal averages, it's also insightful to look at the extremes:
- During the high season, the absolute peak month showcases Jungutbatu's highest earning potential, with monthly revenues capable of climbing to $3,539, occupancy reaching a high of 49.1%, and ADRs peaking at $159.
- Conversely, the slowest single month of the year, typically falling within the low season, marks the market's lowest point. In this month, revenue might dip to $1,862, occupancy could drop to 25.8%, and ADRs may adjust down to $140.
- Understanding both the seasonal averages and these monthly peaks and troughs in revenue, occupancy, and ADR is crucial for maximizing your Airbnb profit potential in Jungutbatu.
Seasonal Strategies for Maximizing Profit
- Peak Season: Maximize revenue through premium pricing and potentially longer minimum stays. Ensure high availability.
- Low Season: Offer competitive pricing, special promotions (e.g., extended stay discounts), and flexible cancellation policies. Target off-season travelers like remote workers or budget-conscious guests.
- Shoulder Seasons: Implement dynamic pricing that balances peak and low rates. Target weekend travelers or specific events. Offer slightly more flexible terms than peak season.
- Regularly analyze your own performance against these Jungutbatu seasonality benchmarks and adjust your pricing and availability strategy accordingly.
Best Areas for Airbnb Investment in Jungutbatu (2026)
Exploring the top neighborhoods for short-term rentals in Jungutbatu? This section highlights key areas, outlining why they are attractive for hosts and guests, along with notable local attractions. Consider these locations based on your target guest profile and investment strategy.
| Neighborhood / Area | Why Host Here? (Target Guests & Appeal) | Key Attractions & Landmarks |
|---|---|---|
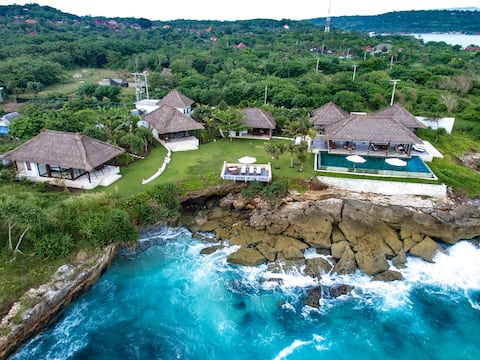
| Jungutbatu Beach | Jungutbatu Beach is a stunning beachfront area known for its clear waters and relaxing atmosphere. It's a prime spot for tourists looking to explore Bali's beautiful coastline and enjoy water sports. | Jungutbatu Beach, Snorkeling at Tanjung Sanghyang, Bali's famous sunset views, Diving in Nusa Lembongan, Local Warungs and seafood restaurants |
| Yellow Bridge | The iconic Yellow Bridge connects Nusa Lembongan to Nusa Ceningan, offering picturesque views and a popular crossing point for tourists. It's an excellent area for setting up accommodations for visitors exploring the islands. | Yellow Bridge, Nusa Ceningan, Ceningan Cliff, Secret Beach, Blue Lagoon Beach |
| Devil's Tear | A famous natural attraction known for its dramatic waves and striking coastal scenery. Visitors flock here for the stunning views and photo opportunities, making it a hot spot for nearby accommodations. | Devil's Tear, Dream Beach, Sunset Point, Natural Rock Pools, Lembongan Island |
| Tanjung Sanghyang | This area offers unmatched snorkeling opportunities and beautiful coral reefs. Perfect for those looking to host guests who love marine life and water activities. | Tanjung Sanghyang Beach, Snorkeling Tours, Mangrove Forest Excursions, Sandy Beaches, Bali Hai Cruises |
| Ceningan Island | Close to Jungutbatu, Ceningan Island is less crowded and provides a more rustic experience. It's great for those seeking tranquility and natural beauty. | Ceningan Cliffs, Secret Beach, Le Pirate Beach Club, Blue Lagoon, Rock Bar |
| Nusa Lembongan Village | The village area hosts a variety of local experiences, from dining to cultural activities. It's ideal for guests wanting to immerse themselves in local Balinese culture. | Cultural Temple Visits, Nusa Lembongan Markets, Balinese Cooking Classes, Local Artisan Shops, Village Tours |
| Sandy Bay Beach Club | Known for its trendy beach club atmosphere, this area attracts visitors looking for a vibrant social scene and luxurious beach relaxation. | Sandy Bay Beach Club, Sunset Views, Dining and Nightlife, Beachside Relaxation, Water Sports Activities |
| Sunset Point | One of the best views on the island, Sunset Point draws tourists looking for breathtaking panoramic views and perfect sunsets, making it ideal for nearby Airbnb hosting. | Sunset Viewing, Photography Spots, Nearby Cafes, Beach Access, Nature Trails |
Understanding Airbnb License Requirements & STR Laws in Jungutbatu (2026)
While Jungutbatu, Bali, Indonesia currently shows low STR regulations, specific Airbnb license requirements might still exist or change. Always verify the latest short term rental regulations and Airbnb license requirements directly with local government authorities for Jungutbatu to ensure full compliance before hosting.
(Source: AirROI data, 2026, based on 0% licensed listings)
Top Performing Airbnb Properties in Jungutbatu (2026)
Benchmark your potential! Explore examples of top-performing Airbnb properties in Jungutbatubased on Trailing Twelve Month (TTM) revenue. Analyze their characteristics, revenue, occupancy rate, and ADR to understand what drives success in this market.
New Majestic Sea Front 6BR Villa
Entire Place • 6 bedrooms
Nusa del Rey • Oceanfront 5BR • Fully Staffed
Entire Place • 5 bedrooms

Villa Seascape by Elite Havens, 5BR, Sandy Bay
Entire Place • 5 bedrooms
New Ocean Front, Villa Luna, 6BR
Entire Place • 6 bedrooms
The Shambala Villa Lembongan 5BR Ocean front
Entire Place • 5 bedrooms
VILLA BAHAGIA- LUXURY OCEANFRONT PRIVATE 4BR VILLA
Entire Place • 4 bedrooms
Note: Performance varies based on location, size, amenities, seasonality, and management quality. Data reflects the past 12 months.
Top Performing Airbnb Hosts in Jungutbatu (2026)
Learn from the best! This table showcases top-performing Airbnb hosts in Jungutbatu based on the number of properties managed and estimated total revenue over the past year. Analyze their scale and performance metrics.
| Host Name | Properties | Grossing Revenue | Stay Reviews | Avg Rating |
|---|---|---|---|---|
| The Lembongan Traveller | 31 | $1,743,040 | 725 | 4.88/5.0 |
| Elite Havens . Indonesia | 4 | $649,925 | 79 | 4.85/5.0 |
| Charles | 3 | $488,874 | 25 | 4.97/5.0 |
| Nomad Holiday Rentals | 3 | $331,317 | 28 | 4.94/5.0 |
| Chris | 1 | $276,043 | 17 | 5.00/5.0 |
| July | 2 | $263,175 | 34 | 4.86/5.0 |
| Tenang Villas | 3 | $245,467 | 108 | 4.95/5.0 |
| Nomad Holiday Rentals | 3 | $242,563 | 78 | 4.81/5.0 |
| Rachel Anne | 1 | $234,877 | 22 | 5.00/5.0 |
| Kate Erin | 3 | $212,167 | 548 | 4.90/5.0 |
Analyzing the strategies of top hosts, such as their property selection, pricing, and guest communication, can offer valuable lessons for optimizing your own Airbnb operations in Jungutbatu.
Dive Deeper: Advanced Jungutbatu STR Market Data (2026)
Ready to unlock more insights? AirROI provides access to advanced metrics and comprehensive Airbnb data for Jungutbatu. Explore detailed analytics beyond this report to refine your investment strategy, optimize pricing, and maximize your vacation rental profits.
Explore Advanced MetricsJungutbatu Short-Term Rental Market Composition (2026): Property & Room Types
Room Type Distribution
Property Type Distribution
Market Composition Insights for Jungutbatu
- The Jungutbatu Airbnb market composition is heavily skewed towards Private Room listings, which make up 58.4% of the 562 active rentals. This indicates strong guest preference for privacy and space.
- Looking at the property type distribution in Jungutbatu, House properties are the most common (49.5%), reflecting the local real estate landscape.
- Houses represent a significant 49.5% portion, catering likely to families or larger groups.
- The presence of 37.7% Hotel/Boutique listings indicates integration with traditional hospitality.
- Smaller segments like apartment/condo, unique stays, others (combined 5.9%) offer potential for unique stay experiences.
Jungutbatu Airbnb Room Capacity Analysis (2026): Bedroom Distribution
Distribution of Listings by Number of Bedrooms
Room Capacity Insights for Jungutbatu
- The dominant room capacity in Jungutbatu is 1 bedroom listings, making up 44.1% of the market. This suggests a strong demand for properties suitable for couples or solo travelers.
- Together, 1 bedroom and 2 bedrooms properties represent 62.4% of the active Airbnb listings in Jungutbatu, indicating a high concentration in these sizes.
- A significant 24.9% of listings offer 3+ bedrooms, catering to larger groups and families seeking more space in Jungutbatu.
Jungutbatu Vacation Rental Guest Capacity Trends (2026)
Distribution of Listings by Guest Capacity
Guest Capacity Insights for Jungutbatu
- The most common guest capacity trend in Jungutbatu vacation rentals is listings accommodating 2 guests (38.6%). This suggests the primary traveler segment is likely couples or solo travelers.
- Properties designed for 2 guests and 4 guests dominate the Jungutbatu STR market, accounting for 53.4% of listings.
- 22.4% of properties accommodate 6+ guests, serving the market segment for larger families or group travel in Jungutbatu.
- On average, properties in Jungutbatu are equipped to host 3.3 guests.
Jungutbatu Airbnb Booking Patterns (2026): Available vs. Booked Days
Available Days Distribution
Booked Days Distribution
Booking Pattern Insights for Jungutbatu
- The most common availability pattern in Jungutbatu falls within the 271-366 days range, representing 64.6% of listings. This suggests many properties have significant open periods on their calendars.
- Approximately 82.2% of listings show high availability (181+ days open annually), indicating potential for increased bookings or specific owner usage patterns.
- For booked days, the 1-30 days range is most frequent in Jungutbatu (39.9%), reflecting common guest stay durations or potential owner blocking patterns.
- A notable 18.5% of properties secure long booking periods (181+ days booked per year), highlighting successful long-term rental strategies or significant owner usage.
Jungutbatu Airbnb Minimum Stay Requirements Analysis
Distribution of Listings by Minimum Night Requirement
1 Night
385 listings
68.5% of total
2 Nights
66 listings
11.7% of total
3 Nights
15 listings
2.7% of total
4-6 Nights
1 listings
0.2% of total
30+ Nights
95 listings
16.9% of total
Key Insights
- The most prevalent minimum stay requirement in Jungutbatu is 1 Night, adopted by 68.5% of listings. This highlights the market's preference for shorter, flexible bookings.
- A strong majority (80.2%) of the Jungutbatu Airbnb data shows acceptance of very short stays (1-2 nights), indicating a dynamic, high-turnover market.
- A significant segment (16.9%) caters to monthly stays (30+ nights) in Jungutbatu, pointing to opportunities in the extended-stay market.
Recommendations
- Align with the market by considering a 1 Night minimum stay, as 68.5% of Jungutbatu hosts use this setting.
- Explore offering discounts for stays of 30+ nights to attract the 16.9% of the market seeking extended stays.
- Adjust minimum nights based on seasonality – potentially shorter during low season and longer during peak demand periods in Jungutbatu.
Jungutbatu Airbnb Cancellation Policy Trends Analysis (2026)
Limited
8 listings
1.4% of total
Super Strict 60 Days
19 listings
3.4% of total
Super Strict 30 Days
37 listings
6.6% of total
Flexible
142 listings
25.4% of total
Moderate
67 listings
12% of total
Firm
136 listings
24.3% of total
Strict
151 listings
27% of total
Cancellation Policy Insights for Jungutbatu
- The prevailing Airbnb cancellation policy trend in Jungutbatu is Strict, used by 27% of listings.
- A majority (51.3%) of hosts in Jungutbatu utilize Firm or Strict policies, indicating a market where hosts prioritize booking security.
Recommendations for Hosts
- Consider adopting a Strict policy to align with the 27% market standard in Jungutbatu.
- Regularly review your cancellation policy against competitors and market demand shifts in Jungutbatu.
Jungutbatu STR Booking Lead Time Analysis (2026)
Average Booking Lead Time by Month
Booking Lead Time Insights for Jungutbatu
- The overall average booking lead time for vacation rentals in Jungutbatu is 61 days.
- Guests book furthest in advance for stays during July (average 80 days), likely coinciding with peak travel demand or local events.
- The shortest booking windows occur for stays in February (average 41 days), indicating more last-minute travel plans during this time.
- Seasonally, Fall (75 days avg.) sees the longest lead times, while Winter (52 days avg.) has the shortest, reflecting typical travel planning cycles.
Recommendations for Hosts
- Use the overall average lead time (61 days) as a baseline for your pricing and availability strategy in Jungutbatu.
- For July stays, consider implementing length-of-stay discounts or slightly higher rates for bookings made less than 80 days out to capitalize on advance planning.
- Target marketing efforts for the Fall season well in advance (at least 75 days) to capture early planners.
- Monitor your own booking lead times against these Jungutbatu averages to identify opportunities for dynamic pricing adjustments.
Popular & Essential Airbnb Amenities in Jungutbatu (2026)
Amenity Prevalence
Amenity Insights for Jungutbatu
- Essential amenities in Jungutbatu that guests expect include: Air conditioning, Wifi. Lacking these (any) could significantly impact bookings.
- Popular amenities like Pool, Free parking on premises, Essentials are common but not universal. Offering these can provide a competitive edge.
- A pool is a highly desired but not standard amenity, making it a key feature for attracting guests seeking leisure in Jungutbatu.
Recommendations for Hosts
- Ensure your listing includes all essential amenities for Jungutbatu: Air conditioning, Wifi.
- Prioritize adding missing essentials: Air conditioning, Wifi.
- Consider adding popular differentiators like Pool or Free parking on premises to increase appeal.
- Highlight unique or less common amenities you offer (e.g., hot tub, dedicated workspace, EV charger) in your listing description and photos.
- Regularly check competitor amenities in Jungutbatu to stay competitive.
Jungutbatu Airbnb Guest Demographics & Profile Analysis (2026)
Guest Profile Summary for Jungutbatu
- The typical guest profile for Airbnb in Jungutbatu consists of predominantly international visitors (99%), with top international origins including United Kingdom, typically belonging to the Post-2000s (Gen Z/Alpha) group (50%), primarily speaking English or French.
- Domestic travelers account for 0.9% of guests.
- Key international markets include Australia (30.2%) and United Kingdom (10.5%).
- Top languages spoken are English (50.3%) followed by French (12.6%).
- A significant demographic segment is the Post-2000s (Gen Z/Alpha) group, representing 50% of guests.
Recommendations for Hosts
- Focus marketing internationally, particularly towards travelers from United Kingdom.
- Tailor amenities and listing descriptions to appeal to the dominant Post-2000s (Gen Z/Alpha) demographic (e.g., highlight fast WiFi, smart home features, local guides).
- Highlight unique local experiences or amenities relevant to the primary guest profile.
- Consider seasonal promotions aligned with peak travel times for key origin markets.
Nearby Short-Term Rental Market Comparison
How does the Jungutbatu Airbnb market stack up against its neighbors? Compare key performance metrics like average monthly revenue, ADR, and occupancy rates in surrounding areas to understand the broader regional STR landscape.
| Market | Active Properties | Monthly Revenue | Daily Rate | Avg. Occupancy |
|---|---|---|---|---|
| Pejeng | 11 | $6,447 | $575.53 | 43% |
| Padangaji | 16 | $6,120 | $300.47 | 64% |
| BATAS DESA BATU JANGKIH | 13 | $4,822 | $309.81 | 55% |
| Kecamatan Praya Barat | 30 | $3,939 | $414.82 | 39% |
| Bedulu | 34 | $3,142 | $269.69 | 42% |
| Tangkas | 16 | $2,982 | $276.74 | 30% |
| Pejeng Kawan | 105 | $2,909 | $237.67 | 41% |
| Pecatu | 1,743 | $2,845 | $229.93 | 48% |
| Uluwatu | 30 | $2,806 | $254.53 | 56% |
| Seminyak | 1,680 | $2,790 | $282.61 | 42% |