Gerokgak Airbnb Market Analysis 2026: Short Term Rental Data & Vacation Rental Statistics in Bali, Indonesia
Is Airbnb profitable in Gerokgak in 2026? Explore comprehensive Airbnb analytics for Gerokgak, Bali, Indonesia to uncover income potential. This 2026 STR market report for Gerokgak, based on AirROI data from February 2025 to January 2026, reveals key trends in the niche market of 19 active listings.
Whether you're considering an Airbnb investment in Gerokgak, optimizing your existing vacation rental, or exploring rental arbitrage opportunities, understanding the Gerokgak Airbnb data is crucial. Leveraging the low regulation environment is key to maximizing your short term rental income potential. Let's dive into the specifics.
Key Gerokgak Airbnb Performance Metrics Overview
Monthly Airbnb Revenue Variations & Income Potential in Gerokgak (2026)
Understanding the monthly revenue variations for Airbnb listings in Gerokgak is key to maximizing your short term rental income potential. Seasonality significantly impacts earnings. Our analysis, based on data from the past 12 months, shows that the peak revenue month for STRs in Gerokgak is typically July, while April often presents the lowest earnings, highlighting opportunities for strategic pricing adjustments during shoulder and low seasons. Explore the typical Airbnb income in Gerokgak across different performance tiers:
- Best-in-class properties (Top 10%) achieve $2,348+ monthly, often utilizing dynamic pricing and superior guest experiences.
- Strong performing properties (Top 25%) earn $1,334 or more, indicating effective management and desirable locations/amenities.
- Typical properties (Median) generate around $607 per month, representing the average market performance.
- Entry-level properties (Bottom 25%) see earnings around $201, often with potential for optimization.
Average Monthly Airbnb Earnings Trend in Gerokgak
Gerokgak Airbnb Occupancy Rate Trends (2026)
Maximize your bookings by understanding the Gerokgak STR occupancy trends. Seasonal demand shifts significantly influence how often properties are booked. Typically, Julysees the highest demand (peak season occupancy), while April experiences the lowest (low season). Effective strategies, like adjusting minimum stays or offering promotions, can boost occupancy during slower periods. Here's how different property tiers perform in Gerokgak:
- Best-in-class properties (Top 10%) achieve 61%+ occupancy, indicating high desirability and potentially optimized availability.
- Strong performing properties (Top 25%) maintain 41% or higher occupancy, suggesting good market fit and guest satisfaction.
- Typical properties (Median) have an occupancy rate around 24%.
- Entry-level properties (Bottom 25%) average 12% occupancy, potentially facing higher vacancy.
Average Monthly Occupancy Rate Trend in Gerokgak
Average Daily Rate (ADR) Airbnb Trends in Gerokgak (2026)
Effective short term rental pricing strategy in Gerokgak involves understanding monthly ADR fluctuations. The Average Daily Rate (ADR) for Airbnb in Gerokgak typically peaks in July and dips lowest during November. Leveraging Airbnb dynamic pricing tools or strategies based on this seasonality can significantly boost revenue. Here's a look at the typical nightly rates achieved:
- Best-in-class properties (Top 10%) command rates of $202+ per night, often due to premium features or locations.
- Strong performing properties (Top 25%) achieve nightly rates of $146 or more.
- Typical properties (Median) charge around $92 per night.
- Entry-level properties (Bottom 25%) earn around $40 per night.
Average Daily Rate (ADR) Trend by Month in Gerokgak
Get Live Gerokgak Market Intelligence 👇

Explore Real-time Analytics
Airbnb Seasonality Analysis & Trends in Gerokgak (2026)
Peak Season (July, September, October)
- Revenue averages $1,537 per month
- Occupancy rates average 38.5%
- Daily rates average $105
Shoulder Season
- Revenue averages $1,013 per month
- Occupancy maintains around 27.8%
- Daily rates hold near $104
Low Season (March, April, May)
- Revenue drops to average $530 per month
- Occupancy decreases to average 23.1%
- Daily rates adjust to average $116
Seasonality Insights for Gerokgak
- The Airbnb seasonality in Gerokgak shows highly seasonal trends requiring careful strategy. While the sections above show seasonal averages, it's also insightful to look at the extremes:
- During the high season, the absolute peak month showcases Gerokgak's highest earning potential, with monthly revenues capable of climbing to $1,623, occupancy reaching a high of 39.6%, and ADRs peaking at $119.
- Conversely, the slowest single month of the year, typically falling within the low season, marks the market's lowest point. In this month, revenue might dip to $418, occupancy could drop to 19.6%, and ADRs may adjust down to $91.
- Understanding both the seasonal averages and these monthly peaks and troughs in revenue, occupancy, and ADR is crucial for maximizing your Airbnb profit potential in Gerokgak.
Seasonal Strategies for Maximizing Profit
- Peak Season: Maximize revenue through premium pricing and potentially longer minimum stays. Ensure high availability.
- Low Season: Offer competitive pricing, special promotions (e.g., extended stay discounts), and flexible cancellation policies. Target off-season travelers like remote workers or budget-conscious guests.
- Shoulder Seasons: Implement dynamic pricing that balances peak and low rates. Target weekend travelers or specific events. Offer slightly more flexible terms than peak season.
- Regularly analyze your own performance against these Gerokgak seasonality benchmarks and adjust your pricing and availability strategy accordingly.
Best Areas for Airbnb Investment in Gerokgak (2026)
Exploring the top neighborhoods for short-term rentals in Gerokgak? This section highlights key areas, outlining why they are attractive for hosts and guests, along with notable local attractions. Consider these locations based on your target guest profile and investment strategy.
| Neighborhood / Area | Why Host Here? (Target Guests & Appeal) | Key Attractions & Landmarks |
|---|---|---|
| Lovina Beach | Famous for its black sand and calm waters. It's a peaceful area ideal for relaxation and dolphin watching, attracting families and couples looking for a serene getaway. | Dolphin watching, Lovina Beach, Brahma Vihara Arama, Gitgit Waterfall, Banjar Hot Springs |
| Pemuteran | Known for its beautiful beaches and excellent diving spots. It offers a quieter alternative to the more touristy areas, making it ideal for guests seeking adventure and natural beauty. | Menjangan Island, Pemuteran Beach, Biorock Program, Bali Turtle Conservancy |
| Seririt | A less commercialized area in the northern Bali region, ideal for those looking to experience traditional Balinese culture, rice terraces, and stunning landscapes. | Secret Beach, Buleleng Rice Terraces, Pura Beji Temple, Ulun Danu Beratan Temple |
| Banjar | A tranquil village known for its hot springs and lush landscapes, perfect for guests wanting a peaceful retreat amidst nature. | Banjar Hot Springs, Brahma Vihara Arama Monastery, Bali Botanical Garden |
| Singaraja | The former capital of Bali with rich history and culture. Offers guests a chance to explore Bali's heritage while being near the coast. | Gitgit Waterfall, Singaraja Harbor, Chinese Temple |
| Buleleng | A unique coastal area that features a mix of cultural experiences and beautiful beaches, drawing tourists interested in both culture and relaxation. | Melanting Waterfall, Pemuteran Beach, Ulun Danu Beratan Temple |
| Canggu | Though it's becoming popular, its laid-back atmosphere, surf beaches, and growing expat community make it a great location for hostels and boutique stays. | Canggu Beach, Echo Beach, Tanah Lot Temple, Batu Bolong Beach |
| Tanah Lot | Famous for its iconic sea temple perched on a rock, Tanah Lot attracts many tourists, making it a lucrative spot for Airbnb investments. | Tanah Lot Temple, Sandy Beaches, Sunset Views |
Understanding Airbnb License Requirements & STR Laws in Gerokgak (2026)
While Gerokgak, Bali, Indonesia currently shows low STR regulations, specific Airbnb license requirements might still exist or change. Always verify the latest short term rental regulations and Airbnb license requirements directly with local government authorities for Gerokgak to ensure full compliance before hosting.
(Source: AirROI data, 2026, finding no licensed listings among those analyzed)
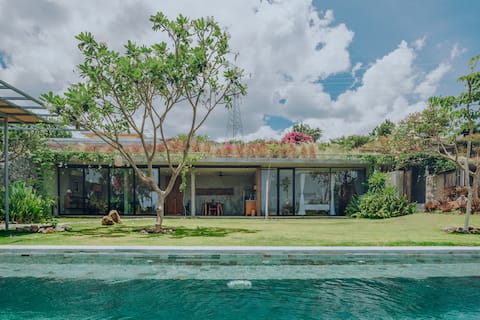
Top Performing Airbnb Properties in Gerokgak (2026)
Benchmark your potential! Explore examples of top-performing Airbnb properties in Gerokgakbased on Trailing Twelve Month (TTM) revenue. Analyze their characteristics, revenue, occupancy rate, and ADR to understand what drives success in this market.

Escape to Paradise in Oceanfront Villa Kandy II
Entire Place • 3 bedrooms
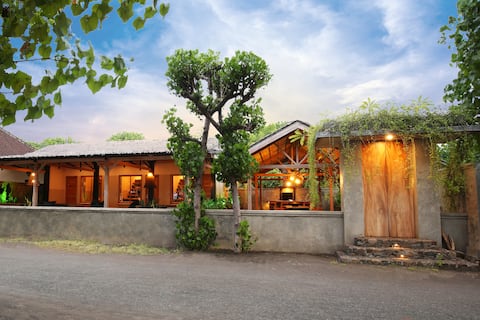
Villa Kura-Kura Sumberkima Hill
Entire Place • 1 bedroom
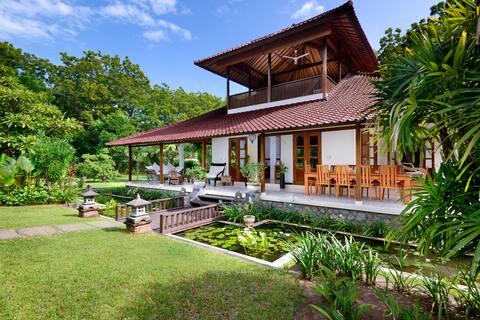
Adorable 3BR Beachfront Villa in Fishermen Village
Entire Place • 3 bedrooms
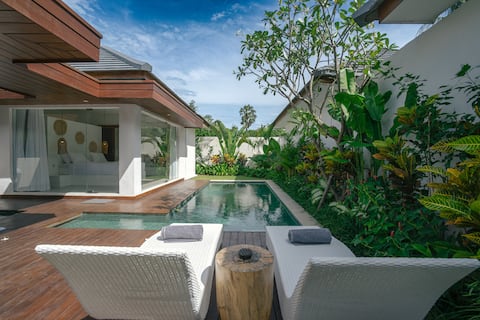
Fully private 1bd tropical hideaway in north Bali
Entire Place • 1 bedroom
Luxury private villa with pool,Bali
Entire Place • 3 bedrooms
Private tropical hideaway with pool in North Bali
Entire Place • 1 bedroom
Note: Performance varies based on location, size, amenities, seasonality, and management quality. Data reflects the past 12 months.
Top Performing Airbnb Hosts in Gerokgak (2026)
Learn from the best! This table showcases top-performing Airbnb hosts in Gerokgak based on the number of properties managed and estimated total revenue over the past year. Analyze their scale and performance metrics.
| Host Name | Properties | Grossing Revenue | Stay Reviews | Avg Rating |
|---|---|---|---|---|
| Kandy | 1 | $40,186 | 28 | 4.96/5.0 |
| Jane | 4 | $34,778 | 17 | 4.92/5.0 |
| Max | 2 | $20,372 | 97 | 4.78/5.0 |
| Yvon | 1 | $18,513 | 142 | 4.85/5.0 |
| Lisette | 1 | $9,522 | 53 | 4.92/5.0 |
| Mark | 1 | $8,812 | 44 | 4.91/5.0 |
| Gede | 1 | $5,304 | 1 | Not Rated |
| Dewi | 3 | $4,691 | 47 | 4.59/5.0 |
| Wisnu | 1 | $2,576 | 1 | Not Rated |
| Gatot | 1 | $1,285 | 2 | Not Rated |
Analyzing the strategies of top hosts, such as their property selection, pricing, and guest communication, can offer valuable lessons for optimizing your own Airbnb operations in Gerokgak.
Dive Deeper: Advanced Gerokgak STR Market Data (2026)
Ready to unlock more insights? AirROI provides access to advanced metrics and comprehensive Airbnb data for Gerokgak. Explore detailed analytics beyond this report to refine your investment strategy, optimize pricing, and maximize your vacation rental profits.
Explore Advanced MetricsGerokgak Short-Term Rental Market Composition (2026): Property & Room Types
Room Type Distribution
Property Type Distribution
Market Composition Insights for Gerokgak
- The Gerokgak Airbnb market composition is heavily skewed towards Entire Home/Apt listings, which make up 63.2% of the 19 active rentals. This indicates strong guest preference for privacy and space.
- However, a notable 36.8% share for Private Rooms suggests opportunities for budget-conscious travelers or hosts renting out spare rooms.
- Looking at the property type distribution in Gerokgak, House properties are the most common (73.7%), reflecting the local real estate landscape.
- Houses represent a significant 73.7% portion, catering likely to families or larger groups.
- The presence of 26.3% Hotel/Boutique listings indicates integration with traditional hospitality.
Gerokgak Airbnb Room Capacity Analysis (2026): Bedroom Distribution
Distribution of Listings by Number of Bedrooms
Room Capacity Insights for Gerokgak
- The dominant room capacity in Gerokgak is 1 bedroom listings, making up 47.4% of the market. This suggests a strong demand for properties suitable for couples or solo travelers.
- Together, 1 bedroom and 3 bedrooms properties represent 68.5% of the active Airbnb listings in Gerokgak, indicating a high concentration in these sizes.
- A significant 31.7% of listings offer 3+ bedrooms, catering to larger groups and families seeking more space in Gerokgak.
Gerokgak Vacation Rental Guest Capacity Trends (2026)
Distribution of Listings by Guest Capacity
Guest Capacity Insights for Gerokgak
- The most common guest capacity trend in Gerokgak vacation rentals is listings accommodating 2 guests (52.6%). This suggests the primary traveler segment is likely couples or solo travelers.
- Properties designed for 2 guests and 8+ guests dominate the Gerokgak STR market, accounting for 68.4% of listings.
- A significant 52.6% of listings cater specifically to 1-2 guests, highlighting strong demand from couples and solo travelers in Gerokgak.
- 26.4% of properties accommodate 6+ guests, serving the market segment for larger families or group travel in Gerokgak.
- On average, properties in Gerokgak are equipped to host 3.7 guests.
Gerokgak Airbnb Booking Patterns (2026): Available vs. Booked Days
Available Days Distribution
Booked Days Distribution
Booking Pattern Insights for Gerokgak
- The most common availability pattern in Gerokgak falls within the 271-366 days range, representing 73.7% of listings. This suggests many properties have significant open periods on their calendars.
- Approximately 89.5% of listings show high availability (181+ days open annually), indicating potential for increased bookings or specific owner usage patterns.
- For booked days, the 1-30 days range is most frequent in Gerokgak (36.8%), reflecting common guest stay durations or potential owner blocking patterns.
- A notable 10.5% of properties secure long booking periods (181+ days booked per year), highlighting successful long-term rental strategies or significant owner usage.
Gerokgak Airbnb Minimum Stay Requirements Analysis
Distribution of Listings by Minimum Night Requirement
1 Night
14 listings
73.7% of total
2 Nights
2 listings
10.5% of total
3 Nights
1 listings
5.3% of total
30+ Nights
2 listings
10.5% of total
Key Insights
- The most prevalent minimum stay requirement in Gerokgak is 1 Night, adopted by 73.7% of listings. This highlights the market's preference for shorter, flexible bookings.
- A strong majority (84.2%) of the Gerokgak Airbnb data shows acceptance of very short stays (1-2 nights), indicating a dynamic, high-turnover market.
- A significant segment (10.5%) caters to monthly stays (30+ nights) in Gerokgak, pointing to opportunities in the extended-stay market.
Recommendations
- Align with the market by considering a 1 Night minimum stay, as 73.7% of Gerokgak hosts use this setting.
- Explore offering discounts for stays of 30+ nights to attract the 10.5% of the market seeking extended stays.
- Adjust minimum nights based on seasonality – potentially shorter during low season and longer during peak demand periods in Gerokgak.
Gerokgak Airbnb Cancellation Policy Trends Analysis (2026)
Flexible
7 listings
36.8% of total
Moderate
2 listings
10.5% of total
Firm
6 listings
31.6% of total
Strict
4 listings
21.1% of total
Cancellation Policy Insights for Gerokgak
- The prevailing Airbnb cancellation policy trend in Gerokgak is Flexible, used by 36.8% of listings.
- A majority (52.7%) of hosts in Gerokgak utilize Firm or Strict policies, indicating a market where hosts prioritize booking security.
Recommendations for Hosts
- Consider adopting a Flexible policy to align with the 36.8% market standard in Gerokgak.
- Regularly review your cancellation policy against competitors and market demand shifts in Gerokgak.
Gerokgak STR Booking Lead Time Analysis (2026)
Average Booking Lead Time by Month
Booking Lead Time Insights for Gerokgak
- The overall average booking lead time for vacation rentals in Gerokgak is 61 days.
- Guests book furthest in advance for stays during August (average 93 days), likely coinciding with peak travel demand or local events.
- The shortest booking windows occur for stays in December (average 23 days), indicating more last-minute travel plans during this time.
- Seasonally, Summer (74 days avg.) sees the longest lead times, while Winter (32 days avg.) has the shortest, reflecting typical travel planning cycles.
Recommendations for Hosts
- Use the overall average lead time (61 days) as a baseline for your pricing and availability strategy in Gerokgak.
- For August stays, consider implementing length-of-stay discounts or slightly higher rates for bookings made less than 93 days out to capitalize on advance planning.
- Target marketing efforts for the Summer season well in advance (at least 74 days) to capture early planners.
- Monitor your own booking lead times against these Gerokgak averages to identify opportunities for dynamic pricing adjustments.
Popular & Essential Airbnb Amenities in Gerokgak (2026)
Amenity Prevalence
Amenity Insights for Gerokgak
- Popular amenities like Wifi, Free parking on premises, Air conditioning are common but not universal. Offering these can provide a competitive edge.
- Warning: Wifi is not universally provided but is considered essential globally. Ensure reliable Wifi is offered.
Recommendations for Hosts
- Consider adding popular differentiators like Wifi or Free parking on premises to increase appeal.
- Highlight unique or less common amenities you offer (e.g., hot tub, dedicated workspace, EV charger) in your listing description and photos.
- Regularly check competitor amenities in Gerokgak to stay competitive.
Gerokgak Airbnb Guest Demographics & Profile Analysis (2026)
Guest Profile Summary for Gerokgak
- The typical guest profile for Airbnb in Gerokgak consists of predominantly international visitors (96%), with top international origins including Netherlands, typically belonging to the Post-2000s (Gen Z/Alpha) group (50%), primarily speaking English or French.
- Domestic travelers account for 3.9% of guests.
- Key international markets include France (21.1%) and Netherlands (13.2%).
- Top languages spoken are English (39.7%) followed by French (12.8%).
- A significant demographic segment is the Post-2000s (Gen Z/Alpha) group, representing 50% of guests.
Recommendations for Hosts
- Focus marketing internationally, particularly towards travelers from Netherlands.
- Tailor amenities and listing descriptions to appeal to the dominant Post-2000s (Gen Z/Alpha) demographic (e.g., highlight fast WiFi, smart home features, local guides).
- Highlight unique local experiences or amenities relevant to the primary guest profile.
- Consider seasonal promotions aligned with peak travel times for key origin markets.
Nearby Short-Term Rental Market Comparison
How does the Gerokgak Airbnb market stack up against its neighbors? Compare key performance metrics like average monthly revenue, ADR, and occupancy rates in surrounding areas to understand the broader regional STR landscape.
| Market | Active Properties | Monthly Revenue | Daily Rate | Avg. Occupancy |
|---|---|---|---|---|
| Pejeng | 11 | $6,447 | $575.53 | 43% |
| Padangaji | 16 | $6,120 | $300.47 | 64% |
| Bedulu | 34 | $3,142 | $269.69 | 42% |
| Tangkas | 16 | $2,982 | $276.74 | 30% |
| Pejeng Kawan | 105 | $2,909 | $237.67 | 41% |
| Pecatu | 1,743 | $2,845 | $229.93 | 48% |
| Uluwatu | 30 | $2,806 | $254.53 | 56% |
| Seminyak | 1,680 | $2,790 | $282.61 | 42% |
| Sanding | 12 | $2,737 | $217.22 | 35% |
| Pejeng Kaja | 39 | $2,632 | $200.17 | 45% |